
基于摄影测量的ASTER影像云顶高度解算模型与实验
作者简介:何永健(1977-),男,博士,讲师,研究方向为3S集成与气象应用。E-mail:yongjian_he@163.com
收稿日期: 2014-06-03
要求修回日期: 2014-08-14
网络出版日期: 2015-02-10
基金资助
国家自然科学基金项目“复杂地形下月平均气温分布式模型研究”(41175077)
Study on Calculating Cloud-Top Height from ASTER Images Using Photogrammetry
Received date: 2014-06-03
Request revised date: 2014-08-14
Online published: 2015-02-10
Copyright
云顶高度是天气预报、天气监测的重要因子,准确的云顶高度对提高天气分析和数值预报的质量,具有重要的科学意义。立体几何法是公认云顶高度解算精度较高的方法,目前,普遍采用卫星-球心-投影云-真云的平面和球面三角几何关系,以及影像匹配技术解算云顶高度,由于采用了理想椭球体和重投影技术,以及对云移动考虑不足,因此误差较大。本文将数字摄影测量理论与遥感技术相结合,首次将摄影测量共线方程用于云顶高度解算。本文利用ASTER影像,依据相关系数法解求云迹风,并将其引入到摄影测量共线方程中,建立了ASTER影像的云顶高度解算模型,进行了未考虑和考虑风速的云顶高度解算,通过地面点计算,本文解算误差为2个像元(30 m)左右,经与MISR云顶高度产品对比分析,认为该模型解算的考虑风速的云顶高度精度优于MISR解算结果。
何永健 , 张娅琳 , 邱新法 , 曹芸 . 基于摄影测量的ASTER影像云顶高度解算模型与实验[J]. 地球信息科学学报, 2015 , 17(2) : 229 -235 . DOI: 10.3724/SP.J.1047.2015.00229
Cloud-top height is an important factor in weather forecasting and monitoring. Accurate cloud-top height has important scientific significance for improving the quality of both weather analyses and numerical weather prediction. The geometric method to calculate cloud-top height using stereo image pair obtained from meteorological satellites has been recognized as providing relatively high precision, and has practical importance. However, this method does not fully consider cloud movement and typically assumes ideal ellipsoids in theory. Thus, the calculated cloud-top height still has a relatively large error in practice. In this study, cloud-movement speed was introduced into the collinearity equation of photogrammetry. We established a model to calculate the cloud-top height from the ASTER images (3B and 3N) with digital photogrammetry and remote sensing technology. Firstly, we created a stereo pair from ASTER images obtained on 25th September 2012. Then, the cloud-movement speed was calculated through matching cloud points. Finally, the cloud-top heights with and without consideration of wind speed were both calculated. Compared with ground control points, the model error is determined to be within two pixels (about 30 meter). We further compared our results with MISR products, and found that the cloud-top height determined without using wind speed is consistent with the height obtained from MISR, the difference between them is about 300 meters. Our cloud-top height determined with wind speed considered, however is about 1400 meters higher than that of MISR without wind considered. Marchand and Naud had identified in their research that the cloud-top height obtained from MISR is about 1000 meters lower than Lidar observation. This implies that our results with consideration of wind speed are closer to the Lidar observations. Due to the fact that our method for determining cloud-top height is dependent on the cloud moving speed, and the results with wind speed included have led to a good estimation of cloud-top height, we conclude that the wind speed should be included in algorithms for cloud-top height determination.
Key words: ASTER; cloud-top height; cloud winds; cloud-top height calculation
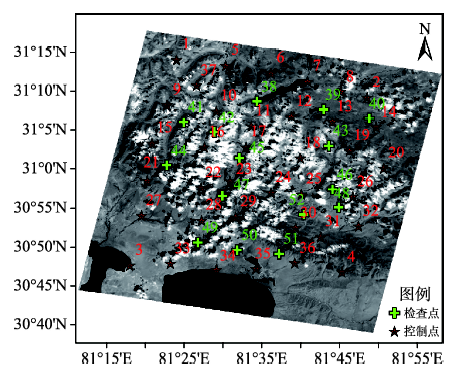
Fig. 1 Map of control-points and ASTER image图1 ASTER影像及控制点分布图 |
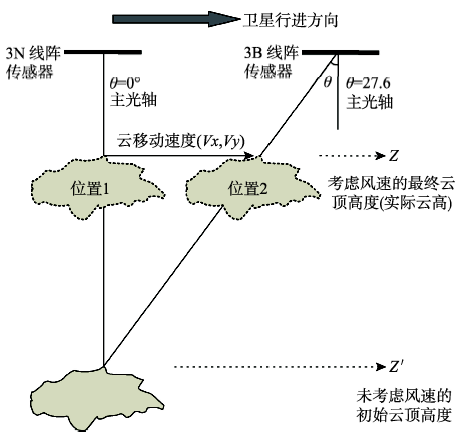
Fig. 2 Framework of calculating cloud-top height using stereo image pair with and without the consideration of wind speed图2 考虑和不考虑风速条件下的双像立体云顶高度示意图 |
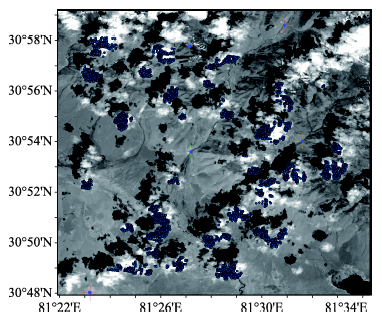
Fig. 3 Distribution of matched cloud points图3 云匹配分布图 |
Tab. 1 Statistical results of calculated cloud-top heights with and without the consideration of wind speed表1 计算的无风云高和有风云高概况统计 |
| 最大值(m) | 最小值(m) | 平均值(m) | 云高范围(m) | 对应云点个数(个) | |
|---|---|---|---|---|---|
| 无风云高 | 2490.32 | 531.81 | 1715.53 | 500~1100 | 13 |
| 1100~1600 | 778 | ||||
| 1600~2100 | 2040 | ||||
| 2100~2500 | 54 | ||||
| 有风云高 | 4191.69 | 1936.0 | 3087.10 | 1900~2400 | 39 |
| 2400~2900 | 725 | ||||
| 2900~3400 | 1671 | ||||
| 3400~3900 | 419 | ||||
| 3900~4200 | 31 |
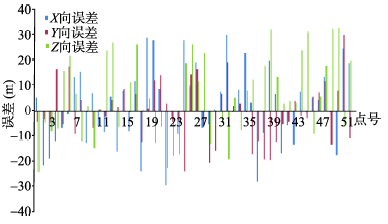
Fig. 4 Error distribution of the simulated control-points in X, Y, Z directions图4 模型解算的控制点X,Y,Z 3个方向绝对误差分布 |
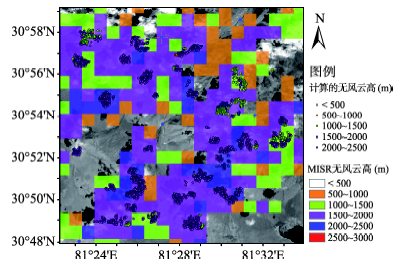
Fig.5 Comparison of the calculated and MISR produced cloud-top heights without consideration of wind speed图5 计算的无风云高与MISR无风云高产品对比图 |
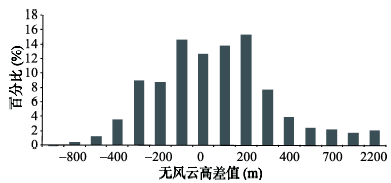
Fig. 6 Statistical distribution of the difference between the calculated and MISR produced cloud-top heights without consideration of wind speed图6 无风云高与MISR无风云高差值分布统计图 |
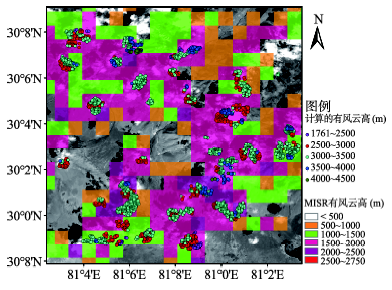
Fig. 7 Comparison of calculated and MISR produced cloud-top heights without consideration of wind speed图7 计算的有风云高与MISR有风云高产品对比图 |
Tab. 2 Statistics of the difference between calculated and MISR produced cloud-top heights without consideration of wind speed表2 计算的有风云高与MISR有风计算云高及二者差值统计 |
| 云高差值 (m) | 云高差值范围 (m) | 对应云点比例(%) | |
|---|---|---|---|
| 最大值 | 2002.47 | 700~1000 | 2.98 |
| 1000~1200 | 15.25 | ||
| 最小值 | 796.37 | 1200~1400 | 40.10 |
| 1400~1600 | 26.38 | ||
| 平均值 | 1431.41 | 1600~1800 | 12.65 |
| 1800~2000 | 2.63 |
Fig. 8 Distribution map of the difference between MISR cloud-top heights with wind speed considered and without wind speed considered图8 MISR有风和无风云高产品云高差值分布图 |
The authors have declared that no competing interests exist.
| [1] |
|
| [2] |
|
| [3] |
|
| [4] |
|
| [5] |
|
| [6] |
|
| [7] |
|
| [8] |
|
| [9] |
|
| [10] |
|
| [11] |
|
| [12] |
|
| [13] |
|
| [14] |
|
| [15] |
|
| [16] |
|
| [17] |
EU. CLOUDMAP-Cirrus and Contrail cloud-top maps from satellites for Weather Forecasting and Climate Change Analysis: Final Report[R].EU Contract no ENV4 CT97-0399, 2001.
|
| [18] |
|
| [19] |
|
| [20] |
|
| [21] |
|
| [22] |
|
| [23] |
|
| [24] |
|
| [25] |
|
| [26] |
|
| [27] |
|
| [28] |
|
| [29] |
|
/
| 〈 |
|
〉 |