
生长模型驱动的单株杉木三维动态模拟
作者简介:唐丽玉(1972-),女,博士,副研究员,主要从事地学可视化与虚拟地理环境、虚拟植物方面的研究。E-mail: tangly@fzu.edu.cn
收稿日期: 2014-07-15
要求修回日期: 2014-11-27
网络出版日期: 2015-06-10
基金资助
国家“863”计划课题(2012AA102002)
福建省产学研重大项目(2012N5006)
Growth Model Driven Individual Tree 3D Dynamic Simulation of Cunninghamia lanceolata
Received date: 2014-07-15
Request revised date: 2014-11-27
Online published: 2015-06-10
Copyright
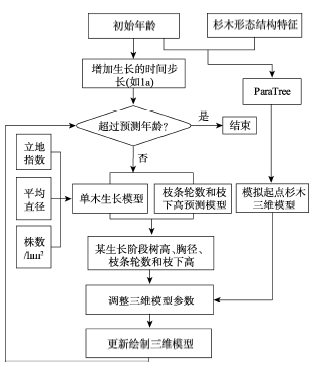
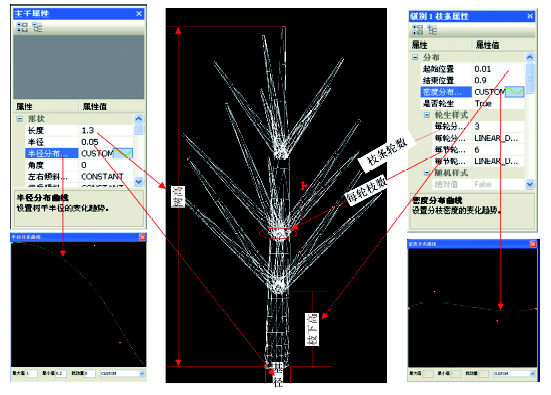
虚拟植物是一种潜在、有力的植物分析辅助工具,而单株木生长模拟是森林生态系统模拟的基础。为了动态模拟杉木生长发育过程,提出了参数化单株木三维形态结构建模和与距离无关的单木生长模型的集成方法,其主要过程为:首先,根据杉木的形态结构特征,采用参数化建模方法建立特定生长阶段的三维静态模型;其次,根据生长模型预测不同年龄杉木的树高、胸径、枝下高和分枝轮数,并与树木三维静态模型几何描述参数建立联动;最后,采用参数曲线调整干径和枝径变化、枝条长度、分枝角等形态结构参数,使模型形态随树龄增长而变化。在自主研发的ParaTree系统上,扩展杉木动态生长模拟模块,并以福建省漳平五一林场的二类调查数据为例,动态模拟了杉木的生长过程。模拟结果表明,本方法可直观表达林分中林木个体平均生长状况和大体形态结构特征。树木三维模型描述参数与传统树木统计生长模型结合,有利于重用林业领域淀积大量的生长模型。
唐丽玉 , 王灵霞 , 陈崇成 , 陈琪 . 生长模型驱动的单株杉木三维动态模拟[J]. 地球信息科学学报, 2015 , 17(6) : 668 -674 . DOI: 10.3724/SP.J.1047.2015.00668
Virtual plant is a potentially powerful tool for analyzing plant growth processes and the relationship between plant growth and environment. In order to provide an intuitive representation of forest growth and be adaptive to forest management at a deeper level, the forest growth model should be integrated with 3D tree architectural model. Individual tree growth simulation is the foundation of the simulation of forest ecosystem. The aim of this study was to link an empirical forest growth model and a 3D architectural model to dynamically simulate growth processes of an individual tree. Individual-level simulation of Cunninghamia lanceolata was implemented by integrating a 3D parametric model and a distance-independent individual tree growth dynamics model. The 3D parametric model was created in ParaTree, a system developed by our work group. First of all, according to the morphological characteristics of Cunninghamia lanceolata, parametric modeling method is adopted to generate a 3D model. Then the tree height, diameter at breast height, height under branch, and the whorls of branches are predicted in the growth model based on a site quality, planting density and age. Geometric descriptive parameters of 3D tree model are then updated according to the architectural parameters. Finally, the parametric curve is applied to adjust stem diameter and tree diameter, the length of the branches, branching angle and so on to make the model change with tree growth. Taking the forest resources inventory data of Wuyi forest farm of Zhangping in Fujian for an example, we simulate the growth dynamics of Cunninghamia lanceolata and express the global morphological structure characteristics at each growth stage. The growth at average of individual trees in a forest stand was represented intuitively by the means. Linking the parameters of 3D model to some existing tree empirical growth models is conducive to reuse a lot of growth models .
Fig. 1 Morphological structure parameters of Cunninghamia lanceolata图1 杉木的形态结构参数示意图 |
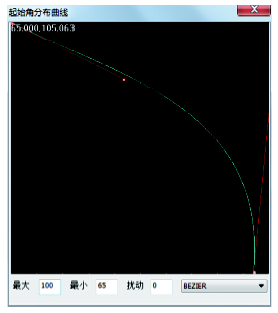
Fig. 2 Curve for controlling branching angle图2 分枝角分布控制曲线 |
Fig. 3 The flowchart of dynamic growth simulation for Cunninghamia lanceolata图3 杉木动态生长模拟流程图 |
Fig. 4 Illustration of the linkage of tree architectural parameters with its 3D model图4 树木形态参数与三维模型关联示意图 |
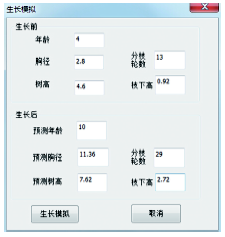
Tab.1 Comparison of data between the simulated values and the actual values表1 杉木模拟值与实际值对比 |
| 年龄 | 初始值 | 预测值(15 a生) | 预测值(20 a生) | 实际值(15 a生) | 实际值(20 a生) | |||||||||
|---|---|---|---|---|---|---|---|---|---|---|---|---|---|---|
| 胸径(cm) | 树高(m) | 胸径(cm) | 树高(m) | 胸径(cm) | 树高(m) | 胸径(cm) | 树高(m) | 胸径(cm) | 树高(m) | |||||
| 4 | 3.1 | 4.5 | 13.9 | 10.6 | 16.6 | 12.0 | 12.9 | 10.7 | 15.7 | 11.5 | ||||
| 7 | 5.7 | 4.7 | 15.1 | 13.1 | 18.3 | 14.9 | 14.5 | 13.2 | 17.7 | 14.4 | ||||
| 8 | 6.9 | 4.7 | 15.0 | 13.0 | 18.2 | 14.8 | 14.4 | 13.0 | 17.6 | 14.3 | ||||
| 10 | 10.1 | 6.8 | 15.2 | 13.2 | 18.3 | 15.0 | 14.7 | 13.4 | 17.7 | 14.7 | ||||
| 10 | 10.3 | 7.1 | 15.3 | 13.2 | 18.4 | 15.0 | 14.8 | 13.4 | 17.9 | 14.9 | ||||
| 10 | 12.2 | 8.6 | 17.0 | 15.1 | 19.7 | 16.7 | 16.7 | 14.9 | 19.7 | 16.6 | ||||
| 10 | 10.6 | 7.8 | 15.5 | 13.3 | 18.5 | 15.0 | 15.5 | 13.2 | 18.2 | 15.0 | ||||
| 11 | 5.5 | 4.5 | 11.0 | 10.6 | 15.8 | 13.5 | 10.5 | 9.7 | 14.6 | 12.6 | ||||
| 12 | 8.7 | 6.3 | 12.4 | 11.5 | 16.6 | 14.0 | 11.6 | 10.2 | 15.7 | 13.4 | ||||
| 12 | 9.8 | 8.1 | 13.2 | 12.0 | 17.1 | 14.3 | 12.7 | 10.9 | 16.3 | 13.7 | ||||
| … | … | … | … | … | … | … | … | … | … | … | ||||
Fig. 5 Parameters of Cunninghamia lanceolata before and after the growth simulation图5 杉木生长模拟前后参数 |
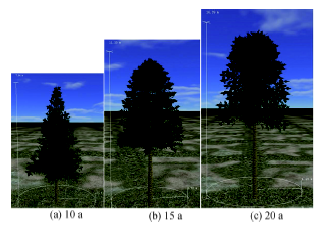
Fig. 6 Models of Cunninghamia lanceolata simulations in different stages图6 不同生长阶段杉木的模型 |
The authors have declared that no competing interests exist.
| [1] |
|
| [2] |
|
| [3] |
|
| [4] |
|
| [5] |
|
| [6] |
|
| [7] |
|
| [8] |
|
| [9] |
|
| [10] |
|
| [11] |
|
| [12] |
|
| [13] |
|
| [14] |
|
| [15] |
|
| [16] |
|
| [17] |
|
| [18] |
|
| [19] |
|
| [20] |
|
| [21] |
|
| [22] |
|
| [23] |
|
| [24] |
|
/
| 〈 |
|
〉 |
