
海南岛及北部湾海域海啸数值模拟与影响分析
作者简介:李智广(1988-),男,硕士,研究方向为GIS应用。E-mail: lgung@163.com
收稿日期: 2015-01-04
要求修回日期: 2015-03-02
网络出版日期: 2015-08-05
基金资助
广西科技攻关计划项目(桂科攻12426002)
国家自然科学基金项目(41371044)
Numerical Simulation and Analysis of Tsunami Impacts on Hainan Island and Beibu Gulf Zone
Received date: 2015-01-04
Request revised date: 2015-03-02
Online published: 2015-08-05
Copyright
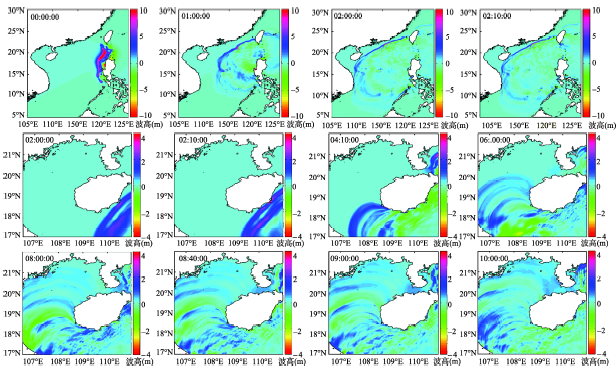
海底地震引发的海啸灾害,对沿海国家和地区的影响是相关领域的研究热点。研究采用COMCOT海啸数值模拟模型,对可能发生在马尼拉海沟一次地震活动(Mw=9.0级)所引起的海啸过程进行了数值模拟,并研究了该海啸传播到海南岛和北部湾的过程及其特点,分析海啸波对这一地区可能造成的影响。研究发现,传播到北部湾地区的海啸波具有明显的非线性特征,海啸发生后2 h 10 min左右到达海南岛东海岸,首轮波高达2.1 m;随着湾内水深逐渐变浅,受制于海底摩阻,及海南岛的阻隔与缓冲作用,海啸到达广西壮族自治区南部沿海地区的时间,被推迟到距地震发生8 h后,海啸波高减小到0.4 m,海啸波能量大为衰减。研究结果表明,马尼拉海沟地震引发海啸,对海南岛东南部沿海影响较大,有成灾的可能性;而对广西壮族自治区南部沿海及北部湾地区的影响较弱,一般不会造成大的灾害。
李智广 , 谢顺平 , 都金康 , 黄洋 , 左天惠 , 郑文龙 . 海南岛及北部湾海域海啸数值模拟与影响分析[J]. 地球信息科学学报, 2015 , 17(8) : 937 -944 . DOI: 10.3724/SP.J.1047.2015.00937
The impact of tsunami hazard to the coastal countries and regions is a hot topic within the field of tsunami research. One of the main reasons that cause a tsunami is submarine earthquake. Since the Manila Trench and a part of China´s territory cover across the South China Sea, and the trench has frequent seismic activity, it becomes a potential tsunami source which may influence the south China. A hypothetical tsunami is simulated by adopting the COMCOT numerical tsunami model, to research its effects on the area of Hainan Island and Beibu Gulf. The tsunami is triggered by an earthquake in the Manila Trench, and the entire source is discretized into 33 rectangular elements, which would produce an earthquake with a magnitude of Mw=9.0. The tsunami wave characteristics and its impacts on this region are analyzed with the help of records from the virtual tidal stations installed in the study area. The majority of tsunami energy is directed northward to the coast of China. The results indicate that the tsunami waves propagating to the Beibu Gulf Zone have distinct nonlinear characteristics, and spread more slowly than in the deep ocean. After 2 hours and 10 minutes when the earthquake occurs, the head wave propagates to the east coast of Hainan Island with the amplitude of 2.6 meters, which could bring great impacts or hazards to this area. However, because of sea bottom friction and the blocking of Hainan Island, it takes another six hours for the head wave to reach Beihai offshore, and the wave amplitude then is reduced to be less than 50 centimeters. The energy of tsunami undergoes a great loss, and it may have little impacts on the southern coast of Guangxi Province and the Beibu Gulf area. And yet, the additive effects of the tsunami and the tidal currents in the gulf area require further research.
Key words: Hainan Island and Beibu Gulf; numerical simulation; tsunami; COMCOT
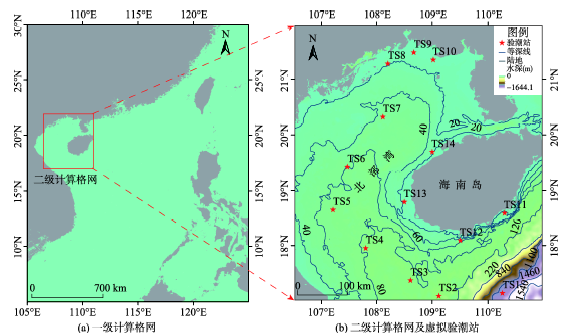
Tab. 1 Parameters configured for two-level grids in the simulated domain表1 模拟区域格网设置参数 |
| 格网 | 分辨率 | 范围 | 行列数 | 控制方程 | 坐标系 | 曼宁系数 |
|---|---|---|---|---|---|---|
| 一级 | 2′ | 5°~30°N, 105°~125°E | 751×601 | 线性 | 球坐标系 | 缺省 |
| 二级 | 0.5′ | 17°~22°N, 106.5°~111°E | 600×540 | 非线性 | 球坐标系 | 0.013-0.052 |
Fig. 1 Configuration of two-level grids and virtual tidal stations in the simulated domain图1 计算区域格网和虚拟验潮站设置 |
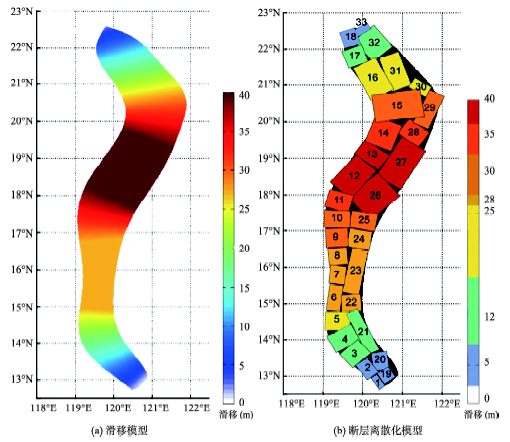
Tab. 2 The parameters of the 33 discretization fault units in Manila trench表2 马尼拉海沟33个离散化断层单元参数 |
| 序号 | 经度(°E) | 纬度(°N) | 深度(km) | 走向角(°) | 倾角(°) | 滑移角(°) | 长度(km) | 宽度(km) | 相对位移(m) |
|---|---|---|---|---|---|---|---|---|---|
| 1 | 120.5 | 12.6 | 10 | 324.46 | 21.78 | 90 | 40.41 | 19.30 | 5 |
| 2 | 120.1 | 13.2 | 10 | 325.20 | 11.26 | 90 | 54.19 | 38.68 | 5 |
| 3 | 119.8 | 13.5 | 20 | 318.66 | 6.55 | 90 | 54.09 | 66.93 | 12 |
| 4 | 119.5 | 14.0 | 20 | 332.40 | 5.79 | 90 | 54.00 | 75.68 | 12 |
| 5 | 119.3 | 14.6 | 30 | 0.26 | 6.47 | 90 | 53.89 | 67.52 | 25 |
| 6 | 119.2 | 15.1 | 30 | 7.39 | 11.50 | 90 | 80.59 | 37.51 | 28 |
| 7 | 119.3 | 15.8 | 30 | 5.85 | 10.01 | 90 | 53.56 | 43.13 | 28 |
| 8 | 119.4 | 16.3 | 30 | 355.99 | 8.46 | 90 | 53.43 | 51.06 | 28 |
| 9 | 119.3 | 16.8 | 40 | 358.34 | 7.18 | 90 | 53.28 | 60.09 | 30 |
| 10 | 119.3 | 17.4 | 40 | 2.50 | 6.16 | 90 | 53.14 | 69.93 | 30 |
| 11 | 119.3 | 17.9 | 50 | 16.26 | 6.52 | 90 | 52.99 | 65.93 | 35 |
| 12 | 119.7 | 18.5 | 50 | 40.34 | 5.93 | 90 | 105.57 | 72.15 | 40 |
| 13 | 120.2 | 19.0 | 50 | 35.93 | 5.36 | 90 | 52.60 | 79.67 | 40 |
| 14 | 120.5 | 19.6 | 50 | 21.46 | 5.70 | 90 | 78.62 | 74.61 | 35 |
| 15 | 120.9 | 20.3 | 40 | 352.23 | 3.28 | 90 | 78.24 | 129.36 | 30 |
| 16 | 120.3 | 21.0 | 30 | 332.43 | 6.25 | 90 | 103.81 | 67.36 | 25 |
| 17 | 119.8 | 21.8 | 20 | 339.52 | 7.62 | 90 | 51.68 | 54.86 | 12 |
| 18 | 119.7 | 22.2 | 10 | 341.26 | 9.89 | 90 | 46.82 | 41.97 | 5 |
| 19 | 120.6 | 13.0 | 10 | 326.63 | 28.87 | 90 | 37.50 | 37.27 | 5 |
| 20 | 120.5 | 13.4 | 10 | 351.15 | 25.45 | 90 | 54.14 | 43.11 | 5 |
| 21 | 120.0 | 14.1 | 20 | 333.5 | 30.96 | 90 | 134.88 | 34.22 | 12 |
| 22 | 119.8 | 15.0 | 30 | 357.94 | 20.98 | 90 | 53.76 | 53.11 | 28 |
| 23 | 119.8 | 16.0 | 30 | 11.30 | 24.22 | 90 | 133.84 | 45.09 | 28 |
| 24 | 119.8 | 16.8 | 30 | 9.30 | 18.22 | 90 | 53.29 | 61.36 | 28 |
| 25 | 119.8 | 17.3 | 40 | 10.90 | 15.85 | 90 | 53.15 | 70.96 | 30 |
| 26 | 120.2 | 17.8 | 50 | 47.78 | 12.76 | 90 | 105.90 | 88.63 | 40 |
| 27 | 121.0 | 18.8 | 50 | 30.91 | 14.73 | 90 | 131.68 | 75.92 | 40 |
| 28 | 121.3 | 19.7 | 50 | 37.06 | 16.31 | 90 | 52.41 | 67.88 | 35 |
| 29 | 121.7 | 20.3 | 40 | 24.75 | 23.79 | 90 | 104.39 | 44.85 | 30 |
| 30 | 121.4 | 20.8 | 30 | 302.02 | 31.89 | 90 | 51.99 | 31.66 | 25 |
| 31 | 120.9 | 21.2 | 30 | 340.64 | 19.63 | 90 | 103.67 | 55.05 | 25 |
| 32 | 120.2 | 21.9 | 20 | 320.54 | 16.07 | 90 | 77.33 | 67.83 | 12 |
| 33 | 120.0 | 22.4 | 10 | 326.04 | 24.96 | 90 | 21.26 | 41.86 | 5 |
Fig. 3 Time series of tsunami propagation图3 海啸传播时间序列图 |
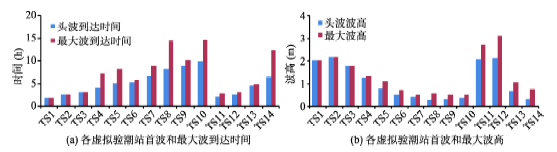
Fig. 4 The arrival time and wave heights of head-wave and maximum-wave for all tidal stations图4 各站点海啸首波和最大波到达时间和波高 |
Tab. 3 Watanabe Hideo tsunami scales表3 渡边伟夫海啸等级表 |
| 等级 | 海啸波高(m) | 海啸能量(1010 J) | 损失程度 |
|---|---|---|---|
| -1 | <0.5 | 0.06 | 能量损失 |
| 0 | 1 | 0.25 | 轻微损失 |
| 1 | 2 | 1 | 损失房屋船只 |
| 2 | 4~6 | 4 | 人员伤亡,房屋倒塌 |
| 3 | 10~20 | 16 | ≤400 km岸段严重受损,人员伤亡大、房屋损毁严重 |
| 4 | ≥30 | 64 | ≥500 km岸段严重受损,人员伤亡巨大、建筑物尽毁 |
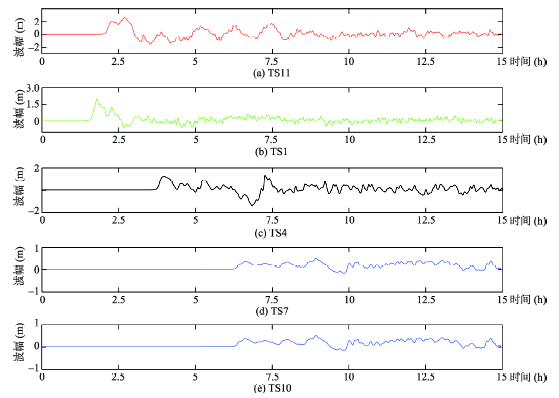
Fig. 5 The time-change curves of wave heights in some virtual tidal stations图5 不同虚拟站点波高时变特征曲线 |
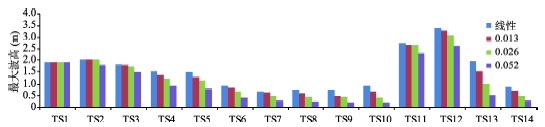
Fig. 6 Change of maximum wave heights simulated with different Manning coefficient for all virtual tidal stations图6 不同曼宁系数模拟的各虚拟验潮站最大波高变化 |
The authors have declared that no competing interests exist.
| [1] |
|
| [2] |
|
| [3] |
|
| [4] |
|
| [5] |
|
| [6] |
|
| [7] |
|
| [8] |
|
| [9] |
|
| [10] |
|
| [11] |
|
| [12] |
|
| [13] |
|
| [14] |
|
| [15] |
|
| [16] |
|
| [17] |
|
| [18] |
|
| [19] |
|
| [20] |
|
/
| 〈 |
|
〉 |