
浮动车轨迹数据聚类的有向密度方法
作者简介:廖律超(1980-),男,福建长汀人,博士生,高级工程师,研究方向为时空大数据处理、交通轨迹数据挖掘及交通行为模式识别。E-mail: achao@fjut.edu.cn
收稿日期: 2015-04-20
要求修回日期: 2015-05-18
网络出版日期: 2015-10-10
基金资助
国家自然科学基金项目(61304199、41471333);福建省高校杰出青年科研人才计划(JA14209);福建省自然科学基金项目(2013J01214);福建省科技重大专项专题项目(2013HZ0002-1);福建省科技计划重点项目(2011I0002);福建省交通科技计划项目(201318)
A Fast Method of FCD Trajectory Data Clustering Based on the Directed Density
Received date: 2015-04-20
Request revised date: 2015-05-18
Online published: 2015-10-10
Copyright
为了充分挖掘浮动车轨迹数据的潜在特性,本文在OPTICS空间密度聚类算法基础上,提出了一种有向密度的快速聚类方法(D-OPTICS)。该方法通过扇形空间邻域计算其有向密度信息,并基于方向信息约束其密度可连通性,通过有向可达距离曲线生成数据基本簇,最后,通过空间网格及类簇聚合等优化方法,实现其大规模浮动车轨迹数据的快速聚类处理。通过有向时空数据的聚类分析,发现浮动车轨迹的时空分布特性,以提取复杂路网的结构信息。本文以福州市大规模浮动车轨迹数据,对D-OPTICS进行了系统实验,分析表明,该算法可实现浮动车轨迹数据的快速有向密度聚类分析,有助于挖掘发现时空轨迹数据的分布规律,且基于聚类结果提取了福州市区复杂路网的有向拓扑结构图。同时,与DBSCAN及OPTICS等传统的密度聚类算法进行性能对比,实验表明,D-OPTICS算法能更好地支持大规模浮动车轨迹数据的处理要求。
廖律超 , 蒋新华 , 邹复民 , 李璐明 , 赖宏图 . 浮动车轨迹数据聚类的有向密度方法[J]. 地球信息科学学报, 2015 , 17(10) : 1152 -1161 . DOI: 10.3724/SP.J.1047.2015.01152
Floating car data (FCD), which is the trajectories of vehicles, are automatically collected by huge quantities of commercial vehicles which are equipped with GPS devices. Exploring and exploiting such data is essential to understand the dynamic aggregation patterns of trajectory data. However, the existing methods of spatial density clustering mainly focus on undirected data, and it is difficult to effectively find the characteristics of trajectory data. We contribute to the literatures on FCD trajectory data mining by presenting a novel method called directed density clustering method (D-OPTICS), which is formulated based on the spatial density clustering algorithm (OPTICS). In our method, the directed density is computed by a fan-shaped neighborhood region, and the density connectivity is restrained by its direction information. Then, the base clusters are generated using the curve analysis of reachable distance. Finally, the D-OPTICS cluster method is formed by the optimization method of spatial grid and cluster polymerization. This method can be naturally applied to FCD trajectory data mining, and it is also appropriate for handling other directed spatial data. It can be employed to discover the spatio-temporal distribution characteristic of traffic trajectory, and then be adopted to extract the structure information of complex road network. The experiments, with massive floating car data of Fuzhou city, show that the D-OPTICS can cluster directed spatial data effectively, and is useful to uncover the inherent distribution characteristic of the massive trajectory data. Based on its clustering result, the topology information of road network can be extracted. In this work, we extracted the topology graph for the complex road network of Fuzhou city. The experiment results also show that the algorithm can automatically determine the number of clusters, and it is found that the algorithm is not limited to globular cluster data and is capable to deal with clusters of arbitrary shapes. The key contribution of this method is that it takes the direction information into account and it can also be effective in reducing the problems caused by traditional clustering algorithms which may incorrectly merge or decompose thus naturally produce large clusters and noise data. Meanwhile, the result of performance experiments shows that, compared with DBSCAN and OPTICS, the proposed method is more suitable for large-scale data processing.
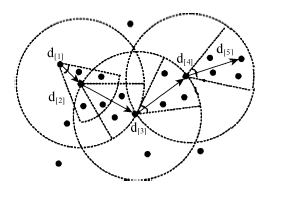
Fig. 1 Directed directly density-reachable图1 直接有向密度可达 |
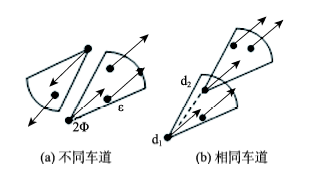
Fig. 2 The diagram of directed connected-density图2 有向密度相连示意图 |
Tab. 1 FCD trajectory data based on directed density by D-OPTICS algorithm表1 基于有向密度的浮动车轨迹数据聚类D-OPTICS算法 |
| 输入: 浮动车轨迹数据集 输出: 不同道路、不同车道的浮动车轨迹数据簇 |
|---|
| 步骤1: 按精度要求建立空间网格,并将数据按网格划分为数据子集; repeat { 步骤2: 结合轨迹数据方向区间信息,并将数据集gi划分为数据子集; repeat { 步骤3: 选取一个数据子集,计算其核心距离和可达距离次序图rdi; } until 完成所有方向区间的计算,方向值从大到小拼合成整个数据集的可达距离图 步骤4: 根据可达距离的峰值变化生成基本簇; 步骤5: 根据道路方向变化的渐变性原则,基于凝聚层次聚类的思想,合并方向变化较小且存在共同边界粘合点的基本簇,进而得到最终的簇划分; } until 完成所有网格数据子集的计算 |
Fig. 3 The diagram of FCD trajectory data based on directed density图3 浮动车轨迹数据有向密度图 |
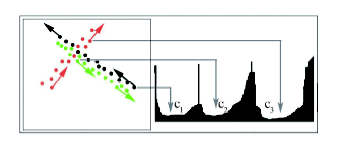
Fig. 4 The diagram of reachable distance sequence图4 可达距离序列示意图 |
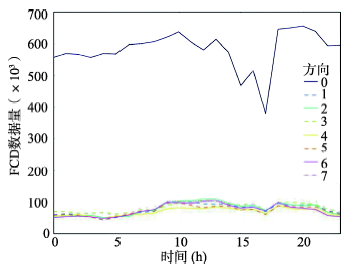
Fig. 5 The statistical chart of direction data图5 方向数据统计图 |
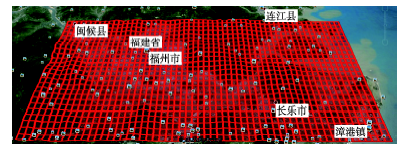
Fig. 6 The image of spatial information grid图6 空间信息网格图 |
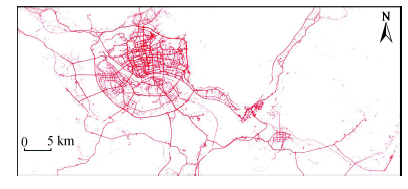
Fig. 7 The image of polymeric road network (for Fuzhou city)图7 交通路网聚合图(福州市) |
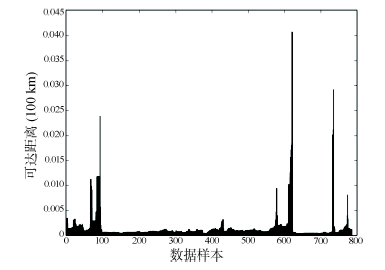
Fig. 8 The diagram of directly reachable distance (single grid)图8 有向可达距离图(单网格) |
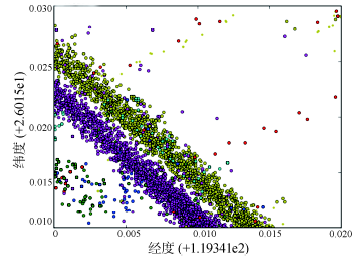
Fig. 9 The diagram of clustering based on D-OPTICS algorithm图9 D-OPTICS聚类效果图 |
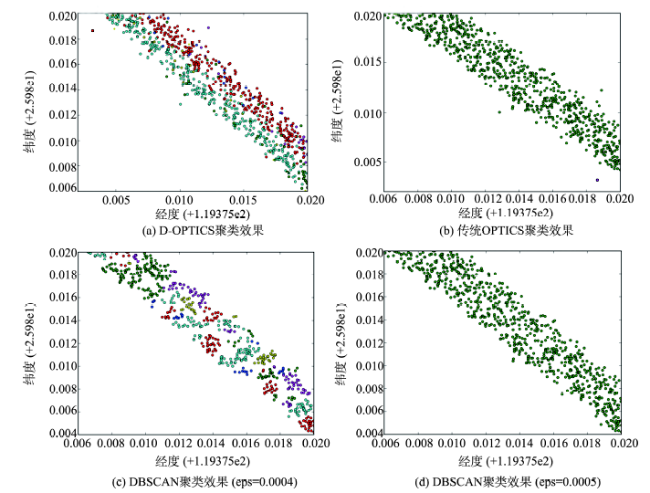
Fig. 10 Comparison of the resultant clustering effects between D-OPTICS, DBSCAN and OPTICS algorithms图10 D-OPITCS与DBSCAN、OPTICS算法聚类效果对比图 |
Fig. 11 The diagrams of clustering based on D-OPTICS algorithm图11 D-OPITCS算法聚类效果图 |
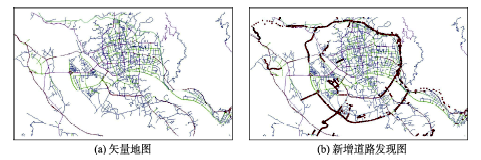
Fig. 12 The diagrams of new road detection experiment图12 新增道路检测实验图 |
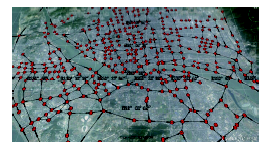
Fig. 13 The road network topology of Fuzhou urban area图13 福州市区路网拓扑结构图 |
Tab. 2 The comparison of algorithms’ performance表2 算法性能测试对比表 |
| 序号 | 样本量(个) | 邻域半径(m) | MinPts | DBSCAN | OPTICS | D-OPTICS |
|---|---|---|---|---|---|---|
| 1 | 5000 | 100 | 10 | 2.14 | 5.73 | 4.31 |
| 2 | 10 000 | 50 | 20 | 4.66 | 13.81 | 9.63 |
| 3 | 50 000 | 10 | 20 | 34.86 | 93.56 | 63.29 |
| 4 | 100 000 | 10 | 20 | 214.51 | 221.31 | 136.79 |
| 5 | 500 000 | 10 | 20 | 2216.42 | 1286.36 | 739.18 |
The authors have declared that no competing interests exist.
| [1] |
|
| [2] |
|
| [3] |
|
| [4] |
|
| [5] |
|
| [6] |
|
| [7] |
|
| [8] |
|
| [9] |
|
| [10] |
|
| [11] |
|
| [12] |
|
| [13] |
|
| [14] |
|
| [15] |
|
| [16] |
|
| [17] |
|
| [18] |
|
| [19] |
Rocha J A M R,
|
| [20] |
|
| [21] |
|
/
| 〈 |
|
〉 |

