
华东地区MODIS与OMI气溶胶光学厚度数据融合
作者简介:李龙(1988-),男,硕士生,主要从事大气与环境遥感方面研究。E-mail: lennonrs@126.com
收稿日期: 2014-12-24
要求修回日期: 2015-02-26
网络出版日期: 2015-10-10
基金资助
上海市科委重点支撑项目(13231203804);国家自然科学基金项目(41201358)
Data Fusion of MODIS AOD and OMIAOD over East China Using Universal Kriging
Received date: 2014-12-24
Request revised date: 2015-02-26
Online published: 2015-10-10
Copyright
气溶胶光学厚度(AOD)表征气溶胶对光的衰减作用,体现大气混浊度或大气中气溶胶总含量,其卫星产品是研究近年来不断恶化的大气环境与空气质量的良好数据源。AOD卫星产品种类较多,但数据存在较大的不确定性;气溶胶全球监测网(AERONET)的地基数据精度高,但空间覆盖度较差。泛克里金法(UK)能在数据融合过程中更多地考虑描述对象的空间相关性,并且简单易行、结果可靠。因此,本文采用该方法,结合二次多项式波段插值法和回归分析方法,在AERONET AOD数据的基础上,对2008年11月华东地区臭氧监测仪(OMI)和中分辨率成像光谱仪(MODIS)的AOD产品进行了融合。结果表明:二次多项式的AOD波段插值方法,能提供比Angstrom波长指数法更为精准的AOD插值结果;AOD融合产品的空间分辨率高于OMI AOD,覆盖率大于OMIAOD和MODIS AOD,且其精度优于这2种AOD卫星产品;融合产品图显示,2008年11月,华东地区的AOD总体呈现南低北高的趋势,高值区主要分布在长江三角洲部分地区、安徽东北部、苏鲁交界处,以及山东西部;低值区主要为江苏以南大部。相比于前人研究,本文证实了AERONET AOD站点数据少、融合的数据源(卫星AOD产品)过境时间不一致的情况下,UK方法仍然有效。本文提出的融合系统,可为相关研究提供空间覆盖更全、精度更高的AOD数据。
李龙 , 施润和 , 张璐 , 张颉 , 周聪 , 徐彦平 , 高炜 . 华东地区MODIS与OMI气溶胶光学厚度数据融合[J]. 地球信息科学学报, 2015 , 17(10) : 1224 -1233 . DOI: 10.3724/SP.J.1047.2015.01224
Aerosol optical thickness (AOD) can represent the attenuation of solar radiation caused by aerosol, and reflect the atmospheric turbidity or air quality conditions as one of the most important parameters. It is an excellent data source for atmosphere and air quality studies as the atomosphere environment is deteriorating in recent years. Nowadays, there are many kinds of AOD satellite products with good spatial coverage which can be employed to atmospheric environmental researches and the related studies. However, the accuracy and certainty of these satellite products can not meet the increasing demands. Fortunately, the AOD retrieved from AErosol RObotic NETwork (AERONET) exhibits better quality, although their spatial representativeness are localized. With the help of quadratic polynomial interpolation and regression analysis methods, we employed the universal kriging method to integrate both types of AOD products (satellite AOD and AERONET AOD) for analyzing Eastern China in November 2008. Results showed that the quadratic polynomial interpolation method is much better than Angstrom on band interpolation in this study. The comparison between AERONET AOD products and satellite AOD products showed that the fused results (integrated with AOD products) retrieved from universal kriging data fusion method presented a better spatial resolution, wider coverage and higher accuracy. For East China, AOD values in the northern part are higher than the southern part in November 2008; for Yangtze River Delta region, the northeastern of Anhui and the eastern part of Shanxi hold higher AOD values, while the AOD values in southern part of Jiangsu are lower. In addition, this paper has confirmed that the universal kriging data fusion method can provide good fused AOD products in the cases that AERONET AOD data is inadequate and the transit time of different sensors is asynchronous. The AOD data fusion system proposed in this paper can provide better AOD products for relevant scientific researches.
Key words: universal kriging; AOD; data fusion; East China
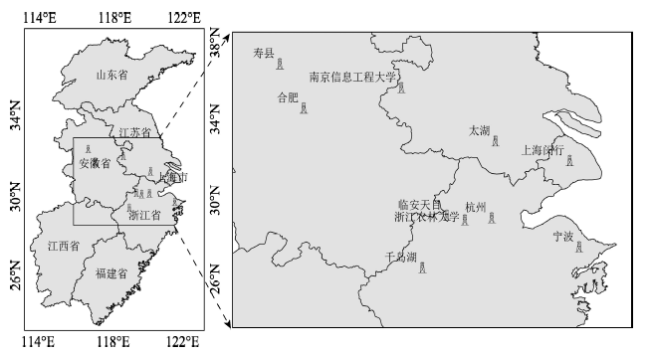
Fig. 1 Research region and distribution of AERONET sites图1 研究区域与AERONET站点分布 |
Tab. 1 Parameters of Aqua and Aura表1 Aqua和Aura卫星参数 |
| 卫星参数 | Aqua(MODIS) | Aura(OMI) |
|---|---|---|
| 发射时间 | 2002-05-04 | 2004-07-15 |
| 轨道类型 | 太阳同步 | 太阳同步 |
| 轨道高度(km) | 705 | 705 |
| 轨道周期(min) | 98.8 | 98.8 |
| 过境时间 | L.T 13:30 | L.T 13:45 |
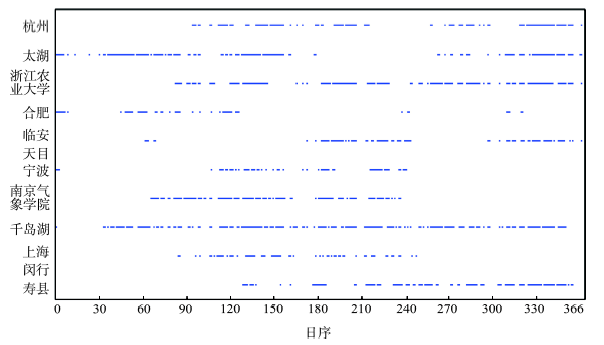
Fig.2 The temporal characteristics of AERONET AOD in East China, 2008图2 2008年华东地区AERONET站点AOD时间分布情况 |
Tab. 2 Comparison between quadratic polynomial method and Angstrom wavelength exponent method表2 二次多项式法和Angstrom波长指数法AOD波段插值结果比较(波长单位:nm) |
| 传感器 | 二次多项式法 | Angstrom波长指数法 | |||||
|---|---|---|---|---|---|---|---|
| 插值波长 | 结果波长 | MAE | 插值波长 | 结果波长 | MAE | ||
| OMI | 342.5, 388, 442 | 483.5 | 0.001 | 342.5, 388 | 483.5 | 0.019 | |
| 342.5, 442, 483.5 | 388 | 0.001 | 342.5, 483.5 | 388 | 0.009 | ||
| AERONET | 440, 500, 675 | 870 | 0.010 | 440, 675 | 870 | 0.017 | |
| 440, 500, 870 | 675 | 0.007 | 440, 870 | 675 | 0.014 | ||
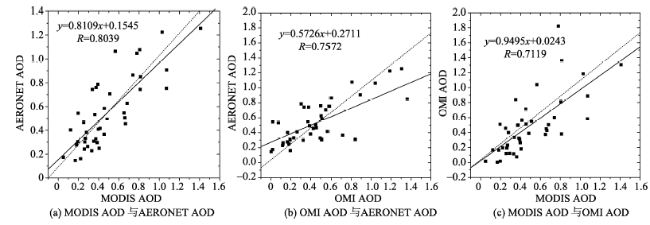
Fig.3 Correlations between different AOD products图3 不同传感器AOD数据之间的相关性 |
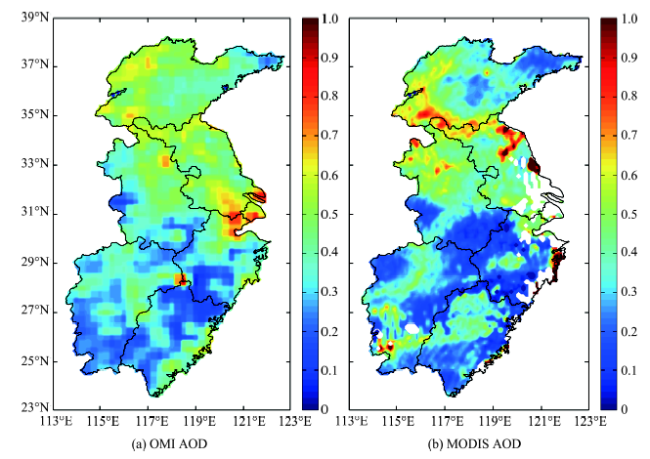
Fig. 4 Distributions of mean AOD in November 2008图4 2008年11月AOD平均分布情况 |
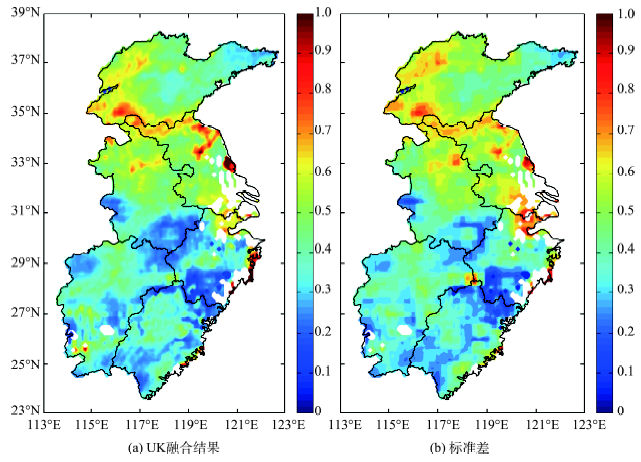
Fig. 5 UK fusion result and its uncertainy图5 UK融合结果及其不确定性 |
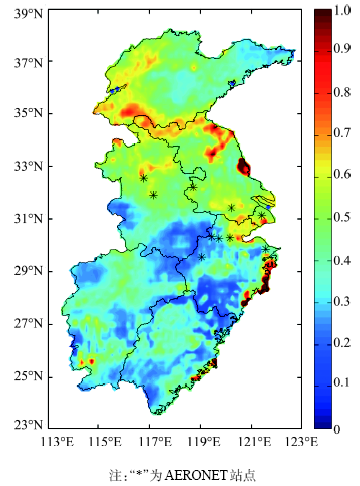
Fig. 6 Final fusion results图6 线性回归分析后的融合结果 |
Tab.3 Monthly averages of AOD source data, UK fusion results and their differences at each AERONET site表3 AERONET站点处AOD数据源月均值、UK融合结果月均值及相应的月均值差 |
| 站点 | MODIS | OMI | UK | AERONET | MODIS-AERONET | OMI-AERONET | UK-AERONET |
|---|---|---|---|---|---|---|---|
| 合肥 | 0.590 | 0.688 | 0.493 | 0.536 | 0.054 | 0.152 | -0.043 |
| 寿县 | 0.435 | 0.366 | 0.534 | 0.504 | -0.069 | -0.138 | 0.030 |
| 太湖 | 0.453 | 0.487 | 0.474 | 0.467 | -0.014 | 0.020 | 0.010 |
The authors have declared that no competing interests exist.
| [1] |
|
| [2] |
|
| [3] |
|
| [4] |
|
| [5] |
|
| [6] |
|
| [7] |
|
| [8] |
|
| [9] |
|
| [10] |
|
| [11] |
|
| [12] |
|
| [13] |
|
| [14] |
|
| [15] |
|
| [16] |
|
| [17] |
|
| [18] |
|
| [19] |
|
| [20] |
|
| [21] |
|
| [22] |
|
| [23] |
|
| [24] |
|
| [25] |
|
| [26] |
|
| [27] |
|
| [28] |
|
| [29] |
|
| [30] |
|
| [31] |
|
| [32] |
|
| [33] |
|
| [34] |
|
/
| 〈 |
|
〉 |