
基于密度的轨迹时空聚类分析
作者简介:吴笛(1990-),女,硕士生,研究方向为时空数据挖掘。E-mail: wudi@lreis.ac.cn
收稿日期: 2015-04-29
要求修回日期: 2015-05-27
网络出版日期: 2015-10-10
基金资助
国家自然科学基金项目“基于海洋要素场的涡旋过程数据建模与可视化”(41371378)
Density-Based Spatiotemporal Clustering Analysis of Trajectories
Received date: 2015-04-29
Request revised date: 2015-05-27
Online published: 2015-10-10
Copyright
通过轨迹聚类分析挖掘物体移动模式的空间分布和时间特征,对于认识运动的形成机制,预测运动的未来发展具有重要的意义。目前,轨迹聚类研究主要关注物体的空间位置变化,时空聚类中时间约束一般只是作为辅助信息,并不真正参与聚类。本文提出基于密度的轨迹时空聚类方法,在聚类过程中同时考虑轨迹包含的时空信息,在空间聚类的基础上提出了轨迹线段时间距离的度量方法和阈值确定原则,对时空邻域密度进行聚类分析,挖掘物体的时空移动模式。实验对南海涡旋轨迹进行时空聚类分析,得到了涡旋典型移动模式的空间分布和时间特征,验证了基于密度的轨迹时空聚类方法的有效性。加入时间约束后,移动通道主要发生缩短、分裂和消失的变化。和空间聚类相比,轨迹时空聚类可有效地划分发生在同一位置不同时间的轨迹,得到的聚类结果更加细化,移动模式更加准确,有利于物体的移动模式做更深入的分析。
吴笛 , 杜云艳 , 易嘉伟 , 魏海涛 , 莫洋 . 基于密度的轨迹时空聚类分析[J]. 地球信息科学学报, 2015 , 17(10) : 1162 -1171 . DOI: 10.3724/SP.J.1047.2015.01162
Trajectory clustering, which aims to uncover the meaningful spatial distributions and temporal variations of moving objects, is of much importance in understanding potential dynamic mechanisms and predicting future development. However, placing many focuses on locational changes, many studies have made limited use of the time dimension in trajectories. This paper presents a density-based clustering method, which integrates time and space information in identifying significant migrating paths from trajectory datasets. Definition of temporal distances between any line segments decomposed from trajectories as well as the criterion of distance threshold selection is provided in detail. The experiments conducted on ocean eddies in the South China Sea demonstrate the effectiveness of this method in obtaining spatiotemporal migrating patterns. The migrating paths in the results are shortened, or separated into parts, or they turn insignificant as the effect of including time component in density clustering, which reveal more specific movement characteristics in the temporal domain covered by spatial clustering. This advantage facilitates the analysis of objects moving along the same path while displaying distinct time patterns.
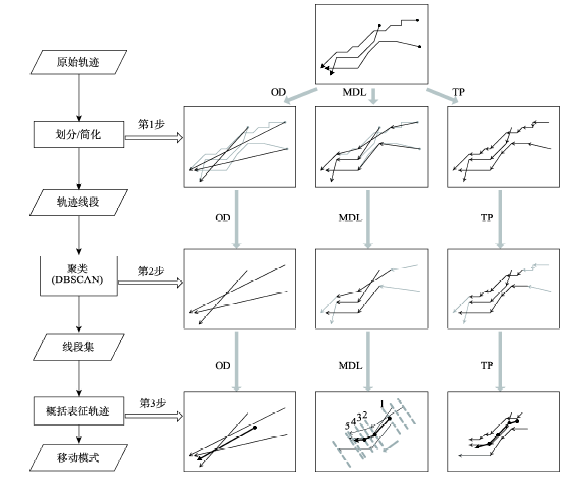
Fig. 1 A flowchart showing the process of trajectory spatial clustering图1 轨迹空间聚类流程图 |
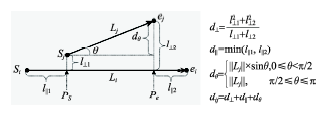
Fig. 2 Spatial distance between line segments图2 线段空间距离度量 |
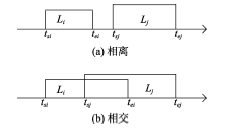
Fig. 3 Temporal distance between line segments图3 时间距离度量 |
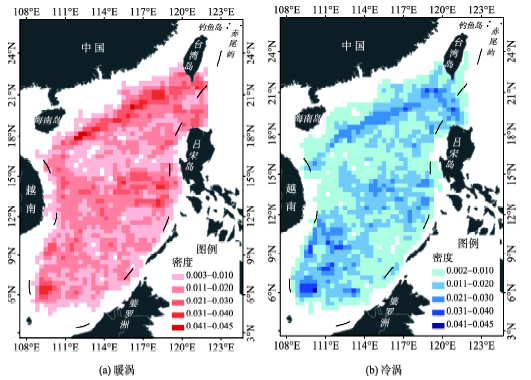
Fig. 4 Trajectory density of eddies in the South China Sea图4 南海涡旋轨迹密度分布 |
Tab. 1 Number of trajectories and clustering parameters表1 轨迹聚类数目和聚类参数 |
| MDL-AE | MDL-CE | OD-AE | OD-CE | TP-AE | TP-CE | |
|---|---|---|---|---|---|---|
| 轨迹数目 | 398 | 418 | 398 | 418 | 1077 | 1185 |
| εs | 74 | 79 | 124 | 124 | 79 | 77 |
| MinLns | 6 | 6 | 5 | 5 | 7 | 7 |
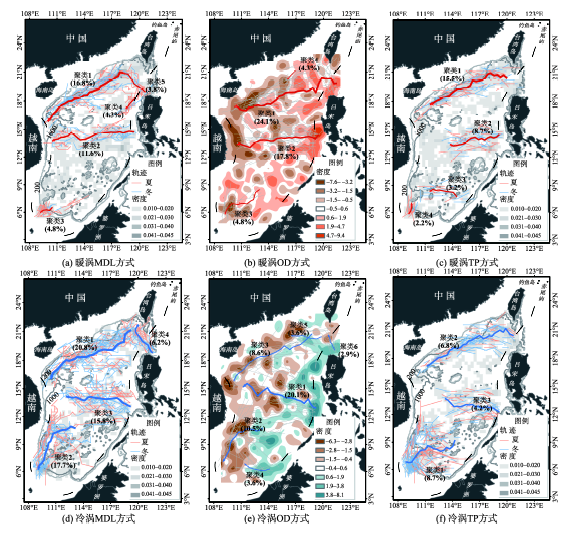
Fig. 5 Spatial clustering results of eddies’ trajectories in the South China Sea图5 南海涡旋轨迹空间聚类结果 |
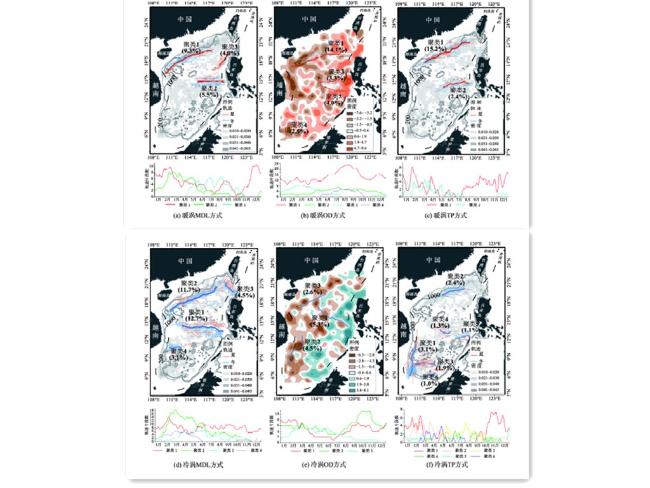
Fig. 6 Spatiotemporal clustering results of eddies’ trajectories in the South China Sea图6 南海涡旋轨迹时空聚类结果 |
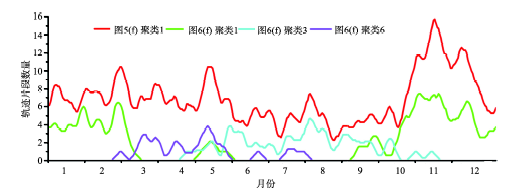
Fig. 7 Time distribution of movement patterns from clustering cold eddies trajectory partitions in the southern South China Sea comparing between the spatial and spatiotemporal results图7 南海南部冷涡TP方式的空间移动模式与时间移动模式时间分布对比 |
The authors have declared that no competing interests exist.
| [1] |
|
| [2] |
|
| [3] |
|
| [4] |
|
| [5] |
|
| [6] |
|
| [7] |
|
| [8] |
|
| [9] |
|
| [10] |
|
| [11] |
|
| [12] |
|
| [13] |
|
| [14] |
|
| [15] |
|
| [16] |
|
| [17] |
|
| [18] |
|
| [19] |
|
| [20] |
|
| [21] |
|
| [22] |
|
| [23] |
|
/
| 〈 |
|
〉 |