全球卫星气候遥感数据

卫星气候数据集的应用研究与发展分析

  • 唐世浩 , 1, * ,
  • 刘荣高 2
展开
  • 1. 中国气象局 中国遥感卫星辐射测量和定标重点开放实验室 国家卫星气象中心,北京 100081
  • 2. 中国科学院地理科学与资源研究所,北京 100101

作者简介:唐世浩(1971-),男,研究员,博士,研究方向为定量遥感产品反演与应用。E-mail:

收稿日期: 2015-04-23

  要求修回日期: 2015-05-26

  网络出版日期: 2015-11-10

基金资助

气象行业科研专项(GYHY201106014、GYHY201406001)

Research Progress of Satellite-based Climate Dataset

  • TANG Shihao , 1, * ,
  • LIU Ronggao 2
Expand
  • 1. Key Laboratory of Radiometric Calibration and Validation for Environmental Satellites, National Satellite Meteorological Center, CMA, Beijing 100081, China
  • 2. Institute of Geographic Sciences and Natural Resources Research, CAS, Beijing 100101, China
*Corresponding author: TANG Shihao, E-mail:

Received date: 2015-04-23

  Request revised date: 2015-05-26

  Online published: 2015-11-10

Copyright

《地球信息科学学报》编辑部 所有

摘要

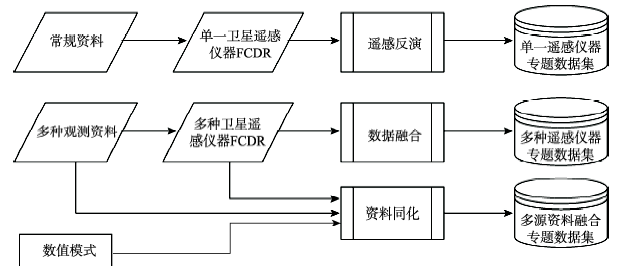
卫星气候数据集是卫星气候研究的基础。在规范卫星气候数据集基本概念的基础上,针对现有基本气候数据集(FCDR)和专题气候数据集(TCDR)的分类方式,无法反映卫星气候数据特点的问题,认为应将专题气候数据集进一步划分为单一遥感仪器专题气候数据集、多种遥感仪器融合专题气候数据集及卫星与多源资料融合专题气候数据集等几类。这种分类方法便于用户更好地了解和使用卫星气候数据。然后,重点围绕基本气候变量和基本卫星气候变量含义、卫星气候数据集生产规范、国内外主要卫星气候数据生产计划等方面,综述了卫星气候数据集建设及规范化生产已取得的最新研究进展。在此基础上,分析了卫星气候数据集建设和应用中存在的主要问题,展望了卫星气候数据集发展,同时对我国卫星气候数据集建设提出具体建议。

本文引用格式

唐世浩 , 刘荣高 . 卫星气候数据集的应用研究与发展分析[J]. 地球信息科学学报, 2015 , 17(11) : 1278 -1285 . DOI: 10.3724/SP.J.1047.2015.01278

Abstract

Climate dataset is the basis of satellite-based climate research. This paper formalizes some basic concepts of satellite data from the view of climate study first. On that basis, the classification problem of Climate Data Records(CDR) is discussed. The authors proposed that current classification method, which classifies CDR into two categories, FCDR(Fundamental Climate Data Record)and TCDR(Thematic Climate Data Record), is not enough to reflect the characteristics of remote sensing dataset. It‘s necessary to further classify TCDR into three categories, including dataset generated from single instrument, dataset generated from multiple instruments, and dataset generated from multiple sources. The advantage of this classification scheme is that it’s helpful to discriminate climate datasets which have the same name but generated from different data sources or by different algorithms. In this manner, users can understand and utilize the data more easily and correctly. Then, this paper introduces Essential Climate Variables (ECV), essential satellite-based climate variables and the guideline for the generation of satellite-based climate datasets respectively, and reviews the recent progresses made by NOAA, NASA, ESA and other international remote sensing organizations. The author especially emphasized that some guidelines and principles for the generation of satellite-based climate data records have been proposed and made common senses among the majority of international remote sensing organizations, and new climate data records following international standards are being produced. Finally, the paper discusses some issues faced during the construction and application of satellite-based climate datasets, and gives some specific suggestions on the development of China's satellite-based climate datasets.

1 引言

气候变化对国家安全与可持续发展构成严重威胁,成为当今世界环境外交的热点。对气候变化趋势的认识,尚无法作出科学准确的判断,缺少有效数据源是制约全球气候变化研究的关键之一。高精度、具有时空一致性和参数协调性的长时间序列气候参数数据集,对于分析全球气候变化、驱动全球及区域气候系统模式至关重要。
卫星可为气候及气候变化预测提供基本观测依据,其在气候变率和气候变化研究中发挥越来越重要的作用。卫星气候数据集是卫星气候研究的基础,但早期的气象卫星资料主要用于定性分析,定量精度不高,难以满足气候系统科学与应用研究的需要。近年来,随着卫星资料时间序列的延长和定量精度的提高,卫星气候数据集的建设和应用越来越受到重视,其在全球和区域性气候的监测、诊断和气候变化分析中,取得了很好的效果[1-2]。地球观测卫星委员会(CEOS)、国际气象卫星协调委员会(CGMS)等国际组织都将卫星气候研究作为未来几年的优先发展计划。全球气候观测系统(GCOS)与世界气象组织(WMO)、CEOS等先后提出一系列卫星气候观测和数据集生产指导原则[3-5]。这些指导原则被NOAA、NASA、ESA等空间机构广泛采用,对卫星气候观测和卫星气候数据集生产起到了规范和促进作用,推动了卫星气候研究的发展。

2 卫星气候数据集分类

从气候分 析应用的角度,卫星数据可分为环境数据集EDR(Environmental Data Records)、临时气候数据集ICDR(Interim Climate Data Records)和气候数据集CDR(Climate Data Records)。EDR主要用于短期环境监测,ICDR用于业务气候监测与服务,CDR用于长期气候变率与气候变化分析。美国国家科学研究委员会NRC(National Research Council),将卫星气候数据集(CDR)定义为具有足够时间长度、一致性和连续性,可用于确定气候变率和气候变化的长时间序列数据[6]。卫星气候数据集具有长周期、经过检验、文档完整等基本特征。
卫星气候数据集分为基本气候数据集(FCDR)和专题气候数据集(TCDR)。基本气候数据集(FCDR)是指经定标、定位处理的卫星观测数据集,可用于生成具有一定精度和稳定性,支持气候应用研究的定量遥感产品[6]。FCDR一般包括校正后的辐亮度,主动遥感仪器的后向散射,无线掩星探测的弯曲角等。该术语(FCDR)被GCOS采用,可认为是一个国际通用定义。专题气候数据集(TCDR)是在基本气候数据集(FCDR)基础上,生成的地球物理变量数据集。TCDR被许多空间机构采用,可认为是一个事实标准。
专题气候数据集按照其数据源和生成方法的不同,可进一步细分为单一遥感仪器专题气候数据集、多种遥感仪器融合的专题气候数据集、卫星与多源资料融合形成的专题气候数据集(图1)。单一遥感仪器专题气候数据集是在长时间序列单一遥感仪器观测数据基础上生成的气候数据集,例如,以NOAA/AVHRR数据为基础建立的NDVI数据集、以MODIS仪器数据为基础生成的系列遥感产品数据集等[7-9],其受仪器本身影响小,时间序列一致性好,但也存在单一遥感仪器探测能力有限、空间覆盖不足或时间序列短等问题。
Fig. 1 Classification of Thematic Climate Data Records

图1 专题气候数据集(TCDR)分类

多种遥感仪器融合的专题气候数据集,是以多种遥感仪器观测资料为基础生成的数据集,其包含多种遥感仪器的时间融合和空间融合(如ISCCP数据集等)。多种遥感仪器融合可综合利用不同仪器的优势,不仅有助于提高探测能力和产品反演精度,而且还可提高数据集的空间覆盖范围和时间序列长度。但由于不同遥感仪器的探测精度、时空覆盖范围不同,若处理不当,可能对长时间序列气候资料的稳定性产生影响。
卫星与多源资料融合形成的专题气候数据集,是将卫星遥感资料与其他各种观测资料(包括地基与空基观测资料等)、数值模式产品相结合,以数据融合和资料同化等技术为基础生成的数据集。多种资料融合生成的气候数据集具有时空连续、时间序列一致性好等特点。但这种方法要以FCDR或其他专题数据集为基础,而且受数据融合方法、数值模式精度和同化技术等影响较大。欧洲中期数值预报中心(ECMWF)全球再分析资料(简称ERA)和美国国家环境预测中心/美国国家大气研究中心(NCEP/NCAR)全球再分析资料(NRA),结合地面、探空、卫星等观测资料,并经过了模式的同化,可提供时空连续的大气、地表参数分析资料,为研究天气尺度和中尺度系统变化过程提供了良好的条件,并能为中尺度数值模式及区域气候模式提供初始场和边界条件,对于区域及全球的气候变化研究具有十分重要的作用[10-13]

3 基本卫星气候变量

气候变量是气候和气候变化研究的基础。从满足联和国气候变化框架公约(UNFCCC,简称“公约”)和政府间气候变化专门委员会(IPCC)需求的重要程度、全球系统观测的可行性等角度出发,GCOS在大气、陆地、海洋3个领域分别选定了一些重要气候变量,共同构成一套基本气候变量(ECV)[14]。ECV是与气候变化及其对全球影响有关的地球物理变量。这些基本气候变量的连续观测和国际交换对于气候系统监测和研究具有重要意义。表1为GCOS确定的可在全球范围测量并与“公约”高度相关的基本气候变量。
Tab. 1 Essential Climate Variables that are both currently feasible for global implementation and have a high impact on UNFCCC requirements[14]

表1 可在全球范围测量并与“公约”高度相关的基本气候变量[14]

界域 基本气候变量
大气 表面:气温、风向风速、水汽、气压、降水、表面辐射平衡
高层大气:气温、风向风速、水汽、云特性、地球辐射平衡(包括太阳辐照度)
大气成分:二氧化碳、甲烷和其他长寿命温室气体、臭氧和气溶胶
海洋 表面:海表温度、海表盐度、海平面、海况、海冰、洋流、海色、二氧化碳分压、海洋酸度、浮游植物
亚表面:温度、盐度、洋流、营养物、二氧化碳分压、海洋酸度、氧气、示踪物
陆地 流量;用水、地下水、湖、雪盖、冰川和冰帽、冰盖、永久冻土、反照率、土地覆盖(包括植被类型)、光合有效辐射吸收系数(FAPAR)、叶面积指数、地上生物量、土壤碳、火点扰动、土壤湿度
为满足联和国气候变化框架公约对全球气候观测系统的需求,2004年GCOS发布了“支持UNFCCC的全球气候观测系统执行计划”。在全球气候观测系统执行计划中,GCOS明确指出,卫星遥感是从全球尺度获得气候系统观测的重要方式,在全球气候系统评估中具有重要作用。鉴于卫星遥感在气候观测系统中的重要性,2006年GCOS专门提出“卫星气候系统观测需求”[4],对全球气候观测系统执行计划中卫星观测部分的细节进行补充说明,而后又以2010年修订的执行计划(IP-10)为基础[15],对“卫星气候系统观测需求”进行了修订[5]。根据专家意见和观测的可行性,列出卫星遥感能发挥重要作用的ECV变量子集(表2)。这个ECV子集反映了需要卫星遥感监测的最重要的气候变量。
Tab. 2 ECVs for which satellite observations make a significant contribution[5]

表2 卫星观测有重要贡献的基本气候变量[5]

界域 基本气候变量
大气 表面风向风速、降水、高层气温、高层风向风速、水汽、云特性、地球辐射平衡(包括太阳辐照度)、二氧化碳、甲烷和其他长寿命温室气体、臭氧和气溶胶特性
海洋 海表温度、海表盐度、海平面、海况、海冰、海色
陆地 湖、雪盖、冰川和冰帽、冰盖、反照率、土地覆盖(包括植被类型)、光合有效辐射吸收系数(FAPAR)、叶面积指数、地上生物量、火点扰动、土壤湿度
需指出的是,GCOS定义的基本气候变量并不是一成不变的,在调研和论证的基础上,GCOS会定期对基本气候变量进行微调。

4 卫星气候数据集的生产规范

要使卫星观测能有效用于长期气候研究,必须确保卫星资料的稳定性、精确性和均一性。为了对全球气候观测进行有效组织,GCOS制定了全球气候观测系统气候监测原则(GCMPs)[14]。考虑卫星观测的重要性和特殊性,GCMPs中特别对卫星遥感观测作出了规定。这些规定重点解决卫星特有的业务运行问题,包括:观测的连续性、均一性,轨道控制,定标和仪器特性,采样策略,产品生产、数据分析和数据存档的持续性等问题。
在GCOS-154中,GCOS又对一部分现阶段卫星遥感可发挥较大作用的ECV变量,提出具体需求,进一步明确了这些卫星气候产品的时空分辨率、精度和稳定性等[5]。卫星气候产品系统观测需求,还包含对FCDR、相关卫星仪器、非FCDR数据需求等方面的指导,所以其本身就是卫星气候数据集生产指南。
在气候监测原则(GCMPs)和卫星气候产品系统观测需求基础上,为了保证FCDR和ECV产品生产过程中的文档完整性、透明性和科学管理,GCOS指导委员会建议数据生产者在生产和提供卫星气候数据集时满足一定的要求(表3[16]
Tab. 3 The GCOS Steering Committee recommends particular attention to the needs related to the generation of ECV satellite datasets and products

表3 卫星气候数据集要求

序号 要 求
1 提供数据集和产品生产过程的完整描述,包括采用的算法,使用的基本气候数据集(FCDR),验证情况等
2 提供与数据集描述和数据集应用有关的出版物信息
3 提供产品精度、稳定性和时空分辨率的描述。最好能提供与GCOS中所提卫星产品需求的对比
4 提供数据集、产品及所有文档的获取途径
5 加强数据集和产品的版本管理,特别是与算法改进和资料再处理关联
6 保持产品的长期稳定性和均一性
7 采用一切有助于提高产品质量的校验方法
8 尽可能做到全球覆盖
9 将数据定期释放给用户使用,以便开展遥感监测
10 提供用户反馈机制
11 进行成熟度指数分析
12 发布一个总结文档(最好在线),逐项说明与本指南的复合程度
GCOS提出的卫星气候监测原则、卫星气候产品需求、卫星气候数据生产要求等,可用于指导生产满足气候监测和长期气候研究的卫星产品。空间机构可根据这些指导意见处理和分析卫星观测数据,生产ECV产品。上述卫星气候监测原则和标准已被许多国际组织和机构所采用,在相关机构推出的卫星发射计划和数据产品中,都对GCOS的需求作出了响应。

5 卫星气候数据集的应用建设与发展

GCOS提出的卫星气候观测和产品需求,主要由CEOS、CGMS等国际上与卫星遥感有关的机构和组织及其成员负责落实。根据CEOS的调查统计,目前,世界上主要的卫星气候数据集生产、评估机构是NASA、NOAA、欧洲气象卫星应用组织(Eumetsat)和欧空局(ESA)等。
美国在地球观测卫星方面投入巨大,积累了世界上最长的卫星观测数据。为了增强卫星资料的业务再处理能力,美国NOAA发起了一项卫星气候数据集(CDR)计划,计划采用最成熟、最科学的方法将存档的历史卫星资料处理成长期、一致的气候记录,用于气候变化和变率研究。CDR计划于2007年提出,2009年开始实施。CDR采用规范的方法对卫星气候数据集进行生产和质量评估。整个卫星数据集生产分为3个阶段:研究阶段、初步业务能力阶段、完全业务能力阶段。卫星数据集从研究阶段转到初步业务阶段需要经过评估、阶段转移准备、阶段转移、校验、归档、共享等步骤。具有初步业务能力的数据集可给用户分发使用,但不能进行业务维护和动态更新,只有达到完全业务能力的卫星气候数据集才能连续、不间断生产[6]
CDR计划已完成多个数据集的生产,这些数据集被发布到NCDC网页上。NCDC网页上发布的数据集分为基础气候数据集(FCDR)和专题气候数据集(TCDR)。基础气候数据集是经改进和时间序列质量控制的观测数据(如定标后的辐亮度、亮温等)及定标辅助数据。专题数据是从FCDR提取的地球物理变量,如海表温度、海冰覆盖等。TCDR生产过程中经常融合多种卫星观测资料、地基观测资料、模式输出资料等。
目前,NCDC CDR发布的数据集包括AMSU亮温、AVHRR反射率、静止卫星红外通道亮温、HIRS通道亮温、MSU亮温、SSMI(S)亮温等基本气候数据集,AVHRR地表反射率、NDVI、雪盖等陆地气候数据集,海冰、海表温度等海洋气候数据集,气溶胶光学厚度、云参数、大气温度、降水等大气气候数据集,这些数据集将逐年增加。
美国地质调查局(USGS)主要负责陆地资源(Landsat)卫星数据的整编工作(已整编了长达37年的陆地资源系列卫星地表观测资料,覆盖了全球大部分地区)。陆地资源系列卫星对长期气候数据记录尤为重要,因为其空间分辨率高,能区分土地覆盖的自然和人为影响。USGS已开发了TM和ETM传感器的一致性辐射定标方法,并且完成相关定标工作,目前正在制定从Landsat存档数据中获取FCDR和ECV的计划。根据GCOS指南要求,USGS组织专家从算法成熟度、USGS现有能力和用户需求等方面,确定能从Landsat数据获取的地表ECV变量。已确定的ECV变量包括土地覆盖、反照率、火点扰动、地表水、雪和冰及叶面积指数。地表反射率和地表温度被确定为FCDR。NASA的科研卫星,特别是EOS卫星,为地球气候系统提供了非常重要的观测。通过其科学团队和Pathfinder 数据集计划,NASA继续从卫星观测资料中生产长期气候数据集,并且定期对这些数据集进行重新处理。
为了响应GCOS需求,同时充分开发利用欧洲地球观测数据,ESA推出CCI计划,旨在系统生产、保存和分发,以满足UNFCCC各方需求的ECV长期数据集。2008年ESA成员国批准了CCI计划,2009年开始首批11个遥感ECV数据集建设。这11个ECV变量包括4个大气变量(臭氧、云、气溶胶、温室气体(CO2、CH4))、4个海洋变量(海平面高度、海表温度、海冰和海洋水色)、3个地表变量(土地覆盖、冰川和火点扰动)。CCI计划主要是基于欧洲已有的工作基础,特别是存档的长期地球观测数据,紧密围绕ECV生产所必需的步骤开展一系列行动,包括长期数据维护、再定标、定期重处理、算法开发、产品生产和验证、气候数据集质量评价等。CCI计划的目标是建成能满足气候监测和分析需求的卫星遥感ECV数据集,同时提供持续稳定的数据获取途径[17]。目前CCI第一阶段计划已经基本完成。
欧洲气象卫星组织EUMETSAT,很早便认识到卫星气候监测的重要性,为此在其卫星应用示范(SAF)网络中,专门设立卫星气候监测应用示范(CM SAF)。从1999年开始,EUMETSAT CM SAF便开始进行卫星气候数据集的生产和分发。CM SAF重点关注与全球能量和水循环有关的ECV变量,其生产的卫星气候数据集产品包括大气温湿廓线、云参数、大气和地表辐射参数等[18]
近年来,中国也开始重视卫星气候数据集生产和相关能力建设工作,如在科技部“863计划”、“973计划”、中国气象局行业专项等计划项目支持下,中国科学院地理科学与资源研究所、北京师范大学、国家卫星气象中心等单位先后单独或联合研发了土地覆盖、叶面积指数、地表短波反照率、宽波段发射率、下行短波辐射、下行光合有效辐射、积雪等长时间序列、高质量、高精度的卫星气候数据集(如GLASS(全球陆表卫星数据集),CG-LTDR(全球及中国区域长时间序列卫星数据集)等)。这些数据集生产标准逐步与国际接轨,数据质量也不断提高[19]
卫星气候数据集对于气候模式验证、气候过程理解和气候趋势分析预测等都有很大价值。近年来,在空间观测领域,长期气候观测记录的数量和种类都迅速增加,卫星气候数据集的定量评估越来越重要,但目前卫星气候数据集评估还缺少统一标准[20-23]。为了有效反映数据集的优缺点,促进全球气候数据集生产者和使用者的有效沟通,Bates等于2006年首次提出一个成熟度指数,用于NOAA CDR数据集评估,而后又根据用户反馈和2011年卫星气候数据集评估会的建议进行了修改[24]。修改后版本(成熟度矩阵V4版)从软件成熟度、元数据、文档、产品检验、数据分发、数据应用等几方面分别定义了成熟度水平。1、2级成熟度水平代表数据集主要用于科研目的,3、4级代表数据集达到中等成熟度水平,有较好的科学性和应用价值,可暂时用于持续应用。5、6级为高成熟度水平,代表数据集生产能力达到业务和服务水平标准。表4为成熟度矩阵,其中的每一项、每一个等级都有具体指标对应,如产品检验等级通过独立验证、不确定性、质量标记、业务监测等指标确定。产品检验程度为1级,意味着独立验证不完整、很少或没有误差和偏差信息、没有质量标记、业务监测不完整。
Tab. 4 Climate Data Record (CDR) V4.0 maturity matrix[24]

表4 CDR 4.0版成熟度矩阵模型[24]

成熟度 软件成熟度 元数据 文档 产品检验 数据共享 数据应用
1 概念发展 很少或没有 算法文档草稿;算法论文提交 很少或没有 限于选定的少数人 很少或没有
2 还要进行较大的修改 研究级 第一版算法文档C-ATBD;复审的算法文章 最低程度 向专业人员提供有限的数据 有限或正在进行中
3 还要进行中等程度修改 研究级,符合国际标准 公开的算法文档;经同行评议发表的算法论文 在选定的区域/时间进行了不确定性评估 数据和源代码存档并可以获取;使用需要注意 应用评估为正效果
4 需要进行一些修改 有元数据;稳定;允许数据集来源追踪和重现;符合国际标准 公开的算法文档;业务算法描述草稿;同行评审的算法出版物;关于产品的论文提交 多个研究者在广泛分布的地区和时间进行了不确定估计;对差异有所了解 数据和源代码存档并可公开获取;提供不确定估计;存在的问题公开 可在实际应用中使用;应用评估为正效果
5 需要进行最小的修改;稳定、便携、可重复 元数据完整;稳定;允许数据集来源追踪和重现;符合国际标准 公开的算法文档;业务算法描述修改版;关于算法和产品的经同行评审的出版物 不同研究者在大多数环境条件下获得一致的不确定性评估结果 数据和不确定性估计存档并可公开获取;存在的问题公开;定期更新 可被其他研究者使用;应用评估为正效果
6 不需要代码修改;稳定、可重复;便携、高效 元数据完整、动态更新;稳定;允许数据集来源追踪和重现;符合国际标准 公开的算法文档和业务算法描述文档;多个关于算法和产品的经同行评审的出版物 设计观测策略,通过独立交叉检验、开放检查和连续调查揭示系统误差;误差定量化 可公开获取长期存档数据;常规更新 在公开发表的应用中使用;可被行业应用;应用评估为正效果
目前,成熟度矩阵仍在根据实际使用情况和用户反馈意见进行改进。SCOPE-CM和ESA CCI计划也考虑直接采用成熟度矩阵或以成熟度矩阵为模板进行修订后,用于所生产卫星气候数据集的评估。

6 结论与讨论

气候和气候变化研究是当今世界的热点和难点问题。卫星观测数据在气候变化研究中发挥越来越重要的作用。但卫星气候数据集还存在时间序列短、资料的精度有待提高、数据生产缺少统一规范和标准等诸多问题。
近年来,WMO、GCOS、CEOS等国际组织先后制定了多个卫星气候研究计划,并对卫星气候观测、卫星气候数据集生产、质量评估、分发服务等进行了规范。CEOS、CGMS等国际组织将卫星气候研究作为未来几年的优先发展计划,NOAA、NASA、ESA、日本航空航天局(JAXA)、Eumetsat等国际著名机构也纷纷制定自己的卫星气候研究和卫星气候数据集生产计划。经过多年的努力,卫星气候数据集生产已经逐步向业务化、规范化方向发展,卫星遥感在气候和气候变化研究中发挥越来越重要的作用。
中国已先后发射十余颗气象卫星,积累了较长时间序列的卫星遥感数据,未来还将持续发射多颗气象卫星,但在全球卫星气候数据集建设方面尚处于起步阶段。目前,卫星遥感资料在中国气候和气候变化业务中应用还相对较少,中国气候业务中应用的卫星遥感资料在时空分辨率、区域适用性、时效性、参数协调性方面都存在一定的不足。因此,建立自主研发的长时间序列、高时空分辨率和较高精度的卫星气候数据集,为气候系统科学和全球变化研究提供数据支撑,提升中国对地观测的科研能力和遥感应用研究水平,势在必行。
(1)增强卫星气候监测能力。GCOS、CEOS等国际计划或组织,在广泛调研的基础上,初步确定了基本气候变量及其监测需求。欧美等国家在卫星总体规划设计、星上传感器设计中,已开始将ECV变量的探测需求纳入发展规划。中国在未来卫星发展规划中,也应充分考虑气候研究对ECV变量的需求,增强ECV变量探测能力和持续观测能力。
(2)提高卫星观测数据和产品质量。近年来,卫星观测数据质量显著提高,可见近红外反射通道定标精度可达3%,红外通道定标精度可控制在0.5 K以内。美国、欧洲正在发展CLARREO、TRUTHS等高精度在轨定标计划,届时可见近红外反射通道定标精度预计可达0.3%,热红外通道定标精度可达0.1 K,比现在分别提高5-10倍和3-5倍,能基本满足气候变化研究的需要。中国目前在轨气象卫星的定标精度与以前相比有很大提高,但仍需进一步加强定标、定位等关键技术研究,提高卫星观测数据和产品质量,以满足气候研究的需要。
(3)加强卫星气候数据集处理技术研究。卫星气候数据处理是一个螺旋上升的过程,只有不断利用最新技术对历史卫星资料进行再处理,才能使卫星气候数据集质量得到持续改善,直至完全满足气候变化研究需求。NOAA、ESA等正在通过CDR、CCI等计划尝试建立卫星气候数据集研发、业务生产机制,并已取得初步成效。中国目前尚未形成合理的卫星气候数据集研发和业务转化机制。
(4)广泛开展国际交流合作,加强卫星气候数据共享能力建设。近年来,GCOS尝试对卫星气候数据集的生产进行规范,先后出台了一系列与卫星气候数据集生产有关的指导文件。中国应在WMO、GCOS、CEOS、CGMS等国际组织或计划的统一指导下,广泛开展国内外、部门内外交流合作,按国际统一标准建设卫星气候数据集,同时加强卫星气候数据共享能力建设,使相关领域的建设与应用研究得以快速地发展。

The authors have declared that no competing interests exist.

[1]
Chen J, Del Genio A D, Carlson B E, et al. The spatiotemporal structure of long term climate variations in the 20th century based on observed and reanalysis data. Part I: The global warming trend[J]. Journal of Climate, 2008,21:2611-2633.

[2]
Knapp K R, Ansari S, Bain C L, et al.Globally gridded satellite observations for climate studies[J]. Bulletin of the American Meteorological Society, 2011,92(7):893-907.ABSTRACT Geostationary satellites have now been providing weather data for 50 years. Much of these data have been neglected by climate observation studies due to difficulties with calibration and data processing over such a long period. Collection and data ownership rights were spread out across several international agencies. The ISCCP project is overcoming these barriers and this paper has presented details on the most up-to-date and easily accessible global satellite record: GridSat. This new record provides equal-angle gridded uniform observations of brightness temperatures every 3 h from 1980 to the present for most of the globe. We have demonstrated the multiple and diverse uses of the data for climate analysis made possible by GridSat data-from predicting drought and food security in Africa to the detailed and historical tracking of hurricanes. This only touches on some of the potential uses of GridSat. Accurate records of global atmospheric fields are essential for future research on climate change as well as the understanding of the planet's meteorology. By reconstructing past satellite data and combining them with current satellite observations, a seamless data record has been obtained for the study of Earth's atmospheric state. In addition, GridSat has given a wide range of users very easy access to this new data record. Development of GridSat will continue, focusing on improving the current data files and supporting more applications.

DOI

[3]
GCOS. Guideline for the generation of datasets and products meeting GCOS requirements[R].GCOS-143, 2010.

[4]
GCOS. Systematic observation requirements for satellite-based products for climate[R]. GCOS-107 (WMO/TD-No.1338), GCOS, 2006.

[5]
GCOS. Systematic observation requirements for satellite-based products for climate (2011 Update)[R]. GCOS-154, GCOS, 2011.

[6]
NRC. Climate data records from environmental satellites: Interim report[R]. Washington, D C: The National Academies Press, 2004:136.

[7]
Fensholt R, Proud S R.Evaluation of Earth observation based global long term vegetation trends——comparing GIMMS and MODIS global NDVI time series[J]. Remote Sensing of Environment, 2012,119:131-147.A new and updated version of the AVHRR (Advanced Very High Resolution Radiometer) based GIMMS (Global Inventory Modelling and Mapping Studies) NDVI (Normalized Difference Vegetation Index) dataset is now available covering 1981 to 2010 (GIMMS3g). Earlier versions of this global coverage 15-day composite dataset have been used for numerous local to global scale vegetation time series studies during recent years. However, several aspects of the AVHRR sensor design and data processing potentially introduce substantial noise into the NDVI dataset if not corrected for. The more recent NDVI dataset from Terra MODIS (Moderate Resolution Imaging Spectroradiometer) is considered an improvement over AVHRR data and with the release of GIMMS3g an overlapping period of 11years now provides a possibility to perform a robust evaluation of the accuracy of GIMMS3g data and derived trends. In this study the accuracy is evaluated by comparison with the global Terra MODIS NDVI (MOD13C2 Collection 5) data using linear regression trend analysis. The trends of GIMMS NDVI were found to be in overall acceptable agreement with MODIS NDVI data. A significant trend in NDVI (伪=0.05) was found for 11.8% of the MODIS NDVI pixels on a global scale (5.4% characterised by positive trends and 6.3 with negative trends) whereas GIMMS NDVI analysis produced a total of 10.5% significant pixels (4.9% positive, 5.6% negative). However, larger differences were found for the Southern Hemisphere land masses (South America and Australia) and the high northern latitude Arctic regions. From a linear regression analysis the correlation coefficient between the two datasets was found to be highly significant for areas with a distinct phenological cycle. Discrepancies between the GIMMS and MODIS datasets were found in equatorial areas (broadleaved, evergreen forest), Arctic areas (sparse herbaceous or sparse shrub cover) and arid areas (herbaceous cover, closed鈥搊pen). Linear regression of QA filtered Terra and Aqua MODIS NDVI (2003鈥2010) revealed similar inconsistencies for Arctic and equatorial areas suggesting that robust long-term NDVI trend estimates in these areas are difficult to obtain from both GIMMS and MODIS data. Additionally, GIMMS based NDVI trend analysis in arid areas of limited photosynthetic activity should be interpreted with caution. The regression coefficient (slope value) (p<0.01) was found to be close to 1 for most land cover types on a global scale (global land cover class average slope=1.00) suggesting overall compatibility between MODIS and GIMMS NDVI, but with land cover class specific variations (within class and between classes).

DOI

[8]
Mears C A, Wentz F J.Construction of the Remote Sensing Systems V3.2 atmospheric temperature records from the MSU and AMSU microwave sounders[J]. Journal of Atmospheric and Oceanic Technology, 2009,26:1040-1056.ABSTRACT Measurements made by microwave sounding instruments provide a multidecadal record of atmospheric temperature change. Measurements began in late 1978 with the launch of the first M

DOI

[9]
Justice C O, Townshend J R G, Vermote E F, et al. An overview of MODIS land data processing and product status[J]. Remote Sensing of Environment, 2002,83:3-15.Data from the first Moderate Resolution Imaging Spectroradiometer (MODIS) instrument on the NASA Terra Platform are being used to provide a new generation of land data products in support of the National Aeronautics and Space Administration (NASA)'s Earth Science Enterprise, global change research and natural resource management. The MODIS products include global data sets heretofore unavailable, derived from new moderate resolution spectral bands with spatial resolutions of 250 m to 1 km. A partnership between Science Team members and the MODIS Science Data Support Team is producing data sets of unprecedented volume and number for the land research and applications. This overview paper provides a summary of the instrument performance and status, the data production system, the products, their status and availability for land studies.

DOI

[10]
Dee D P, Uppala S M, Simmons A J, et al.The ERA-Interim reanalysis: Configuration and performance of the data assimilation system[J]. Quarterly Journal of the Royal Meteorological Society, 2011,137:553-597.ABSTRACT ERA-Interim is the latest global atmospheric reanalysis produced by the European Centre for Medium-Range Weather Forecasts (ECMWF). The ERA-Interim project was conducted in part to prepare for a new atmospheric reanalysis to replace ERA-40, which will extend back to the early part of the twentieth century. This article describes the forecast model, data assimilation method, and input datasets used to produce ERA-Interim, and discusses the performance of the system. Special emphasis is placed on various difficulties encountered in the production of ERA-40, including the representation of the hydrological cycle, the quality of the stratospheric circulation, and the consistency in time of the reanalysed fields. We provide evidence for substantial improvements in each of these aspects. We also identify areas where further work is needed and describe opportunities and objectives for future reanalysis projects at ECMWF. Copyright 漏 2011 Royal Meteorological Society

DOI

[11]
Kalnay E E, Kanamitsu M, Kistl R.The NCEP/NCAR 40-year reanalysis project[J]. Bulletin of American Meteorological Society, 1996,77:437-471.

[12]
Rienecker M M, Suarez M J, Gelaro R, et al.MERRA: NASA's modern-era retrospective analysis for research and applications MERRA[J]. Journal of Climate, 2011,24(14):3624-3648.Abstract The Modern-Era Retrospective Analysis for Research and Applications (MERRA) was undertaken by NASA鈥檚 Global Modeling and Assimilation Office with two primary objectives: to place observations from NASA鈥檚 Earth Observing System satellites into a climate context and to improve upon the hydrologic cycle represented in earlier generations of reanalyses. Focusing on the satellite era, from 1979 to the present, MERRA has achieved its goals with significant improvements in precipitation and water vapor climatology. Here, a brief overview of the system and some aspects of its performance, including quality assessment diagnostics from innovation and residual statistics, is given. By comparing MERRA with other updated reanalyses [the interim version of the next ECMWF Re-Analysis (ERA-Interim) and the Climate Forecast System Reanalysis (CFSR)], advances made in this new generation of reanalyses, as well as remaining deficiencies, are identified. Although there is little difference between the new reanalyses in many aspects of climate variability, substantial differences remain in poorly constrained quantities such as precipitation and surface fluxes. These differences, due to variations both in the models and in the analysis techniques, are an important measure of the uncertainty in reanalysis products. It is also found that all reanalyses are still quite sensitive to observing system changes. Dealing with this sensitivity remains the most pressing challenge for the next generation of reanalyses. Production has now caught up to the current period and MERRA is being continued as a near-real-time climate analysis. The output is available online through the NASA Goddard Earth Sciences Data and Information Services Center (GES DISC).

DOI

[13]
Dee D, Berrisford P, Bosilovich M G, et al.The use of reanalysis data for monitoring the state of the climate[J]. Bulletin of the American Meteorological Society, 2011,92(6):S34-S35.N/A

[14]
GCOS. The Second Report on the adequacy of the global observing systems for climate in support of the UNFCCC[R]. GCOS-82, GCOS, 2003:74.

[15]
GCOS. Implementation plan for the global observing system for climate in support of the UNFCCC (2010 Update)[R]. GCOS-138 (WMO-TD/No.1523), GCOS, 2010.

[16]
GCOS. Guidelines for the generation of satellite-based datasets and products meeting GCOS Requirements[R]. GCOS-128 (WMO/TD No. 1488), GCOS Secretariat, 2009.

[17]
Hollmann R, Merchant C J, Saunders R, et al.The ESA climate change initiative: satellite data records for essential climate variables[J]. Bulletin of the American Meteorological Society, 2013,94(10):1541-1552.Observations of Earth from space have been made for over 40 years and have contributed to advances in many aspects of climate science. However, attempts to exploit this wealth of data are often hampered by a lack of homogeneity and continuity and by insufficient understanding of the products and their uncertainties. There is, therefore, a need to reassess and reprocess satellite datasets to maximize their usefulness for climate science. The European Space Agency has responded to this need by establishing the Climate Change Initiative (CCI). The CCI will create new climate data records for (currently) 13 essential climate variables (ECVs) and make these open and easily accessible to all. Each ECV project works closely with users to produce time series from the available satellite observations relevant to users' needs. A climate modeling users' group provides a climate system perspective and a forum to bring the data and modeling communities together. This paper presents the CCI program. It outlines its benefit and presents approaches and challenges for each ECV project, covering clouds, aerosols, ozone, greenhouse gases, sea surface temperature, ocean color, sea level, sea ice, land cover, fire, glaciers, soil moisture, and ice sheets. It also discusses how the CCI approach may contribute to defining and shaping future developments in Earth observation for climate science.

DOI

[18]
Schulz J, Albert P, Behr H D, et al.Operational climate monitoring from space: The EUMETSAT satellite application facility on climate monitoring (CM-SAF)[J]. Atmospheric Science Letters , 2009,9(5):1687-1709.The Satellite Application Facility on Climate Monitoring (CM-SAF) aims at the provision of satellite-derived geophysical parameter data sets suitable for climate monitoring. CM-SAF provides climatologies for Essential Climate Variables (ECV), as required by the Global Climate Observing System implementation plan in support of the UNFCCC. Several cloud parameters, surface albedo, radiation fluxes at the top of the atmosphere and at the surface as well as atmospheric temperature and humidity products form a sound basis for climate monitoring of the atmosphere. The products are categorized in monitoring data sets obtained in near real time and data sets based on carefully intercalibrated radiances. The CM-SAF products are derived from several instruments on-board operational satellites in geostationary and polar orbit, i.e., the Meteosat and NOAA satellites, respectively. The existing data sets will be continued using data from the instruments on-board the new EUMETSAT Meteorological Operational satellite (MetOP). The products have mostly been validated against several ground-based data sets both in situ and remotely sensed. The accomplished accuracy for products derived in near real time is sufficient to monitor variability on diurnal and seasonal scales. Products based on intercalibrated radiance data can also be used for climate variability analysis up to inter-annual scale. A central goal of the recently started Continuous Development and Operations Phase of the CM-SAF (2007-2012) is to further improve all CM-SAF data sets to a quality level that allows for studies of inter-annual variability.

DOI

[19]
Liang S L, Zhao X, Liu S, et al.A long-term Global Land Surface Stellite (GLASS) dataset for environmental studies[J]. International Journal of Digital Earth, 2013,6:5-33.

[20]
Beck H E, McVicar T R, Van Dijk A I, et al. Global evaluation of four AVHRRNDVI data sets: Intercomparison and assessment against Landsat imagery[J]. Remote Sensing of Environment, 2011,115(10):2547-2563.

[21]
Mears C A, Wentz F J.The effect of diurnal correction on satellite-derived lower tropospheric temperature[J]. Science, 2005,309:1548-1551.Satellite-based measurements of decadal-scale temperature change in the lower troposphere have indicated cooling relative to Earth's surface in the tropics. Such measurements need a diurnal correction to prevent drifts in the satellites' measurement time from causing spurious trends. We have derived a diurnal correction that, in the tropics, is of the opposite sign from that previously applied. When we use this correction in the calculation of lower tropospheric temperature from satellite microwave measurements, we find tropical warming consistent with that found at the surface and in our satellite-derived version of middle/upper tropospheric temperature.

DOI PMID

[22]
Dee D P, Uppala S.Variational bias correction of satellite radiance data in the ERA-Interim reanalysis[J]. Quarterly Journal of the Royal Meteorological Society, 2009,135:1830-1841.Abstract This article describes the performance of the variational bias correction system for satellite radiance data in ERA-Interim, and considers implications for the representation of climate signals in reanalysis. We briefly review the formulation of the method and its ability to automatically develop bias estimates when radiance measurements from newly available satellite sensors are first introduced in the reanalysis. We then present several results obtained from the first 19 years (1989&ndash;2007) of ERA-Interim. These include the identification of Microwave Sounding Unit (MSU) instrument calibration errors, the response of the system to the Pinatubo eruption in 1991, and the detection of a long-term drift in biases of tropospheric AMSU-A data. We find that our results support the notion that global reanalysis provides an appropriate framework for climate monitoring. Copyright 漏 2009 Royal Meteorological Society

DOI

[23]
Robertson F R, Bosilovich M G, Chen J, et al.The effect of satellite observing system changes on MERRA water and energy fluxes[J]. Journal of Climate, 2011,24:5197-5217.Like all reanalysis efforts, the Modern Era Retrospective-Analysis for Research and Applications (MERRA) must contend with an inhomogeneous observing network. Here the effects of the two most obvious observing system epoch changes, the Advanced Microwave Sounding Unit-A (AMSU-A) series in late 1998 and, to a lesser extent, the earlier advent of the Special Sensor Microwave Imager (SSM/I) in late 1987 are examined. These sensor changes affect model moisture and enthalpy increments and thus water and energy fluxes, since the latter result from model physics processes that respond sensitively to state variable forcing. Inclusion of the analysis increments in the MERRA dataset is a unique feature among reanalyses that facilitates understanding the relationships between analysis forcing and flux response. In stepwise fashion in time, the vertically integrated global-mean moisture increments change sign from drying to moistening and heating increments drop nearly 15 W m鈭2 over the 30 plus years of the assimilated products. Regression of flux quantities on an El Ni帽o-Southern Oscillation sea surface temperature (SST) index analysis reveals that this mode of climate variability dominates interannual signals and its leading expression is minimally affected by satellite observing system changes. Conversely, precipitation patterns and other fluxes influenced by SST changes associated with Pacific decadal variability (PDV) are significantly distorted. Observing system changes also induce a nonstationary component to the annual cycle signals. Principal component regression is found useful for identifying artifacts produced by changes of satellite sensors and defining appropriate adjustments. After the adjustments are applied, the spurious flux trend components are greatly diminished. Time series of the adjusted precipitation and the Global Precipitation Climatology Project (GPCP) data compare favorably on a global basis. The adjustments also provide a much better depiction of precipitation spatial trends associated with PDV-like forcing. The utility as well as associated drawbacks of this statistical adjustment and the prospects for future improvements of the methodology are discussed.

DOI

[24]
Bates J J, Privette J L.A maturity model for assessing the completeness of climate data records[J]. Eos Transactions, AGU, 2012,93(44):441-441.The demand for climate information, with long observational records spanning decades to centuries and the information's broad application for decision making across many socioeconomic sectors, requires that geophysicists adopt more rigorous processes for the sustained production of climate data records (CDRs). Such processes, methods, and standards are more typically found in the systems engineering community and have not generally been adopted in the climate science community. We propose the use of a maturity matrix for climate data records that characterizes the process of moving from a basic research product (e.g., raw data and initial product) to a sustained and routinely generated product (e.g., a quality-controlled homogenized data set). This model of increasing product and process maturity is similar to NASA's technical readiness levels for flight hardware and instrumentation and the software industry's capability maturity model. Over time, engineers who have worked on many projects developed a set of best practices that identified the processes required to optimize cost, schedule, and risk. In the NASA maturity model, they identified steps in technology readiness, denoted as the technology readiness level (TRL). TRL 1 occurs when basic research has taken the first steps toward application. TRL 9 is when a technology has been fully proven to work consistently for the intended purpose and is operational.

DOI

文章导航

/