全球卫星气候遥感数据

对流层中层与近地面大气二氧化碳浓度的比较研究

  • 周聪 , 1, 2 ,
  • 施润和 , 1, 2, 3, * ,
  • 高炜 1, 2, 3, 4
展开
  • 1. 华东师范大学地理信息科学教育部重点实验室,上海 200241
  • 2. 华东师范大学环境遥感与数据同化联合实验室,上海 200241
  • 3. 华东师范大学、美国科罗拉多州立大学中美新能源与环境联合研究院,上海 200062
  • 4. 科罗拉多州立大学生态系统科学与可持续性系,柯林斯堡 80521
*通讯作者:施润和(1979-),男,博士,副教授,硕导,主要从事定量遥感模型与验证研究。E-mail:

作者简介:周聪(1987-),女,博士生,主要从事大气遥感研究。E-mail:

收稿日期: 2015-03-16

  要求修回日期: 2015-04-30

  网络出版日期: 2015-11-10

基金资助

国家自然科学基金项目(41201358)

上海市科委重点支撑项目(13231203804)

Comparison of Carbon Dioxide in Mid-troposphere and Near-surface

  • ZHOU Cong , 1, 2 ,
  • SHI Runhe , 1, 2, 3, * ,
  • GAO Wei 1, 2, 3, 4
Expand
  • 1. Key Laboratory of Geographic Information Science, Ministry of Education, East China Normal University, Shanghai 200241, China
  • 2. Joint Laboratory for Environmental Remote Sensing and Data Assimilation, ECNU and CEODE, Shanghai 200241, China
  • 3. Joint Research Institute for New Energy and the Environment, East China Normal University and Colorado State University, Shanghai 200062, China
  • 4. Department of Ecosystem Science and Sustainability, Colorado State University, Fort Collins CO 80521, USA
*Corresponding author: SHI Runhe, E-mail:

Received date: 2015-03-16

  Request revised date: 2015-04-30

  Online published: 2015-11-10

Copyright

《地球信息科学学报》编辑部 所有

摘要

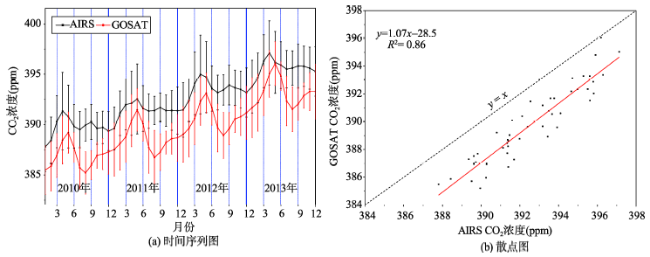
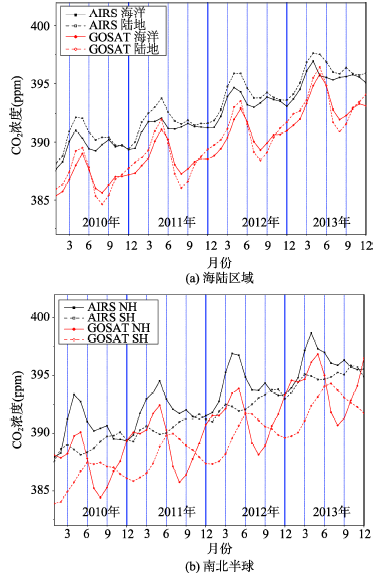
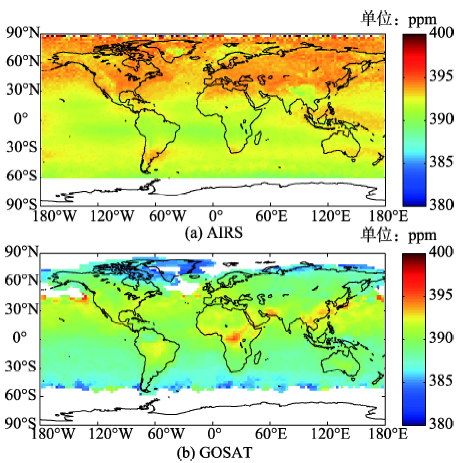
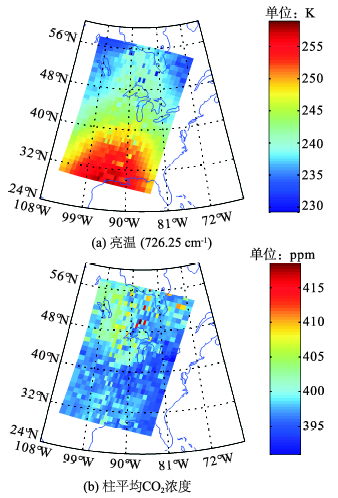
通过地基观测站点的实测数据,首次证实大气温室效应是由人为排放造成的,地表能量平衡受二氧化碳(CO2)浓度水平的影响。因此,分析CO2浓度时空分布特征,从而探究其源汇、控制其排放尤为重要。本文采用AIRS(Atmospheric Infrared Sounder)对流层中层CO2浓度数据及GOSAT(Greenhouse gases Observing SATellite)近地面CO2浓度数据,对比研究了CO2浓度在对流层中层及近地面的时空分布特征差异。结果表明,AIRS探测到的对流层中层CO2浓度,在时空上普遍高于GOSAT探测到的近地面CO2值,高值区位于30°~90°N,浓度多集中在390~395 ppm,这与AIRS探测的对流层中层CO2浓度已充分混合相关;而GOSAT CO2浓度高值区则位于热带、亚热带人口众多的地域,如非洲和中国东部沿海地区等人类活动活跃地带,这也表明GOSAT探测近地面CO2的重要性,其可弥补地基站点测量在空间分布上的不足。本文进一步对比分析了CO2浓度在海陆及南北半球的差异特征及影响原因,CO2在海洋及陆地区域的平均浓度具有相似的时间波动特征,但其浓度在陆地几乎始终高于海洋,这与人类活动释放大量的CO2密切相关。CO2浓度在南北半球存在明显的差异,这是因为南半球的季节变化规律与北半球相反,且由于化石燃料燃烧及土地利用变化等主要集中在北半球,因而北半球CO2浓度高于南半球。此外,本文还对NUCAPS(NOAA/NESDIS/STAR NOAA Unique CrIS/ATMS Processing System)反演得到的CrIS(Cross-track Infrared Sounder)CO2柱平均浓度及廓线产品做了初步分析,发现其与AIRS、GOSAT CO2分析结果一致。

本文引用格式

周聪 , 施润和 , 高炜 . 对流层中层与近地面大气二氧化碳浓度的比较研究[J]. 地球信息科学学报, 2015 , 17(11) : 1286 -1293 . DOI: 10.3724/SP.J.1047.2015.01286

Abstract

Recently, direct observational radiance evidence at two ground-based stations in Southern Great Plains and the North Slope of Alaska confirmed that the theoretical predictions of the atmospheric greenhouse effect due to anthropogenic emissions and provided empirical evidence of how the rising CO2 levels affected the surface energy balance. Therefore, it is important to retrieve CO2 concentration with high precision globally and further to analyze its sources and sinks. This research focuses on the comparison between near-surface and mid-tropospheric CO2 difference characteristics. First, the CO2 products from AIRS (Atmospheric Infrared Sounder) and GOSAT (Greenhouse gases Observing SATellite) were compared globally during 2010 to 2013. Time series result showed that the mid-tropospheric CO2 concentrations in each month from AIRS were all higher than the near-surface CO2 retrieved from GOSAT, which maybe because of the well-mixed of CO2 in mid-troposphere. And the spatial distribution of four year average CO2 was different between AIRS and GOSAT. As for AIRS, the high value region was between 30°N to 90°N, which affected by large amount of land and high human activity. However, the high value region for GOSAT CO2 occurred in tropical and subtropical area, such as Africa and Eastern China with a large population, which is not revealed by AIRS mid-troposphere CO2. The result demonstrates the significance of satellite sensitive to near-surface CO2 like GOSAT, which can provide important information in near-surface to make up the lack of ground-based stations. Moreover, the differences of CO2 between ocean and land, North Hemisphere (NH) and South Hemisphere (SH) were analyzed. The seasonal features of mean CO2 in ocean and land were similar, while CO2 value of land were higher than that of ocean due to human activity. In addition, different characteristics of CO2 in NH and SH was related to the opposite seasonal patterns in both hemispheres. And higher CO2 value occurred in NH because of the burn of fossil fuel. With the degradation of AIRS, CrIS (Cross-track Infrared Sounder) instrument on Suomi NPP (National Polar-orbiting Partnership) was launched in 2011, and promises to provide high quality data like AIRS. Therefore, the CO2 column average and vertical profile products that generated from CSPP (Community Satellite Processing Package) NUCAPS (NOAA/NESDIS/STAR NOAA Unique CrIS/ATMS Processing System) were analyzed for the first time and found consistent conclusions with the comparison between AIRS and GOSAT CO2.

1 引言

政府间气候变化专门委员会(IPCC)第五次评估报告指出,自20世纪50年代以来,大气和海洋变暖、积雪和冰量减少、海平面上升、温室气体浓度增加,气候系统的变暖已经毋庸置疑[1]。由于化石燃料的燃烧及土地利用变化等人类活动导致大气二氧化碳(CO2)的排放增加,其浓度已上升到过去80万年以来前所未有的水平。2015年2月全球平均CO2浓度已达到400.23 ppm,比工业革命前时期(280 ppm)增加了近43%[2],温室气体及其对气候变化的响应机制引起国际上的广泛关注。由CO2及其他温室气体造成的气候影响常用辐射强迫(Radiative Forcing)变化来衡量。辐射传输模式计算表明,自1750年以来,CO2浓度增加导致了对流层全球年均辐射强迫增量为1.82±0.19 Wm-2[3],这对总辐射强迫贡献最大[1]。近期,Feldman等通过在Southern Great Plains和North Slope of Alaska 2个地基观测站点的直接观测辐射数据,首次用实测资料证实了大气温室效应是由人为排放造成的,同时地表能量平衡受CO2浓度水平影响的论断[4]。因此,分析CO2浓度时空分布特征,获取精确的CO2资料,从而探究其源汇、控制其排放尤为重要。
目前,常用的CO2资料来源于地基和卫星2种数据源。地基测量的CO2数据具有较高的精度,常用来验证卫星反演数据的准确性,如温室气体数据中心(World Data Centre for Greenhouse Gases,WDCGG),总碳柱观测网(Total Carbon Column Observing Network,TCCON)等。但由于地基都是单点测量,空间覆盖度低,易受沙漠、高山等地形限制,且维护成本较高,导致地区分布不均匀,无法获得大范围实时观测的CO2信息。与之相反,卫星则能提供稳定、连续、高空间覆盖的数据,因而,在CO2时空分布及源汇研究中占有极其重要的地位。当前,主要的卫星观测CO2仪器分为2种:(1)对红外光谱的探测,可用于对流层中层CO2信息的提取,包括搭载在Aqua卫星上的AIRS(Atmospheric Infrared Sounder)传感器[5],MetOp卫星上的IASI(Infrared Atmospheric Sounding Interferometer)传感 器[6],以及搭载在Suomi-NPP卫星上的新一代CrIS(Cross-track Infrared Sounder)传感器[7];(2)通过对近红外光谱的探测获得近地面CO2浓度信息,包括搭载在欧洲Envisat卫星上的SCIAMACHY(Scanning Imaging Absorption spectroMeter for Atmospheric CHartographY)传感器[8],搭载在GOSAT(Greenhouse gases Observing SATellite)上的TANSO(Thermal And Near-infrared Sensor for carbon Observation)传感器[9],以及在2014年发射升空的OCO-2(Orbiting Carbon Observatory-2)。中国首颗CO2监测卫星(碳卫星,TanSat)计划于2015年发射,将填补中国在温室气体监测方面的技术空白[10-11]
1958年,位于夏威夷的莫纳罗亚山(Mauna Loa)大气测量站开始提供CO2浓度记录,在2013年5月9日,Mauna Loa站点测得的CO2日均浓度首次超过400 ppm阈值,达到400.03 ppm,这一标志性事件引起了国内外学者的极度重视。目前,利用星地数据分析全球及区域CO2的时空分布已有较多研究[12-13];星-星及星-地CO2的对比验证,也对各卫星精度进行了分析[14-15]。在将AIRS对流层中层CO2浓度与全球WDCGG站点CO2测量值进行对比后发现,位于30°N~60°S的站点多分布于海上或海边,受人类活动影响弱,因而对流层中层CO2浓度与其相关性高且差异较小;而30°~90°N区域内,站点多设立在人口众多的地区,且受到陆地生物圈的影响,导致对流层中层CO2与之差异较大[16]。由于站点分布稀疏,无法深入探究其空间分布差异,本文将进一步采用GOSAT近地面CO2产品,研究其与对流层中层AIRS CO2浓度的时空分布特征差异。此外,CrIS仪器设计为确保赤道过境时间为1:30(A.M./P.M.)轨道观测的连续性,将代替AIRS继续提供高精度数据资料。因此,本文初步分析了NUCAPS(NOAA/NESDIS/STAR NOAA Unique CrIS/ATMS Processing System)反演得到的CrIS CO2柱平均浓度及廓线产品。

2 研究数据

2.1 GOSAT近地面CO2数据

近地面CO2数据是GOSAT卫星反演的CO2产品。GOSAT是全球第一个致力于提供温室气体CO2及CH4精确资料的卫星,由日本宇宙航空研究开发机构(JAXA)、日本环境署(MOE)、日本环境研究所(NIES)等联合开发,于2009年1月成功发射,运行在高度约为666 km的太阳同步轨道,过境时间为当地下午13:00,其上搭载的TANSO传感器由FTS(Fourier Transform Spectrometer)及CAI(Cloud and Aerosol Imager)2部分组成[9]。GOSAT重访周期为3 d,可获得全球范围内56 000个观测数据,由于目前数据分析限制在晴空条件下,只有2%~5%数据可用,数据点为1120~2800,但这也远远超过了目前全球地基监测站点总数(小于200个),因而能弥补地基测量站空间覆盖低的不足。本文使用的GOSAT CO2数据为三级短波红外(SWIR)反演的总柱浓度产品(XCO2),下载自GOSAT官方网站(http://www.gosat.nies.go.jp/index_e.html),空间分辨率为2.5°×2.5°,时间范围为2010-2013年。三级产品是通过对二级产品采用普通克里金插值法(Ordinary Kriging)获得[17]

2.2 AIRS对流层中层CO2数据

对流层中层CO2浓度来自AIRS CO2反演产品。AIRS搭载在Aqua卫星上,于2002年9月发射升空,运行在太阳同步的近极地轨道,主要科学目的是观测全球水和能量循环、气候变化与趋势,以及气候系统对温室气体增加的响应。AIRS首次实现了在全球范围内反演每日CO2浓度,包括陆地、海洋和极地地区,有云无云条件[18]。AIRS CO2产品采用偏导数归零法(Vanishing Partial Derivative,VPD)进行反演[19],其空间分辨率为星下点90 km×90 km,数据的空间覆盖范围为90°N~60°S。其三级CO2产品通过对二级标准数据进行格网平均得来,空间分辨率为2°(纬度)×2.5°(经度)。本文使用的三级月平均数据产品来源于NASA官方网站,数据版本为version 5。由于AMSU(Advanced Microwave Sounding Unit)仪器设计寿命小于AIRS,其噪声随着时间而日益增大,在2010年后期,二级反演数据,如温湿廓线产品质量下降,到2011年1月时,相关二级反演产品质量的缺失已严重影响了CO2的反演,因此,2012年后停止使用AMSU数据的联合反演。本文采用仅以AIRS数据反演的产品(简称AIRS3C2M),时间范围为2010-2013年[20],用于分析与GOSAT近地面CO2浓度的时空分布差异及特征。

2.3 NUCAPS CrIS对流层中层CO2数据

CrIS仪器搭载在极轨卫星Suomi-NPP上,于2011年10月28日发射升空,被设计为取代AIRS仪器,来保证其长时期提供资料的连续性。CrIS仪器类型为傅里叶变换光谱仪,有1305个通道,波谱覆盖范围为3.9~15.4 mm,提供高精度温湿度廓线产品及相关痕量气体。NUCAPS是由NOAA STAR(Center for Satellite Applications and Research)开发的,继承自AIRS和IASI(Infrared Atmospheric Sounding Interferometer)的反演算法,用于处理CrIS/ATMS(Advanced Technology Microwave Sounder)数据获得无云辐射数据及痕量气体产品[21]。本研究采用的数据来自威斯康星大学麦迪逊分校的CSPP(Community Satellite Processing Package),其支持一系列直接广播气象及环境卫星的封包及发布。卫星参数信息详见表1
Tab. 1 Detailed information of each instrument

表1 卫星仪器参数详细信息

卫星参数 AIRS TANSO-FTS CrIS
发射日期 2002年5月4日(Aqua) 2009年1月23日(GOSAT) 2011年10月28 日(Suomi-NPP)
过境时间 (当地时) 13:30(升交点) 13:00(降交点) 13:30(升交点)
运行高度 (km) 705.3 666 824
仪器类型 光栅光谱仪 傅立叶变换光谱仪 傅立叶变换光谱仪
波谱范围(μm) 3.7~15.4 0.75~14.3 3.9~15.4
波谱分辨率(cm-1) 0.5~2 0.2 短波2.5;中波1.25;长波0.625
瞬时视场(km) 13.5 10.5 14

3 CO2浓度比较结果与分析

3.1 AIRS与GOSAT CO2时间序列分析

2010-2013年全球平均AIRS与GOSAT CO2月平均浓度的时间序列及散点图见图1,月平均数据为全球范围内数据的平均值。由图1可知,虽然二者调整后的相关系数高达0.9以上,但是,AIRS反演得到的对流层中层CO2全球月平均浓度,始终高于GOSAT近地面CO2浓度。这可能是由于GOSAT探测到CO2近地面“汇”特征导致浓度值偏低,而在大气高层,地表特征因传输过程而被削弱,CO2充分混合,因此,被AIRS探测到的CO2浓度相对较高。二者的CO2浓度高值均出现在春季,低值出现在夏末,这与植被的生长规律密切相关。在春季,植被开始快速生长,呼吸作用增强,因而释放出大量的CO2,再加上冬季供暖导致CO2积累[11];在夏季,植被光合作用增强,吸收了大量的CO2,浓度降低。然而,由于这2种传感器所探测的CO2敏感高度不同,且对流层中层与底层CO2的垂直输送混合需一段时间,因此时间序列上存在着滞后差异[22-23]。时间序列图中误差棒为二者CO2在全球区域内的标准偏差,即其空间差异性,其中AIRS反演结果的空间差异性在春季相对较大,其他季节与GOSAT相差不大。这是因为GOSAT三级CO2产品是由二级产品经过多次克里金插值或线形插值得到,采用临近像元数据进行插值使得其空间差异性变小。
Fig. 1 CO2 concentrations retrieved from AIRS and GOSAT

图1 AIRS与GOSAT全球平均CO2浓度

为了进一步阐释AIRS与GOSAT反演的CO2浓度值的时空差异,本文还分别对南北半球及海陆范围的平均CO2浓度进行了对比分析,结果如图2所示。图2(a)为海洋与陆地区域的平均CO2浓度时间序列,由图可知,CO2浓度在海洋及陆地区域的平均值具有相似的时间波动特征,且与全球平均CO2变化一致,CO2浓度值在陆地几乎始终高于海洋,这与人类活动释放大量的CO2密切相关。对于GOSAT而言,在低值月份,即夏末时,海洋区域CO2浓度值高于陆地区域,这可能与GOSAT能探测到的森林生态系统的固碳作用使CO2浓度降低有 关[24]图2(b)为南半球(NH)与北半球(SH)区域平均CO2浓度的时间序列,由图2可知,CO2浓度的时间序列变化特征,在南北半球存在明显差异,这是因为南半球的季节变化规律与北半球相反[25],此外,由于化石燃料燃烧及土地利用变化等主要集中在北半球,故其CO2浓度高于南半球。
Fig. 2 Time series of mean CO2 from AIRS and GOSAT

图2 AIRS与GOSAT平均CO2浓度的时间序列图

3.2 AIRS与GOSAT CO2空间分布特征

图3展示了AIRS与GOSAT CO2浓度的空间分布结果,数据为2010-2013年的平均值,其中,AIRS的空间分辨率为2°(纬度)×2.5°(经度),GOSAT为2.5°×2.5°。由于二者在空间上差异不大,故本文未将其进行重采样。AIRS反演得到的CO2浓度范围为378.98~418.67 ppm,GOSAT反演的CO2浓度范围为380.96~397.62 ppm。其中,AIRS的CO2浓度大于400 ppm的格网点仅有15个,占总格网数的0.14%,小于380 ppm的格网点仅有1个,这些极值点全部无规律地分布在88°~90°N格网区间内,对CO2浓度的整体空间分布没有影响。因此,图3仅展示了CO2浓度范围为380~400 ppm的空间分布,以探讨AIRS与GOSAT CO2浓度在空间上的分布差异。AIRS探测到的对流层中层CO2浓度,在空间上普遍高于GOSAT探测到的近地面CO2值,这与图1时间序列结果相吻合。AIRS CO2浓度相对混合均匀,其值集中在390~395 ppm,且北半球浓度高于南半球,图2(b)证实了这一点。AIRS的CO2高值区位于30°~90°N,这主要由地面CO2源排放及北半球中纬度大尺度污染带的循环所导致[16,26]。此外,与WDCGG站点CO2测量值的对比研究发现,该区域内的AIRS CO2浓度与其差异较大,进一步说明此高值区域受到了人类排放及大范围陆地生物圈的影响[16]。GOSAT探测到的近地面CO2浓度高值区则位于热带、亚热带人口众多的地域,如非洲和中国东部沿海地区,这与CO2浓度排放受到人为影响息息相关。非洲大陆WDCGG站点较少,此处结论弥补了在对流层中层CO2与近地面站点对比中的不足。故此也说明了GOSAT及其他卫星(如OCO-2),对于探测近地面CO2的重要性。
Fig. 3 Spatial distribution of CO2 concentrations

图3 CO2浓度的空间分布图

3.3 NUCAPS CrIS CO2产品结果分析

由上述分析发现,尽管CO2作为长寿命气体,其在垂直上被广泛认为是混合较均匀的,但是对流层中层及近地面的CO2浓度仍存在显著差异,因此,获得精度可靠的CO2垂直廓线是目前的研究热点之一。联合CO2在不同高度上的浓度差异,可有效地分析其地面源汇特征及传输机制。CO2反演的基本思路是通过调整其廓线分布,使得前向模拟与卫星观测之间的辐射信息之差达到最小。亮温及辐射信息可通过普朗克函数相互转换。本文利用CrIS传感器所获得的亮温分布及反演产品,初步展示CO2廓线的反演结果,进一步验证对流层中层与近地面CO2浓度的差异特征。
本文采用的是CSPP NUCAPS反演得到的条带产品,其空间覆盖范围为美国东部区域(27°~58°N,69°~105°W),图4(a)为CO2敏感波段726.25 cm-1的亮温分布。在该区域内,亮温呈现南高北低的空间分布特征,空间差异为25 K左右。柱平均CO2浓度在空间分布上则与亮温出现相反的趋势,在亮温高值区,CO2浓度较低;在亮温低值区,CO2浓度较 高(图4(b)),这是由于CO2气体吸收辐射信息的 缘故。
Fig. 4 Product results from CSPP NUCAPS CrIS (1st March, 2015)

图4 CSPP NUCAPS CrIS 产品结果(2015年3月1日)

NUCAPS CrIS反演的CO2廓线产品空间分布见图5,该廓线产品所代表的空间区域范围与图4一致,为美国东部区域(27°~58°N,69°~105°W)。每一个垂直高度上的CO2值均为该区域CO2的平均值,且横线表示该区域CO2的标准差,即数据在该区域的离散程度。由图4可知,CO2在垂直分布上具有一定的差异,对流层中层浓度高于近地面CO2浓度,这与上述AIRS与GOSAT的CO2差异一致。在对流层中层以上,CO2垂直差异逐渐减小并趋于稳定。标准差结果表明,尽管该区域内平均CO2在不同高度上差异较小,但是,其空间差异依然十 分显著,最大空间差异出现在对流层中层,约为 10 ppm左右,在对流层中层以上,空间差异较稳定,这与CO2传输至高空垂直混合较均匀有关。近地面CO2在空间分布上差异较小,约为3 ppm,这是由于本文研究区域较小,未涉及到CO2差异较大的源汇分布。
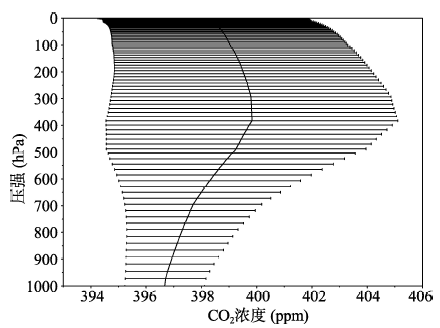
Fig. 5 CO2 vertical profile from CSPP NUCAPS CrIS (1st March, 2015)

图5 CSPP NUCAPS CrIS CO2廓线分布图(2015年3月1日)

4 结论与展望

本文对比研究了对流层中层CO2浓度与近地面CO2浓度的时空分布特征差异。对流层中层CO2浓度值采用AIRS反演结果,近地面则利用GOSAT所探测的近地面CO2浓度值进行时空分布差异研究。此外,本文还分析了NUCAPS CrIS反演得到的CO2空间及垂直分布特征。
(1)从时间序列分析发现, AIRS反演得到的对流层中层CO2全球月平均浓度始终高于GOSAT近地面CO2浓度,这是由于被AIRS探测到的CO2浓度已是充分混合的结果,相对较高。二者调整后相关系数达0.9以上。CO2浓度最高值均出现在春季,最低值出现在夏末,这与植被的生长规律密切相关。此外,进一步对CO2划分为海陆及南北半球区域结果发现,CO2在海陆区域变化一致,且陆地CO2浓度几乎始终高于海洋区域,这与人类活动释放大量的CO2密切相关;且GOSAT探测到在夏末时,陆地CO2浓度低于海洋区域,这可能与森林生态系统固碳作用有关。由于南北半球季节变化规律相反,因此,CO2浓度在南北半球的时间变化特征也呈相反趋势。此外,北半球由于化石燃料燃烧等因素导致其CO2浓度要高于南半球。CO2在大气、陆地、海洋之间的传输受多种因素的影响,这也是目前学术界研究的重要科学问题之一,需进一步深入分析其传输机制。
(2)空间分布特征研究表明,AIRS CO2浓度多集中在390~395 ppm,高值区位于30°~90°N,这主要由地面CO2源排放及北半球中纬度大尺度污染带的循环所导致。而GOSAT CO2浓度高值区则位于热带、亚热带人口众多的地域,如非洲和中国东部沿海地区等人类活动活跃地带,这进一步证明GOSAT及其他卫星(如OCO-2)对于探测近地面CO2的重要性,其可弥补站点测量在空间分布上的不足。然而,卫星反演CO2在精度上依然存在很多问题,只有获得高精度的CO2产品,才能用来分析碳源汇并进而控制CO2排放。而地基FTS仪器可获得近地面高精度的温湿廓线等信息,能弥补并校正卫星在近地面探测的误差。国内首个超光谱红外干涉仪(Atmospheric Sounder Spectrometer by Infrared Spectral Technology Ⅱ,ASSISTⅡ)于2013年在华东师范大学成功安装,因而今后将开展星-地数据融合研究,对卫星资料提供精度保证。
(3)NUCAPS CrIS反演得到的CO2浓度与亮温分布特征相关,亮温高值为CO2浓度低值区,空间分布特征相反,这是CO2吸收辐射信息的结果;CO2廓线的垂直分布显示,对流层中层浓度高于近地面CO2浓度,这与上述AIRS与GOSAT的CO2差异一致,但是差异较小,最大为3 ppm,而同一高度的空间差异依然十分显著,最大值也出现在对流层中层,约为10 ppm,在对流层中层以上,空间差异较稳定,这与CO2传输至高空垂直混合较均匀有关。由此可见,CrIS的NUCAPS反演产品具有一定的可信性,但是,这仅是结果的初步分析,下一步将对其产品进行全面验证,以获得更可靠的CO2时空分布特征。此外,作为AIRS之后的新一代传感器,CrIS的优势在于其较低的仪器噪声,这对反演弱吸收气体CO2非常重要,今后将深入开展反演算法的研究。

The authors have declared that no competing interests exist.

[1]
IPCC. Climate Change Synthesis Report. Contribution of Working Groups I, II and III to the Fifth Assessment Report of the Intergovernmental Panel on Climate Change[J]. [Core Writing Team, Pachauri R K and Meyer L A (eds.)]. IPCC, Geneva, Switzerland, 2014:151.

[2]
Dlugokencky E,Tans P. NOAA/ESRL. Accessed on April 20, 2014. .

[3]
Myhre G, Shindell D, Bréon F M, et al.Anthropogenic and natural radiative forcing [C]. In: Climate Change 2013: The Physical Science Basis. Contribution of Working Group I to the Fifth Assessment Report of the Intergovernmental Panel on Climate Change. [Stocker T F, Qin D, Plattner G K, et al (eds.)]. Cambridge University Press, 2013.

[4]
Feldman D R, Collins W D, Gero P J, et al.Observational determination of surface radiative forcing by CO2 from 2000 to 2010[J]. Nature, 2015,519(7543):339-343.The climatic impact of CO2 and other greenhouse gases is usually quantified in terms of radiative forcing1, calculated as the difference between estimates of the Earth’s radiation field from pre-industrial and present-day concentrations of these gases. Radiative transfer models calculate that the increase in CO2 since 1750 corresponds to a global annual-mean radiative forcing at the tropopause of 1.82 ± 0.19 W m612 (ref. 2). However, despite widespread scientific discussion and modelling of the climate impacts of well-mixed greenhouse gases, there is little direct observational evidence of the radiative impact of increasing atmospheric CO2. Here we present observationally based evidence of clear-sky CO2 surface radiative forcing that is directly attributable to the increase, between 2000 and 2010, of 22 parts per million atmospheric CO2. The time series of this forcing at the two locations—the Southern Great Plains and the North Slope of Alaska—are derived from Atmospheric Emitted Radiance Interferometer spectra3 together with ancillary measurements and thoroughly corroborated radiative transfer calculations4. The time series both show statistically significant trends of 0.2 W m612 per decade (with respective uncertainties of ±0.06 W m612 per decade and ±0.07 W m612 per decade) and have seasonal ranges of 0.1–0.2 W m612. This is approximately more» ten per cent of the trend in downwelling longwave radiation5, 6, 7. These results confirm theoretical predictions of the atmospheric greenhouse effect due to anthropogenic emissions, and provide empirical evidence of how rising CO2 levels, mediated by temporal variations due to photosynthesis and respiration, are affecting the surface energy balance. 00less

DOI PMID

[5]
Crevoisier C, Heilliette S, Chédin A, et al.Midtropospheric CO2 concentration retrieval from AIRS observations in the tropics[J]. Geophysical Research Letters, 2004, 31:L17106.1] Midtropospheric carbon dioxide (CO 2 ) concentration is retrieved in the tropics [20S:20N], over sea, at night, for the period April to October 2003 from the Atmospheric Infrared Sounder (AIRS) observations. The method relies on a non-linear regression inference scheme using neural networks. A rough estimate of the mean precision of the method is about 2.5 ppmv (0.7%). The retrieved seasonal cycle and its latitudinal dependence agree well with aircraft CO 2 in situ measurements made at the same altitude range. Maps produced on a monthly basis at a resolution of 15° × 15°, although not yet fully understood, show good agreement with known characteristics of CO 2 distribution reflecting both atmospheric transport and surface fluxes (fossil fuel emissions, biomass burning, air-surface gas exchanges).

DOI

[6]
Crevoisier C, Chédin A, Matsueda H, et al.First year of upper tropospheric integrated content of CO2 from IASI hyperspectral infrared observations[J].Atmospheric Chemistry and Physics, 2009,9(14):4797-4810.

[7]
Zavyalov V, Esplin M, Scott D, et al. Noise performance of the CrIS instrument[J]. Journal of Geophysical Research: Atmospheres, 2013,118(23):13,108-13,120.Abstract [1] The Cross-track Infrared Sounder (CrIS) is a spaceborne Fourier transform spectrometer (FTS) that was launched into orbit on 28 October 2011 onboard the Suomi National Polar-orbiting Partnership satellite. CrIS is a sophisticated sounding sensor that accurately measures upwelling infrared radiance at high spectral resolution. Data obtained from this sensor are used for atmospheric profiles retrieval and assimilation by numerical weather prediction models. Optimum vertical sounding resolution is achieved with high spectral resolution and multiple spectral channels; however, this can lead to increased noise. The CrIS instrument is designed to overcome this problem. Noise Equivalent Differential Radiance (NEdN) is one of the key parameters of the Sensor Data Record product. The CrIS on-orbit NEdN surpasses mission requirements with margin and has comparable or better performance when compared to heritage hyperspectral sensors currently on orbit. This paper describes CrIS noise performance through the characterization of the sensor's NEdN and compares it to calibration data obtained during ground test. In addition, since FTS sensors can be affected by vibration that leads to spectrally correlated noise on top of the random noise inherent to infrared detectors, this paper also characterizes the CrIS NEdN with respect to the correlated noise contribution to the total NEdN. Lastly, the noise estimated from the imaginary part of the complex FTS spectra is extremely useful to assess and monitor in-flight FTS sensor health. Preliminary results on the imaginary spectra noise analysis are also presented.

DOI

[8]
Barkley M P, Frieß U, Monks P S.Measuring atmospheric CO2 from space using full spectral initiation (FSI) WFM-DOAS[J]. Atmospheric Chemistry and Physics, 2006,6:3517-3534.Satellite measurements of atmospheric CO2 concentrations are a rapidly evolving area of scientific research which can help reduce the uncertainties in the global carbon cycle fluxes and provide insight into surface sources and sinks. One of the emerging CO2 measurement techniques is a relatively new retrieval algorithm called Weighting Function Modified Differential Optical Absorption Spectroscopy (WFM-DOAS) that has been developed by Buchwitz et al. (2000). This algorithm is designed to measure the total columns of CO2 (and other greenhouse gases) through the application to spectral measurements in the near infrared (NIR), made by the SCIAMACHY instrument on-board ENVISAT. The algorithm itself is based on fitting the logarithm of a model reference spectrum and its derivatives to the logarithm of the ratio of a measured nadir radiance and solar irradiance

DOI

[9]
Kuze A, Suto H, Nakajima M, et al.Thermal and near infrared sensor for carbon observation Fourier-transform spectrometer on the Greenhouse Gases Observing Satellite for greenhouse gases monitoring[J]. Applied optics, 2009,48(35):6716-6733.The Greenhouse Gases Observing Satellite (GOSAT) monitors carbon dioxide (CO(2)) and methane (CH(4)) globally from space using two instruments. The Thermal and Near Infrared Sensor for Carbon Observation Fourier-Transform Spectrometer (TANSO-FTS) detects gas absorption spectra of the solar short wave infrared (SWIR) reflected on the Earth's surface as well as of the thermal infrared radiated from the ground and the atmosphere. TANSO-FTS is capable of detecting three narrow bands (0.76, 1.6, and 2.0 microm) and a wide band (5.5-14.3 microm) with 0.2 cm(-1) spectral resolution (interval). The TANSO Cloud and Aerosol Imager (TANSO-CAI) is an ultraviolet (UV), visible, near infrared, and SWIR radiometer designed to detect cloud and aerosol interference and to provide the data for their correction. GOSAT is placed in a sun-synchronous orbit 666 km at 13:00 local time, with an inclination angle of 98 degrees . A brief overview of the GOSAT project, scientific requirements, instrument designs, hardware performance, on-orbit operation, and data processing is provided.

DOI PMID

[10]
刘毅, 杨东旭, 蔡兆男. 中国碳卫星大气CO2反演方法: GOSAT 数据初步应用[J]. 科学通报, 2013(58) 996-999.中国全球二氧化碳监测科学实验卫星(TanSat)预计将于2015年发射升空.针对TanSat的高精度遥感观测科学目标,基于最优估计理论建立能够监测全球碳源汇变化的大气二氧化碳混合比(XCO2)的高精度反演方法.利用碳源汇监测卫星(GOSAT)观测光谱数据开展了反演试验,XCO2反演值与中纬度地面观测结果(TCCON)的对比分析表明:90%的反演误差小于4ppm(1%)(1ppm=1LL1),与日本、美国的反演精度相当;同时,XCO2反演结果也表现出南、北半球碳浓度的季节变化特征.

[11]
张淼, 张兴赢, 刘瑞霞. 卫星高光谱大气 CO2遥感反演精度地基验证研究[J]. 气候变化研究进展,2014,10(6): 427-432.利用TCCON网站提供的北半球7个地面观测站CO<sub>2</sub>干空气混合比(XCO<sub>2</sub>)数据,对3种卫星反演的XCO<sub>2</sub>产品进行了验证,包括SCIAMACHY产品、NIES-GOSAT产品和ACOS-GOSAT产品。结果表明:卫星CO<sub>2</sub>遥感反演产品与地基遥感资料具有较一致的季节性周期变化,一年中月平均浓度最高值均出现在4月和5月,最低值均出现在8月和9月;相对于地面观测,3种卫星产品均低估了XCO<sub>2</sub>;ACOS-GOSAT产品与NIES-GOSAT产品的精度大体相当,误差标准差分别为2.26&times;10<sup>-6</sup>和2.27&times;10<sup>-6</sup>;SCIAMACHY产品的精度略差,误差标准差为2.91&times;10<sup>-6</sup>。

DOI

[12]
Hammerling D M, Michalak A M, O’Dell C, et al. Global CO2 Distributions over Land from the Greenhouse Gases Observing Satellite (GOSAT)[J]. Geophysical Research Letters, 2012,39:L08804.1] January 2009 saw the successful launch of the first space-based mission specifically designed for measuring greenhouse gases, the Japanese Greenhouse gases Observing SATellite (GOSAT). We present global land maps (Level 3 data) of column-averaged CO 2 concentrations (X CO2 ) derived using observations from the GOSAT ACOS retrieval algorithm, for July through December 2009. The applied geostatistical mapping approach makes it possible to generate maps at high spatial and temporal resolutions that include uncertainty measures and that are derived directly from the Level 2 observations, without invoking an atmospheric transport model or estimates of CO 2 uptake and emissions. As such, they are particularly well suited for comparison studies. Results show that the Level 3 maps for July to

DOI

[13]
Buchwitz M, Beek R D, Burrows J P, et al.Atmospheric Methane and Carbon Dioxide from SCIAMACHY Satellite Data: Initial Comparison with Chemistry and Transport Models[J]. Atmospheric Chemistry and Physics, 2005,5:941-962.The remote sensing of the atmospheric greenhouse gases methane (CH4) and carbon dioxide (CO2) in the troposphere from instrumentation aboard satellites is a new area of research. In this manuscript, results obtained from observations of the up-welling radiation in the near-infrared by SCIAMACHY (Scanning Imaging Absorption spectroMeter for Atmospheric CHartographY), which flies on board ENVISAT, are presented. Vertical columns of CH4, CO2 and oxygen (O2) have been retrieved and the (air or) O2-normalized CH4 and CO2 column amounts, the dry air column averaged mixing ratios XCH4 and XCO2 derived. In this manuscript the first results, obtained by using the version 0.4 of the Weighting Function Modified (WFM) DOAS retrieval algorithm applied to SCIAMACHY data, are described and compared with global models. This is an important step in assessing the quality and information content of the data products derived from SCIAMACHY observations. This study investigates the behaviour of CO2 and CH4 in the period from January to October 2003. The SCIAMACHY greenhouse gas column amounts and their mixing ratios for cloud free scenes over land are shown to be in reasonable agreement with models. Over the ocean, as a result of the lower surface spectral reflectance and resultant low signal to noise with the exception of sun glint conditions, the accuracy of the individual data products is poorer. The measured methane column amounts agree with the model columns within a few percent. The inter-hemispheric difference of the methane mixing ratios, determined from single day cloud free measurements over land, is in the range 30–110 ppbv and in reasonable agreement with the corresponding model data (48–71 ppbv). For the set of individual measurements the standard deviations of the difference with respect to the models are in the range ~100–200 ppbv (5–10%) and ±14.4 ppmv (3.9%) for XCH and XCO2, respectively. The XCO2 model field in January shows low CO2 concentrations over a spatially extended CO2 sink region located in southern tropical/sub-tropical Africa. The SCIAMACHY data products also show low CO2 mixing ratios over this area. The measured depth of the "CO2 hole'' in the region covering Zambia and the Congo basin is, however, significantly larger ~20 ppmv) than in the model ~5 ppmv). The model indicates that the sink region becomes a source region about six months later and exhibits higher mixing ratios. The SCIAMACHY and the model data show a similar time dependence of the column mixing ratios over the period from January to October 2003. The amplitude of the differenc

DOI

[14]
Wang C, Shi R H, Zhou C, et al. Comparison of SCIAMACHY and AIRS CO2 measurements over China from 2003 to 2005[C]. SPIE Optical Engineering+Applications. International Society for Optics and Photonics, 2011: 81560N-81560N-9.

[15]
Bai W G, Zhang X Y, Zhang P.Temporal and Spatial Distribution of Tropospheric CO2 over China Based on Satellite Observations[J]. Chinese Science Bulletin, 2010,55:3612-3618.Mid-troposphere CO2 data retrieved by the AIRS (atmospheric infrared sounder) were validated with five ground-based stations and aircraft measurements in the Northern Hemisphere. AIRS CO2 products show good agreement with ground and aircraft observations. The data had a monthly average accuracy better than 3 ppmv. In this study, the spatial and temporal distribution of mid-troposphere CO2 from January 2003 to December 2008 was analyzed based on this satellite product. The average concentration of atmospheric CO2 was higher in the Northern Hemisphere than in the Southern Hemisphere. The yearly average results show a gradual increase from 2003 to 2008. In China, the annual growth rate was about 2 ppmv/a, similar to the United States, Europe, Australia and India, but was slightly lower than Canada and Russia. Mid-troposphere CO2 concentrations were higher over northern China than over southern areas, due to differences in natural conditions and industrial layout. There were four centers of high CO2 concentration between 35掳 and 45掳N over China, with low concentrations over Yunnan Province. There was a significant

DOI

[16]
Zhou C, Shi R H, Liu C S, et al.A correlation analysis of monthly mean CO2 retrieved from the Atmospheric Infrared Sounder with surface station measurements[J]. International Journal of Remote Sensing, 2013,34(24): 8710-8723.measurements are influenced by human activities. We also use root mean square difference (RMSD) and bias as evaluation indicators and find that they have similar trends like correlation coefficients.

DOI

[17]
National Institute for Environmental Studies. Algorithm Theoretical Basis Document for GOSAT TANSO-FTS L3[C]. NIES GOSAT Project, 2011.

[18]
Chahine M T, Chen L, Dimotakis P, et al.Satellite Remote Sounding of Mid-Tropospheric CO2[J]. Geophysical Research Letters, 2008,35:L17807.ABSTRACT Human activity has increased the concentration of the earth's atmospheric carbon dioxide, which plays a direct role in contributing to global warming. Mid-tropospheric CO2 retrieved by the Atmospheric Infrared Sounder shows a substantial spatiotemporal variability that is supported by in situ aircraft measurements. The distribution of middle tropospheric CO2 is strongly influenced by surface sources and large-scale circulations such as the mid-latitude jet streams and by synoptic weather systems, most notably in the summer hemisphere. In addition, the effects of stratosphere-troposphere exchange are observed during a final stratospheric warming event. The results provide the means to understand the sources and sinks and the lifting of CO2 from surface layers into the free troposphere and its subsequent transport around the globe. These processes are not adequately represented in three chemistry-transport models that have been used to study carbon budgets.

DOI

[19]
Chahine M, Barnet C,Olsen E T, et al.On the Determination of Atmospheric Minor Gases by the Method of Vanishing Partial Derivatives with Application to CO2[J]. Geophysical Research Letters, 2005,32:L22803.1] We present a general method for the determination of minor gases in the troposphere from high spectral resolution observations. In this method, we make use of a general property of the total differential of multi-variable functions to separate the contributions of each individual minor gas. We have applied this method to derive the mixing ratio of carbon dioxide in the mid-troposphere using data from the Atmospheric Infrared Sounder (AIRS) currently flying on the NASA Aqua Mission. We compare our results to the aircraft flask CO 2 measurements obtained by H. Matsueda et al. over the western Pacific and demonstrate skill in tracking the measured 5 ppmv seasonal variation with an accuracy of 0.43 卤 1.20 ppmv.

DOI

[20]
AIRS Science Team. AIRS/Aqua Level 3 Monthly CO2 in the free troposphere (AIRS-only), version 005. Greenbelt, MD, USA: Goddard Earth Science Data and Information Services Center (GES DISC), Accessed on February 7, 2014 at doi:10.5067/AQUA/AIRS/DATA336.

[21]
Gambacorta A, Barnet C, Wolf W, et al. The NOAA Unique CrIS/ATMS Processing System (NUCAPS): First light retrieval results[C]. Proceedings of the ITWG meeting, 2012,Toulouse, France.

[22]
赵静, 崔伟宏. 中国区域近地面 CO2时空分布特征研究[J]. 地球信息科学学报, 2014,16(2):207-213.本文利用2009年6月至2010年5月日本宇宙航空研究开发机构(JAXA)、日本环境署(MOE)与日本环境研究(NIES)所等联合开发的全球首颗专用温室气体观测卫星&ldquo;呼吸号&rdquo;(GOSAT)上的被动红外探测器(TANSO)官方反演的近地面975hPa左右的CO<sub>2</sub>浓度L4B数据产品,采用ArcGIS地统计分析方法,对比瓦里关全球大气本底站地面观测数据进行真实性检验,分析中国区域近地面CO<sub>2</sub>浓度分布的时空变化特征。结果表明:中国区域近地面CO<sub>2</sub>浓度空间分布集中,东高西低,差异显著;CO<sub>2</sub>浓度具有明显的季节变化特征,月平均浓度4月份(春季)升至最高,7月份(夏季)降至最低。结合&ldquo;中国统计年鉴2012&rdquo;中的2009年人口密度、能源消费总量(煤)和GDP等辅助数据对比发现:导致中国近地面CO<sub>2</sub>浓度空间分布规律的原因多种多样,不可轻易定论是人为或自然使然,需进一步深入研究。

DOI

[23]
白文广, 张兴赢, 张鹏. 卫星遥感监测中国地区对流层二氧化碳时空变化特征分析[J]. 科学通报, 2010,55(30): 2953-2960.lt;p>利用北半球5个地面本底站和飞机观测CO<sub>2</sub>浓度对AIRS(atmospheric infrared sounder)反演得到的对流层中层CO<sub>2</sub>产品进行验证, 结果显示AIRS反演结果与地面观测和飞机观测结果一致性较好, 月平均偏差小于3 ppmv, 可以用于分析研究对流层CO<sub>2</sub>的时空分布特征. 利用AIRS 近6年观测数据(2003年1月~2008年12月)分析研究显示: 北半球是CO<sub>2</sub>的高值区, 且呈逐年增长态势. 其中, 中国地区的年增长率约为2 ppmv, 与美国、欧洲、澳大利亚、印度等地区相当, 略低于加拿大和俄罗斯. 由于自然条件和工业布局的影响, 中国地区对流层CO<sub>2</sub>总体呈现北高南低的分布规律, 在35&deg;~45&deg;N形成4个高值中心, 云南地区为CO<sub>2</sub>低值分布区. 中国区域对流层CO<sub>2</sub>季节变化特征显著, 高值出现在春季, 低值出现在秋季.</p>

[24]
高扬, 何念鹏, 汪亚峰. 生态系统固碳特征及其研究进展[J]. 自然资源学报, 2013, 28(7):1264-1274.lt;p>生态系统固碳是人类应对气候变化以及全球系统变化过程的研究热点。论文结合生态系统固碳和碳汇概念,探讨生态系统自然固碳、人为工程固碳措施对生态系统功能的影响并分析生态系统固碳特征及风险。研究得出如下结论:陆地生态系统对CO<sub>2</sub>的自然吸收与封存是相对安全有效的固碳措施,对人类与生态系统健康的影响要小于地质层与海洋层固碳。海洋生态系统固碳容易导致海水酸化以及生态系统不可逆的损害;由于地壳运动很难预测,所以地质层固碳可能面临不可预知的风险。因此,利用生态系统自然固碳能力、发展绿色固碳技术是降低人为工程固碳生态风险和减少CO<sub>2</sub>排放到大气中的最佳选择。</p>

DOI

[25]
李丽, 张丽, 燕琴, 等. 基于GOSAT 数据集的全球碳通量分析[J]. 地理与地理信息科学, 2014,30(1):91-96.

[26]
Zhang L, JacobD J, BowmanK W, et al. Ozone-CO Correlations Determined by the TES Satellite Instrument in Continental Outflow Regions[J]. Geophysical Research Letters, 2006,33:L18804.1] Collocated measurements of tropospheric ozone (O 3 ) and carbon monoxide (CO) from the Tropospheric Emission Spectrometer (TES) aboard the EOS Aura satellite provide information on O 3 -CO correlations to test our understanding of global anthropogenic influence on O 3 . We examine the global distribution of TES O 3 -CO correlations in the middle troposphere (618 hPa) for July 2005 and compare to correlations generated with the GEOS-Chem chemical transport model and with ICARTT aircraft observations over the eastern United States (July 2004). The TES data show significant O 3 -CO correlations downwind of polluted continents, with dO 3 /dCO enhancement ratios in the range 0.4–1.0 mol mol 611 and consistent with ICARTT data. The GEOS-Chem model reproduces the O 3 -CO enhancement ratios observed in continental outflow, but model correlations are stronger and more extensive. We show that the discrepancy can be explained by spectral measurement errors in the TES data. These errors will decrease in future data releases, which should enable TES to provide better information on O 3 -CO correlations.

DOI

文章导航

/