全球卫星气候遥感数据

CG-LTDR地表覆盖数据对BCC_AVIM 1.0陆面温度模拟的影响研究

  • 史学丽 , * ,
  • 张芳 ,
  • 周文艳 ,
  • 张艳武
展开
  • 国家气候中心,北京 100081

作者简介:史学丽(1972-),山东乳山人,正研级高工,主要从事陆面过程与气候模式发展、遥感数据的模式应用等方面研究。E-mail:

收稿日期: 2015-05-09

  要求修回日期: 2015-09-07

  网络出版日期: 2015-11-10

基金资助

气象行业专项(GYHY2011060114-3、201306020、201506023)

Impacts of CG-LTDR Land Cover Dataset Updates on the Ground Temperature Simulation with BCC_AVIM 1.0

  • SHI Xueli , * ,
  • ZHANG Fang ,
  • ZHOU Wenyan ,
  • ZHANG Yanwu
Expand
  • National Climate Center, Beijing, 100081 China
*Corresponding author: SHI Xueli, E-mail:

Received date: 2015-05-09

  Request revised date: 2015-09-07

  Online published: 2015-11-10

Copyright

《地球信息科学学报》编辑部 所有

摘要

本文将CG-LTDR数据集中的地表覆盖数据产品应用于北京气候中心陆面模式(BCC_AVIM 1.0)中,并通过数值模拟分析不同覆盖类型的数据(冰川、湿地、湖泊、植被PFT)更新对模拟结果的影响。结果表明,新数据对不同地表类型的基本分布特征都有合理描述,但与模式中原有数据的差异明显,表现为冰川比例在格陵兰岛西部地区增加,湿地在大部分地区都减少,湖泊在北美和欧亚大陆中高纬地区的比例减少,但青藏高原及周边地区小幅增加,植被PFT的差异最明显。与采用模式原地表覆盖数据的控制试验相比,新数据引入所致的改变,主要局限于地表覆盖数据改变的区域。冰川数据更新使高纬冰川积雪区和青藏高原的温度降低,湿地数据提高了欧洲和北美主要水区的地面温度,湖泊数据有效降低了亚洲地区的温度,更新植被PFT的影响最广泛,使得南美、南非、东北亚、北美和澳洲大部分地区的温度升高,而中国华南江南地区以及南亚地区的温度降低,但在一些地区的模拟效果降低。数据全部更新引起的温度改变最明显,但并不是所有类型的简单叠加,尤其在地表复杂区域。不同的覆盖类型数据更新,可在一定程度上减少模式对于地表温度的模拟偏差(如格陵兰岛西部和青藏高原地区、欧洲内陆湖区的温度偏高),因此需适当选用更新的数据。

本文引用格式

史学丽 , 张芳 , 周文艳 , 张艳武 . CG-LTDR地表覆盖数据对BCC_AVIM 1.0陆面温度模拟的影响研究[J]. 地球信息科学学报, 2015 , 17(11) : 1294 -1303 . DOI: 10.3724/SP.J.1047.2015.01294

Abstract

The land cover (LC) datasets of CG-LTDR was applied in the Beijing Climate Center Land Model (BCC_AVIM 1.0). The impacts of different LC type updates on the ground temperature (Tg) were investigated through several numerical simulations. The results show that the CG-LTDR can reasonably describe the LC features. Compared with the original LC rawdata, the glacier fraction of the new CG-LTDR datasets were extensively increased in the high-latitude regions of the Greenland Island and Europe, as well as the Tibetan Plateau; the fraction of wetland was decreased in the major water body areas of North America and Europe; and the percentage of lake was also majorly decreased in the North American inland water area, but slightly increased around the Tibetan Plateau. The PFT present the largest differences between the new and original datasets. Besides the control runs with the original LC dataset (CTL), five simulations were conducted to compare different impacts of LC types (the glacier, wetland, lake, PFT and all types) on Tg. The changes of Tg due to LC dataset updates majorly constrained in the areas where the LC types (fraction) were modified. With the individual updates of glacier (rGlacier), the simulated Tg was lowered in the high-latitude areas. The simulated Tg with new wetland (rWetland) was increased, while the simulated Tg with the new lake (rLake) datasets were effectively decreased in the Tibetan Plateau. These changes were helpful to improve the model performances on Tg simulations. The most significant and extensive changes among the 4 LC types occurred when updating the PFT (rPFT), which were helpful for reducing the errors in the south and east Asian areas, but enlarged the biases in the other regions. The LC dataset updates of all types (rALL) show the most significant impacts on the Tg simulations, which was not simply the linear sum of the individual updates of LC types, especially in the areas having complex types. Therefore, proper introductions of new CG-LTDR land cover datasets were useful to improve the model performance in Tg simulations.

1 引言

不同下垫面覆盖类型,如冰川、水体(湿地和湖泊)和植被,通常作为全球变化研究中的主要体现和参与者而得到持续的关注。例如,IPCC AR5第一工作组报告指出,在水循环变化、冰冻圈退缩等方面也检测到了人类活动影响的信号,更加确信人类活动对20世纪中叶以来气候变暖的主导作用[1]。在数值模式中,地表覆盖作为一个重要的基础输入数据,其质量不仅决定了模式对于地表特征描述的合理性,而且通过相关的参数及复杂的生物地球物理和化学过程以影响陆面过程,并通过耦合过程影响大气、气候(系统)模式[2-3]。随着卫星数据和遥感技术的飞速发展,国际上已有多套全球地表覆盖数据产品,近几年中国也陆续发布了几套全球高分辨率的地表覆盖数据(如FROM-GLC,GlobeLand30)[4-5]。中国科学院地理科学与资源研究所与国家卫星气象中心等单位联合研制的卫星气候数据集(CG-LTDR)也包含全球地表覆盖数据产品,这些都为更新数值模式中的下垫面信息提供了良好的数据基础。
在大多数数值模式中,通常有一个基本地表覆盖数据信息,它在模式的整个积分过程中与其他信息(如地形高度)一样保持不变[6];即使在某些具有动态植被功能的模式中,其动态变化也仅限于特定类型(如自然植被中的森林、灌木和草地)在设定时间(如1年)的覆盖比例变化。这一点与遥感数据产品的严格时效和准确性不同。
地表覆盖信息大多通过陆面过程引入到大气、气候(系统)模式中,因此,地表覆盖遥感数据的模式应用均通过陆面过程模式予以实现。本文选用北京气候中心气候(系统)模式(BCC_ CSM 1.0)的陆面分量过程模式,首次进行CG-LTDR地表覆盖数据的应用试验,并通过多组模拟试验多方位了解不同覆盖类型的数据更新对模拟结果的影响。

2 模式、数据和试验方案

2.1 BCC_AVIM 1.0陆面模式

北京气候中心大气-植被相互作用模式(BCC_AVIM 1.0)是在美国NCAR/CLM3[7]的物理模块和框架结构基础上,融合中国科学院大气物理研究所的大气-植被相互作用动态植被模式(AVIM2)生物化学模块[8-9],并改进不同生物地球物理和化学过程中的参数或方案(如积雪覆盖率[10])发展而来的。该模式不仅较细致地刻画了陆地表面及土壤的能量和水循环过程,而且可描述植被光合作用固定CO2、植被生长/凋落、土壤呼吸释放CO2返回大气等陆地碳循环过程。BCC_AVIM可单独运行,也可与大气模式耦合或通过耦合器与气候系统其他过程耦合,进行气候与气候变化研究(如CMIP5)[11]
BCC_AVIM 1.0对地表覆盖采用逐级分层的结构,以次网格的方式提高模式对下垫面信息及其影响的描述。模式格点陆面部分分为冰川、湿地、湖泊和植被4类(column)。

2.2 地表覆盖数据

陆面(生态)及大气(气候)模式通常有一套相对较高分辨率的原始地表覆盖数据(rawdata),通过插值方法可得到不同分辨率模式网格点及次网格尺度上不同地表类型及其比例。BCC_AVIM 1.0中的原始基础数据包括冰川、湖泊、湿地、植被PFT类型及相关参数,其中,冰川资料取自IGBP DISCover[12],分辨率为0.5º×0.5º;湖泊和湿地资料源于GGHYDRO,分辨率为1º×1º[13],PFT及其覆盖百分比数据源自1 km遥感数据[14],可看出模式中的原有地表覆盖信息来自不同时间和研制者。植被部分根据其功能类型(PFT)进一步划分为不同种类,其中,0为裸土,森林有8个类型:1-温带针叶常绿林、2-北方针叶常绿林、3-北方针叶落叶林、4-热带阔叶常绿林、5-温带落叶常绿林、6-热带阔叶落叶林、7-温带阔叶落叶林、8-北方阔叶落叶林;灌木类型有3种:温带阔叶常绿林、温带阔叶落叶林和北方阔叶落叶林;草地则有极地C3、非极地C3和C4草;作物1类[7]。植被数据的总体统计精度为78.3%。
CG-LTDR中的全球地表覆盖数据产品,将下垫面分为15个地表类型:1-水(湖泊),2-冰雪,3-荒地(barren),4-稀疏植被区(Sparce),5-城市,6-湿地,7-常绿针叶林,8-落叶针叶林;9-常绿阔叶林,10-落叶阔叶林,11-灌木,12-作物耕地,13-草地,14-草地/林地混合型,15-苔藓地衣(Moss),该数据的详细信息可参考刘荣高等研究资料。本文将该地表覆盖数据与参考数据进行了对比分析,表明CG-LTDR地表覆盖数据在中国地区具有与其他同类数据(IGBP DisCover、UMD、GLC2000和MODIS Land Cover等)相当乃至有更高的分类精度,其总体分类精度达65.57%。
BCC_AVIM 1.0模式中的地表覆盖类型与CG-LTDR地表覆盖数据有较大差别,尤其是植被部分。与其他遥感产品相比,尽管新数据中已详细区分了针叶林、阔叶林和落叶林、常绿林,但要满足BCC_AVIM 1.0中的分类方式,还需进一步根据气候带与生态属性进行类型细化。对于非植被类型,如冰川、湿地、湖泊等,可直接应用;对植被PFT类型,本文参考Lawrence和Chase[6]的办法,用MODIS和CRU气候数据进行PFT的类型细分和融合。从高分辨率遥感数据产品(5 km)到原始基础数据(0.5~1º)的尺度转换采用基于面积比例的升尺度方法[15]得到不同类型的覆盖百分比数据。CG-LTDR数据的冰雪类型在南半球60°S以外的地区没有赋值,本文沿用模式原数据中的相应部分来补充,因此,本文的分析中不考虑南极大陆。

2.3 试验方案设计

对于地表覆盖数据更新对模式结果的影响研究,大多数采用全部更新[6,16],也有针对某一类型(如耕地)的方式[17]。由于模式结构和资料等的限制,几种不同覆盖类型对模式结果的影响研究并不多见,通过该工作详细了解不同覆盖类型数据对模式的不同效应。借助BCC_AVIM 1.0模式的结构特点,本文分别考察冰川、湿地、湖泊等非植被类型和植被PFT对模式的影响。详细的试验名称和设计见表1,除了BCC_AVIM 1.0模式采用原有地表覆盖数据进行的模拟试验外,分别进行了单独更新冰川、湿地、湖泊和植被PFT 4种地表覆盖类型,以及所有数据都更新的试验。为尽量保持与原有数据在时间上的接近,本文选用1999年的CG-LTDR地表覆盖数据进行试验。除地表覆盖数据不同外,模拟试验的其他设置完全相同,大气强迫场采用普林斯顿大学发布的数据[18],积分时间为1980-2008年。
Tab. 1 BCC_AVIM 1.0 simulation experiments with different land cover type datasets

表1 针对地表覆盖类型数据的BCC_AVIM 1.0模拟试验列表

试验名称 试验方案设计
CTL 用模式原始数据生成T106格点上的地表覆盖数据
rGlacier 同CTL,但更新冰川类型覆盖比例数据
rWetland 同CTL,但更新湿地覆盖比例数据
rLake 同CTL,但更新湖泊覆盖比例数据
rPFT 同CTL,但更新植被不同PFT覆盖比例数据
rALL 同CTL,但更新全部覆盖类型数据

2.4 CG-LTDR与模式原地表覆盖数据的差异

图1给出CG-LTDR数据中的3个非植被覆盖类型百分比及其与原数据的差值分布。图1可看出,冰川积雪主要分布于60°N以北的高纬地区(格陵兰岛及其周边地区)和青藏高原及周边地区(图1(a));湿地广泛分布在南北美洲、欧洲、非洲和亚洲等内陆水体区(图1(b));湖泊主要位于美洲、欧洲和非洲部分地区以及我国的长江流域一带,在其他地区的比例较小(图1(c))。因此,新数据对这3种地表类型的基本特征都有较合理的描述。
与CTL地表覆盖数据相比,新的冰川覆盖比例,在格陵兰以西部分和高原周边等地区增加(10%~20%),而格陵兰岛东北边缘有10%左右的减少(图1(d))。湿地的覆盖比例在几乎所有分布区都表现为偏小,在欧洲和北美等地的局部差别可高达30%~40%(图1(e))。2个湖泊数据的覆盖比例差异主要出现在北半球的内陆湖区,CG-LTDR数据在北美湖区的比例比原数据减少10%左右,欧亚大陆高纬地区也有小幅减少,但在青藏高原附近地区有小幅增加(图1(f))。2个水体类型的差别,可能与各遥感产品中判别的标准和定义不同有关。
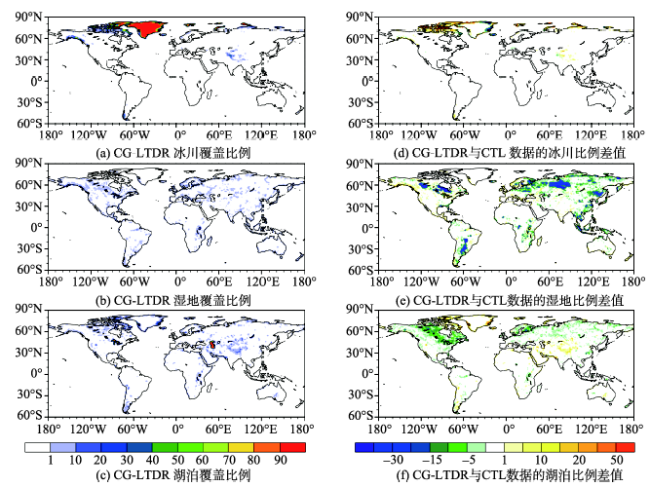
Fig. 1 Fractions of the non-vegetation types in CG-LTDR dataset (left) and their differences with the original data in CTL (right)

图1 CG-LTDR数据中不同非植被类覆盖类型百分比(左)及其与CTL原有数据的差值(右)(%)

图2给出CG-LTDR数据不同植被类型分布状况及其与原模式数据的差别。新数据中的森林(图2(a))主要分布在北半球中高纬地区、南美、低纬非洲和亚洲地区等,进一步分析发现其中针叶林主要分布在45°N以北和青藏高原东南部地区,常绿阔叶林分布于热带地区,落叶阔叶林的分布遍布全球,但其通常都小于20%。灌木的分布也比较广泛,大值区主要位于30°N以北的北美和欧亚大陆,覆盖比例可高达70%~80%(图2(b))。草地主要分布于两半球的中纬度地区和澳大利亚(图2(c)),其中,C3草主要分布在南北半球30°纬度之外的地区,C4草主要位于南半球。作物耕地的大值区包括亚洲、欧洲和美洲大陆、澳大利亚东南部,以及南美部分地区(图2(d))。裸土主要分布在格陵兰半岛、非洲到中亚一带的沙漠区,以及澳大利亚中西部、南美西部和非洲西南角的沙漠地带(图2(e))。
CG-LTDR与CTL中的数据相比覆盖百分比差异非常明显,在北方寒带林区(欧亚和北美)与南美林区的百分比偏高,非洲和北半球中纬度的林区覆盖比例减少(图2(f))。灌木的分布在北半球中高纬地区的覆盖比例高于CTL,而在美洲西海岸地区、中西亚和澳大利亚等地区的比例都偏低(图2(g)),草地的差异分布总体与灌木的相反(图2(h)),这可能与不同数据中对于植被类型的定义方式不同有关。耕地的比例在欧洲西北部、南美东部和美国中部表现为偏低,而在其他地区大多偏高(图2(i))。裸土百分比在非洲到中亚一带偏高,而高寒地区的比例偏低(图2(j))。
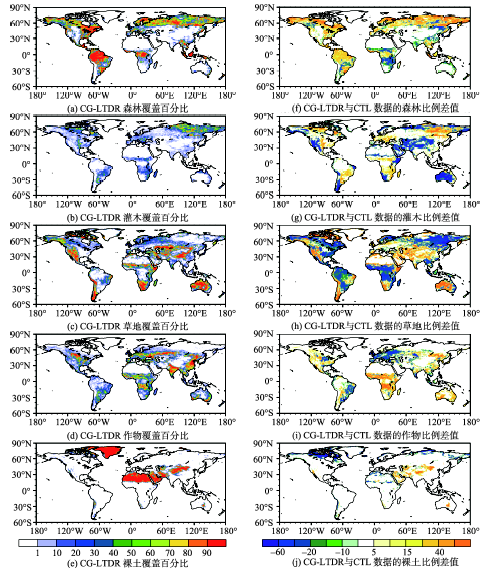
Fig. 2 Fractions of various PFTs in CG-LTDR and their differences with the original data in CTL

图2 CG-LTDR数据中不同植被PFT覆盖类型百分比及其与CTL原有数据的差值

3 BCC_AVIM1.0控制试验

在研究新数据对模拟结果的影响之前,先了解控制试验(CTL)对地面温度的模拟效果,本文用ERA-Interim资料作为“观测”数据[19]。从图3可看出,CTL模拟与观测的地面温度平均分布特征非常一致(图3(a)-(b)),但差值结果显示CTL模拟在许多地区存在偏差,最明显的是青藏高原、落基山脉等大地形区的温度偏高,局地偏高甚至超过4 ℃,在东南亚地区、非洲和南美大陆部分地区的温度也偏高(<4 ℃);高纬格陵兰岛附近地区的温度比观测偏低2~4 ℃(图3(c))。
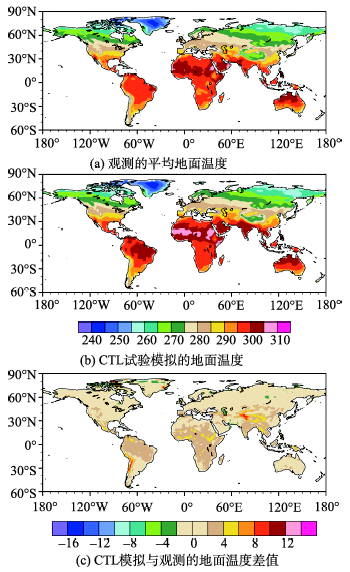
Fig. 3 ERA-interim observation (a), CTL simulation (b) and the differences between CTL and ERA-interim data (c) for ground temperature

图3 ERA-interim观测、CTL模拟,以及CTL与观测的地面温度差(K)

从逐月的时间变化来看,BCC_AVIM 1.0模式对于不同地区的温度年变化特征,都有较好的模拟;在几个偏差较大的地区,CTL模拟与观测的地面温度偏差也有不同。在格陵兰西部地区(70°~80°N, 60°~90°W)和欧洲湿地湖泊区(55°~60°N,90°~100°E)的偏差有季节性,表现为夏季偏高、冬季偏低(图4(a)-(b)),而在青藏高原地区(25°~40°N,60°~90°E),CTL模拟值一直都高于ERA-Interim,存在系统偏差(图4(c))。
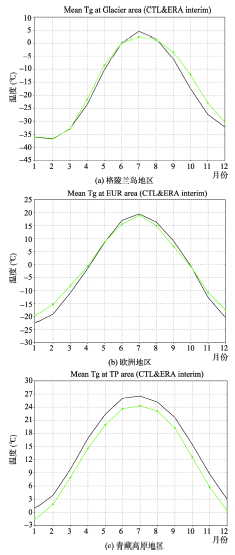
Fig. 4 CTL simulated and ERA-Interim observed temporal evolution of ground temperature

图4 CTL模拟与ERA-interim观测的不同区域平均的地面温度年变化图

注:图4中黑色线为CTL模拟结果,绿色点线为ERA-interim观测

因此,BCC_AVIM 1.0模式可合理再现全球和局地的地面温度变化特征,但在一些典型(如冰川、大地形区)区域等存在明显的温度偏差,这与模式的地表覆盖等基础数据有关,尤其与模式的物理过程方案有关[20],故需进一步改进。

4 CG-LTDR数据更新对地面温度 模拟的影响

采用CG-LTDR数据更新的所有试验结果,都与CTL模拟的地温时空变化特征总体一致,但量值上存在一定差异。为突显这种差别,本文主要分析5个引入新数据的试验与CTL的差值,以研究不同地表类型覆盖数据更新对陆面模式结果的影响。

4.1 空间分布

图5给出的地表温度水平分布差值,表明不同的数据更新对地面温度的影响不尽相同。采用新的冰川资料(rGlacier)后主要引起地面温度的降低,尤其是北半球高纬度格陵兰岛西部和欧洲部分地区,这与图2(a)中的冰川覆盖比例增加有关。值得注意的是,其在一些较高的山脉区(如青藏高原、落基山脉、南美和南非部分地区),尽管覆盖比例的差异不明显,但模拟的温度有0.3~ 0.6 ℃的差别,大多也表现为温度降低,有利于减少模式的偏差。因为在这些地区,模式网格点中非植被类型覆盖所占比例较大,在网格点温度计算中的权重较大;再加上冰雪类的显著反照率和效应比其他类型都显著,所以,对温度的影响比较显著(图5(a))。湿地数据更新(rWetland)的影响区域比冰川的广,表现为在北半球中高纬主要水体区的模拟温度升高,尤其是北美湖区,这不利于减少模式偏差(图5(b))。更新湖泊数据引起的地面温度变化主要出现在青藏高原周边地区,表现为模拟温度比CTL偏低(最大约0.5℃),有助于减少该地区的模拟误差(图5(c))。最大的温度变化出现在植被数据更新的rPFT试验中,差异的范围最广而且差值最大,东北亚地区、南美和非洲林区温度升高(最大差值超过1 ℃),中国南方及印度等地的温度降低,对比图3可发现,该试验仅在东南亚和赤道非洲地区减少模式偏差,而在其他地区都加剧了偏差(图5(d))。从图5(e)可看出,更新所有地表覆盖数据后温度的变化范围最广,且基本反映出各下垫面类型的显著影响,但在一些多类型共存的区域(如南北半球的中高纬地区),新数据更新的影响并非几种覆盖类型的简单累加表征。
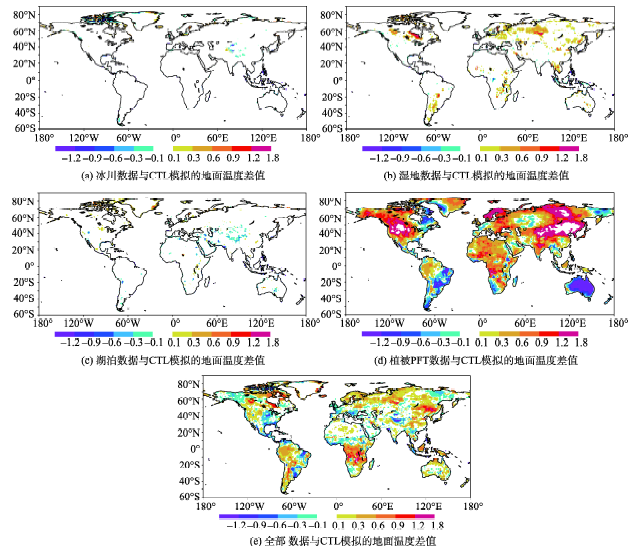
Fig. 5 Ground temperature differences between the land cover data revision experiments rGlacier, rWetland, rLake, rPFT, rALL and CTL

图5 更新下垫面覆盖数据试验与CTL模拟的地面温度差值

4.2 时间变化

从不同区域平均地面温度差值的时间变化看,所有更新试验与CTL的差值都小于1 ℃,而且不同覆盖类型数据更新的贡献有明显差异。在格陵兰岛以西的部分地区,rGlacier起到降温的作用(尤其是夏季),有助于减少CTL模拟的偏差,而其他试验中都表现为升温,尤其是rPFT试验(图6(a))。欧洲湿地湖泊区,引起地面温度变化最大的是rPFT和rALL试验,在春季降温高达0.7 ℃,在秋冬季则为小幅增温,rLake和rWetland引起的温度变化在0.1º范围内(图6(b))。在青藏高原地区,与CTL差值最大的依然是rPFT,其在暖季的增温可超过0.6 ℃,rALL次之,rLake在暖季可降低地面温度(<0.2 ℃),rGlacier试验也可小幅降低模拟的地面温度,rWetland几乎无影响(图6(c)),因此,对该地区而言,非植被类的数据更新有利于减少模式的偏差。
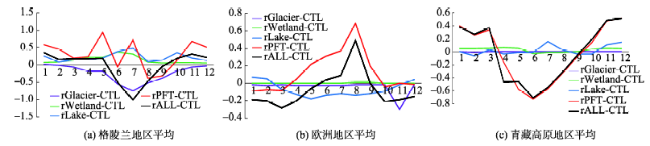
Fig. 6 The regional mean ground temperature differences between land cover data revision and CTL experiments.

图6 地表数据更新数据试验与CTL模拟的区域平均地面温度差值时间变化

因此,不同类型数据对温度的影响并不都是正面的,部分引入不同地表类型的新数据可在一定程度上减少BCC_AVIM 1.0模拟与观测之间的偏差。

4.3 地表覆盖数据对其他陆面变量的影响

地表数据改变引起BCC_AVIM 1.0模拟的地表温度变化与如下过程有关:新数据对下垫面类型的描述变化(类型和覆盖百分比)通过模式中的相关特征参数(如反照率、气动阻抗、表面粗糙度等),以及模式中的不同过程参数化过程影响表面的辐射收支及能量平衡、植被冠层的蒸散发和截流水等变量,影响陆面感热和潜热通量,最终影响温度。
从上述分析可见,更新所有地表覆盖数据(rALL)引起的地面温度变化,在冰川、湖泊、湿地和PFT典型(覆盖比例较大)地区的表现,基本与各类型数据单独更新试验一致。作为垂直一维模式,试验结果合理。由图7给出的rALL试验与CTL模拟的感热和潜热通量差值空间分布可看出,植被与非植被类下垫面,对热通量的主要影响区域不同,且效果相反。植被PFT在陆地表面的覆盖范围在4种下垫面类型中最大,因而其影响最为显著。
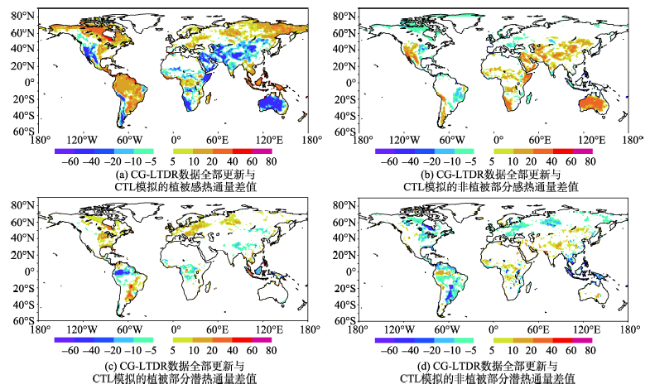
Fig. 7 The vegetation's and bare soil's sensible and latent heat fluxes differences

图7 rALL试验与CTL模拟的感热与潜热通量差值

本文以地面温度为主要分析对象,探讨不同类型地表覆盖数据更新对模式结果的影响,发现遥感反演的地表覆盖数据产品及其在数值模式中的应用都较为复杂。遥感数据产品在模式中的合理应用,需做好“协调”工作,在准确合理的数据信息原则上,可通过改变模式下垫面信息提高模拟效果,但事实上因为模式系统不完善、输入数据不匹配等问题,地表数据的更新不一定都会对模式结果产生正面影响。NCAR/CLM 3.5中曾经更新了湿地资料,但因为对土壤湿度等水循环变量的不利影响,后来的CLM4版本又沿用以前的数据[16]。CG-LTDR地表覆盖数据在BCC_AVIM 1.0模式中的应用,也需甄选可用数据方能提高对地面温度的模拟 效果。

5 结论与讨论

本文利用CG-LTDR中的地表覆盖产品,首次对陆面过程模式BCC_AVIM 1.0的应用进行了试验,并通过单独更新冰川、湿地、湖泊和植被PFT数据,以及全部更新数据的方式,全面比较新数据对陆面温度模拟的影响范围及程度。主要结论如下:
(1)与模式中的原覆盖数据相比,CG-LTDR数据中的冰川百分比数据在格陵兰岛以西地区有明显增加,湿地与湖泊等内陆水体大多减小,但高原附近地区的比例增加,植被PFT类型的差别最大。这主要与各遥感数据对覆盖类型的定义分类和标准不同有关。
(2)更新冰川、湿地、湖泊和植被等类型的地表覆盖数据,对BCC_AVIM 1.0模拟地表温度的影响,大多仅局限于地表覆盖百分比发生改变的地区。其中,更新冰川数据可降低格陵兰岛以西及青藏高原等大地形区的地面温度,水体数据主要引起内陆水区的温度变化,植被PFT数据更新引起的变化范围广、量值大。最大的改变出现在所有数据都更新的试验中,但其影响并不是各类型单独更新的简单线性叠加,尤其是覆盖类型较复杂的区域。地表数据更新引起的温度改变在有些区域可减少模拟的偏差。地表数据更新对地表温度模拟的改变,是通过影响陆面的热量和水份及通量实现的,其在植被与非植被部分的影响区域和幅度有明显差异。
本工作仅进行了CG-LTDR地表覆盖数据产品,在BCC_AVIM 1.0陆面模式中的应用试验,未来还要进行大气环流模式的耦合试验,为数据在其他模式中的应用提供必要参考。此外,基于长时间按序列(1982-2012年)的地表覆盖数据产品,未来可考虑把这些变化信息引入到模式以提高模式对下垫面地表覆盖及其变化的描述能力。

The authors have declared that no competing interests exist.

[1]
秦大河,T. Stocker,259名作者和TSU(驻伯尔尼和北京).IPCC第五次评估报告第一工作组报告的两点结论[J].气候变化研究进展,2014,10(1):1-6.IPCC第五次评估报告(AR5)第一工作组(WGI)报告的亮点结论,是过去7年全世界气候变化科学研究成果凝练出来的精华。20世纪50年代以来全球气候变暖的一半以上是人类活动造成的。1971年以来人为排放温室气体产生热量的93%进入了海洋,海洋还吸收了大约30%人为排放的CO<sub>2</sub>,导致海表水pH值下降了0.1,等等。采用全球耦合模式比较计划第五阶段(CMIP5)的模式,预估未来全球气候变暖仍将持续,21世纪末全球平均地表温度在1986&mdash;2005年的基础上将升高0.3~4.8℃。限制气候变化需要大幅度持续减少温室气体排放。如果将1861&mdash;1880年以来人为CO<sub>2</sub>累积排放控制在1000 GtC,那么人类有超过66%的可能性把未来升温幅度控制在2℃以内(相对1861&mdash;1880年)。

DOI

[2]
孙菽芬. 陆面过程的物理、生化机理和参数化模型[M].北京:气象出版社,2005.

[3]
Pitman P J.Review:The evolution of, and revolution in, land surface schemes designed for climate models[J]. International Journalof Climatology, 2003,23:479-510.The land surface is a key component of climate models. It controls the partitioning of available energy at the surface between sensible and latent heat, and it controls the partitioning of available water between evaporation and runoff. The land surface is also the location of the terrestrial carbon sink. Evidence is increasing that the influence of the land surface is significant on climate and that changes in the land surface can influence regional- to global-scale climate on time scales from days to millennia. Further, there is now a suggestion that the terrestrial carbon sink may decrease as global temperatures increase as a consequence of rising CO 2 levels. This paper provides the theoretical background that explains why the land surface should play a central role in climate. It also provides evidence, sourced from climate model experiments, that the land surface is of central importance. This paper then reviews the development of land surface models designed for climate models from the early, very simple models through to recent efforts, which include a coupling of biophysical processes to represent carbon exchange. It is pointed out that significant problems remain to be addressed, including the difficulties in parameterizing hydrological processes, root processes, sub-grid-scale heterogeneity and biogeochemical cycles. It is argued that continued development of land surface models requires more multidisciplinary efforts by scientists with a wide range of skills. However, it is also argued that the framework is now in place within the international community to build and maintain the latest generation of land surface models. Further, there should be considerable optimism that consolidating the recent rapid advances in land surface modelling will enhance our capability to simulate the impacts of land-cover change and the impacts of increasing CO 2 on the global and regional environment. Copyright 漏 2003 Royal Meteorological Society

DOI

[4]
Lawrence P J, Chase T N.Representing a new MODIS consistent land surface in the Community Land Model (CLM 3.0)[J]. Journal of Geophysical Research, 2007,112(G1), G01023,doi:10.1029/2006JG000168.1] Recently a number of studies have found significant differences between Moderate Resolution Imaging Spectroradiometer (MODIS) land surface mapping and the land surface parameters of the Community Land Model (CLM) of the Community Climate System Model (CCSM). To address these differences in land surface description, we have developed new CLM 3.0 land surface parameters that reproduce the physical properties described in the MODIS land surface data while maintaining the multiple Plant Functional Type (PFT) canopy and herbaceous layer representation used in CLM. These new parameters prescribe crop distributions directly from historical crop mapping allowing cropping to be described in CLM for any year from 1700 to current day. The new model parameters are calculated at 0.05 degrees resolution so they can be aggregated and used over a wider range of model grid resolutions globally. Compared to the current CLM 3.0 parameters, the new parameters have an increase in bare soil fraction of 10% which is realized through reduced tree, shrub, and crop cover. The new parameters also have area average increases of 10% for leaf area index (LAI) and stem area index (SAI) values, with the largest increases in tropical forests. The new land surface parameters have strong repeatable impacts on the climate simulated in CCSM 3.0 with large improvements in surface albedo compared to MODIS values. In many cases the improvements in surface albedo directly resulted in improved simulation of precipitation and near-surface air temperature; however, for the most part the existing biases of CCSM 3.0 remained with the new parameters. Further analysis of changes in surface hydrology revealed that the increased LAI of the new parameters resulted in lower overall evapotranspiration with reduced precipitation in CCSM 3.0. This was an unexpected result given that other research into the impacts of vegetation change suggests that the new parameters should have the opposite impact. This suggests that while the new parameters significantly improve the climate simulated in CLM 3.0 and CCSM 3.0, the new surface parameters have limited success in rectifying surface hydrology biases that result from the parameterizations within the CLM 3.0.

DOI

[5]
Gong P, Wang J, Yu L, et al.Finer resolution observation and monitoring of global land cover: First mapping results with Landsat TM and ETM+ data[J]. International Journal of Remote Sensing, 2013,34(7):2607-2654.

[6]
Chen J, Chen J, Cao X, et al. Global land cover mapping at 30m resolution: A POK-based operational approach[J].ISPRS Journal of Photogrammetry and Remote Sensing, 2015(103):7-27.Global Land Cover (GLC) information is fundamental for environmental change studies, land resource management, sustainable development, and many other societal benefits. Although GLC data exists at spatial resolutions of 300聽m and 1000聽m, a 30聽m resolution mapping approach is now a feasible option for the next generation of GLC products. Since most significant human impacts on the land system can be captured at this scale, a number of researchers are focusing on such products. This paper reports the operational approach used in such a project, which aims to deliver reliable data products.Over 10,000 Landsat-like satellite images are required to cover the entire Earth at 30聽m resolution. To derive a GLC map from such a large volume of data necessitates the development of effective, efficient, economic and operational approaches. Automated approaches usually provide higher efficiency and thus more economic solutions, yet existing automated classification has been deemed ineffective because of the low classification accuracy achievable (typically below 65%) at global scale at 30聽m resolution. As a result, an approach based on the integration of pixel- and object-based methods with knowledge (POK-based) has been developed. To handle the classification process of 10 land cover types, a split-and-merge strategy was employed, i.e. firstly each class identified in a prioritized sequence and then results are merged together. For the identification of each class, a robust integration of pixel-and object-based classification was developed. To improve the quality of the classification results, a knowledge-based interactive verification procedure was developed with the support of web service technology. The performance of the POK-based approach was tested using eight selected areas with differing landscapes from five different continents. An overall classification accuracy of over 80% was achieved. This indicates that the developed POK-based approach is effective and feasible for operational GLC mapping at 30聽m resolution.

DOI

[7]
Oleson K W, Dai Y J, Bonan G, et al.Technical description of the Community Land Model (CLM)[M]. Boulder: NCAR/TN-461+STR, 2004.

[8]
Ji J J.A climate-vegetation interaction model-simulating the physical and biological process at the surface[J]. Journal of Biogeography, 1995,22(2-3):445-451.ABSTRACT Annual variations of physical and biological processes at the surface were simulated with a climate-vegetation interaction model (AVIM). For the sake of consistency with the hierarchy of current climate models, it is assumed that the structure and functions of plant ecosystems in the simplified plant growth model are stable and in balance with soil and climatic environment. The model is constructed by coupling a plant growth physiological model with the soil vegetation atmosphere transfer (SVAT) scheme. The LPM, a SVAT-type sheme in the coupled model, includes energy and water transfer processes: raditation transfer and sensible heat exchange as well as rainfall, interception, drainage, surface runoff, infiltration, evapotranspiration, etc. In the plant growth model, living vegetation consists of three main biomass compartments: foliage, stem and root and the dead vegetation; a litter layer is also included. Photosynthesis, respiration, dry matter allocation in the tissues and decomposition of organic matter are taken into consideration. All these physiological process are affected by photosynthetic active radiation, CO2 concentration in the atmosphere, temperature and moisture of air and soil which are predicted by the SVAT model. Meanwhile, the leaf area index, and then the roughness, albedo and other dynamical parameters of vegetation change with the growth of plant influence energy, water and CO2 exchanges between the surface and the atmosphere to realize the interaction between climate and vegetation. The annual variations of biomass, carbon dioxide, energy and water fluxes at the surface were simulated with the AVIM for temperate forest ecosystem in Northern China. The results compare well with the observations.

DOI

[9]
Ji JJ, Huang M, Li K.Prediction of carbon exchange between China terrestrial ecosystem and atmosphere in 21st century[J]. Science China Earth Sciences, 2008,51(6):885-898.ABSTRACT The projected changes in carbon exchange between China terrestrial ecosystem and the atmosphere and vegetation and soil carbon storage during the 21st century were investigated using an atmosphere-vegetation interaction model (AVIM2). The results show that in the coming 100 a, for SRES B2 scenario and constant atmospheric CO2 concentration, the net primary productivity (NPP) of terrestrial ecosystem in China will be decreased slowly, and vegetation and soil carbon storage as well as net ecosystem productivity (NEP) will also be decreased. The carbon sink for China terrestrial ecosystem in the beginning of the 20th century will become totally a carbon source by the year of 2020, while for B2 scenario and changing atmospheric CO2 concentration, NPP for China will increase continuously from 2.94 GtC &middot; a611 by the end of the 20th century to 3.99 GtC &middot; a611 by the end of the 21st century, and vegetation and soil carbon storage will increase to 110.3 GtC. NEP in China will keep rising during the first and middle periods of the 21st century, and reach the peak around 2050s, then will decrease gradually and approach to zero by the end of the 21st century.

DOI

[10]
李伟平,刘新,聂肃平,等.气候模式中积雪覆盖率参数化方案的对比研究[J].地球科学进展,2009,24(5):512-522.lt;p>&nbsp;&nbsp;&nbsp;&nbsp;&nbsp; 利用基于NCEP再分析的近地面气候资料驱动陆面过程模型NCAR CLM3,检验了6种积雪覆盖率参数化方案(CLM3、Douville1995、Roesch2001、Wu2004、Yang1997、Niu2007)模拟的积雪覆盖率的季节变化,并与NOAA AVHRR得到的观测结果进行了对比分析。结果表明,在NCAR CLM3的物理过程框架之下,CLM3、Douville1995、Roesch2001三种方案低估了广大地区的积雪覆盖率,模拟的雪线位置偏北,尤其是在秋季积雪初期;Wu2004方案低估了秋季欧亚大陆的积雪覆盖率;Yang1997方案模拟的积雪覆盖率有些偏高,尤其是在积雪覆盖区的南部边缘;考虑积雪密度变化的Niu2007方案一定程度上克服了Yang1997方案的正偏差。春季末期,6种方案模拟的雪线位置都偏北。在地形比较平缓的地区,Niu2007方案的整体效果最好。观测和模拟的积雪覆盖率的出现频数大部分集中在低(小于0.2)和高(大于0.8)覆盖率等级,中等覆盖率所占比例很少。</p>

[11]
吴统文,宋连春,李伟平,等.北京气候中心气候系统模式研发进展——在气候变化研究中的应用[J].气象学报,2014,71(1):12-29.较全面地介绍了北京气候中心气候系统模式(BCC_CSM)研发所取得的一些进展及其在气候变化研究中的应用,重点介绍了全球近280 km较低分辨率的全球海-陆-气-冰-生物多圈层耦合的气候系统模式BCC_CSM1.1和110 km中等大气分辨率的BCC_CSM1.1(m),以及大气、陆面、海洋、海冰各分量模式的发展。BCC_CSM1.1和BCC_CSM1.1(m)气候系统模式均包含了全球碳循环和动态植被过程。当给定全球人类活动导致的碳源排放后,就可以模拟和预估人类活动对气候变化的影响。BCC_CSM1.1和BCC_CSM1.1(m)已应用于IPCC AR5模式比较,为中外开展气候变化机理分析和未来气候变化预估提供了大量的试验数据。还介绍了BCC_CSM1.1和BCC_CSM1.1(m)参与国际耦合模式比较计划(CMIP5)的大量试验分析评估结果,BCC_CSM能够较好地模拟20世纪气温和降水等气候平均态和季节变化特征,以及近1000年的历史气候变化,所预估的未来100年气候变化与国际上其他模式的 CMIP5试验预估结果相当。初步的分析表明,分辨率相对高的 BCC_CSM1.1(m)在区域气候平均态的模拟上优于分辨率较低的BCC_CSM1.1。

DOI

[12]
Loveland T R, Reed B C, Brown J F, et al.Development of a global land cover characteristics database and IGBP DISCover from 1km AVHRR data[J]. International Journalof Remote Sensing, 2000,21(6-7):1303-1330.Researchers from the U.S. Geological Survey, University of Nebraska-Lincoln and the European Commission's Joint Research Centre, Ispra, Italy produced a 1 km resolution global land cover characteristics database for use in a wide range of continental-to global-scale environmental studies. This database provides a unique view of the broad patterns of the biogeographical and ecoclimatic diversity of the global land surface, and presents a detailed interpretation of the extent of human development. The project was carried out as an International Geosphere-Biosphere Pr

DOI

[13]
Cogley J G.GGHYDRO —— Global Hydrographic Data Release 2.0[R]. Trent Climate Note 91-1, Department of Geography, Trent University, Peterborough, Ontario, 1991.

[14]
Bonan G B, S Levis, L Kergoat, et al. Landscapes as patches of plant functional types: An integrating concept for climate and ecosystem models[J]. Global Biogeochemistry Cycles, 2002,16(2):5.1-5.23.1] While most land models developed for use with climate models represent vegetation as discrete biomes, this is, at least

DOI

[15]
Yu L, Wang J, Li X C, et al.A multi-resolution global land cover dataset through multisource data aggregation[J]. Science China Earth Sciences, 2014,57(10):2317-2329.Recent developments of 30 m global land characterization datasets (e.g., land cover, vegetation continues field) represent the finest spatial resolution inputs for global scale studies. Here, we present results from further improvement to land cover mapping and impact analysis of spatial resolution on area estimation for different land cover types. We proposed a set of methods to aggregate two existing 30 m resolution circa 2010 global land cover maps, namely FROM-GLC (Finer Resolution Observation and Monitoring-Global Land Cover) and FROM-GLC-seg (Segmentation), with two coarser resolution global maps on development, i.e., Nighttime Light Impervious Surface Area (NL-ISA) and MODIS urban extent (MODIS-urban), to produce an improved 30 m global land cover map鈥擣ROM-GLC-agg (Aggregation). It was post-processed using additional coarse resolution datasets (i.e., MCD12Q1, GlobCover2009, MOD44W etc.) to reduce land cover type confusion. Around 98.9% pixels remain 30 m resolution after some post-processing to this dataset. Based on this map, majority aggregation and proportion aggregation approaches were employed to create a mul

DOI

[16]
Lawrence D M, Oleson K W, Flanner M G, et al.Parameterization improvements and functional and structural advances in version 4 of the Community Land Model[J]. Journal of Advances in Modeling Earth Systems, 2011,3(1):M03001, doi:10.1029/2011MS000045.1] The Community Land Model is the land component of the Community Climate System Model. Here, we describe a broad set of model improvements and additions that have been provided through the CLM development community to create CLM4. The model is extended with a carbon-nitrogen (CN) biogeochemical model that is prognostic with respect to vegetation, litter, and soil carbon and nitrogen states and vegetation phenology. An urban canyon model is added and a transient land cover and land use change (LCLUC) capability, including wood harvest, is introduced, enabling study of historic and future LCLUC on energy, water, momentum, carbon, and nitrogen fluxes. The hydrology scheme is modified with a revised numerical solution of the Richards equation and a revised ground evaporation parameterization that accounts for litter and within-canopy stability. The new snow model incorporates the SNow and Ice Aerosol Radiation model (SNICAR) - which includes aerosol deposition, grain-size dependent snow aging, and vertically-resolved snowpack heating &ndash; as well as new snow cover and snow burial fraction parameterizations. The thermal and hydrologic properties of organic soil are accounted for and the ground column is extended to 鈭50-m depth. Several other minor modifications to the land surface types dataset, grass and crop optical properties, surface layer thickness, roughness length and displacement height, and the disposition of snow-capped runoff are also incorporated. The new model exhibits higher snow cover, cooler soil temperatures in organic-rich soils, greater global river discharge, and lower albedos over forests and grasslands, all of which are improvements compared to CLM3.5. When CLM4 is run with CN, the mean biogeophysical simulation is degraded because the vegetation structure is prognostic rather than prescribed, though running in this mode also allows more complex terrestrial interactions with climate and climate change.

DOI

[17]
Lobell D B, Bala G, Duffy P B.Biogeophysical impacts of cropland management changes on climate[J]. Geophysical Research Letter, 2006,33(6):L06708,doi:10.1029/2005GL025492.1] It is well known that expansion of agriculture into natural ecosystems can have important climatic consequences, but changes occurring within existing croplands also have the potential to effect local and global climate. To better understand the impacts of cropland management practices, we used the NCAR CAM3 general circulation model coupled to a slab-ocean model to simulate climate change under extreme scenarios of irrigation, tillage, and crop productivity. Compared to a control scenario, increases in irrigation and leaf area index and reductions in tillage all have a physical cooling effect by causing increases in planetary albedo. The cooling is most pronounced for irrigation, with simulated local cooling up to 658°C and global land surface cooling of 1.3°C. Increases in soil albedo through reduced tillage are found to have a global cooling effect (650.2°C) comparable to the biogeochemical cooling from reported carbon sequestration potentials. By identifying the impacts of extreme scenarios at local and global scales, this study effectively shows the importance of considering different aspects of crop management in the development of climate models, analysis of observed climate trends, and design of policy intended to mitigate climate change.

DOI

[18]
Sheffield J, Goteti G, Wood E F.Development of a 50-yr high-resolution global dataset of meteorological forcings for land surface modeling[J]. Journal of Climate, 2006,19(13):3088-3111.Abstract Understanding the variability of the terrestrial hydrologic cycle is central to determining the potential for extreme events and susceptibility to future change. In the absence of long-term, large-scale observations of the components of the hydrologic cycle, modeling can provide consistent fields of land surface fluxes and states. This paper describes the creation of a global, 50-yr, 3-hourly, 1.0掳 dataset of meteorological forcings that can be used to drive models of land surface hydrology. The dataset is constructed by combining a suite of global observation-based datasets with the National Centers for Environmental Prediction鈥揘ational Center for Atmospheric Research (NCEP鈥揘CAR) reanalysis. Known biases in the reanalysis precipitation and near-surface meteorology have been shown to exert an erroneous effect on modeled land surface water and energy budgets and are thus corrected using observation-based datasets of precipitation, air temperature, and radiation. Corrections are also made to the rain day statistics of the reanalysis precipitation, which have been found to exhibit a spurious wavelike pattern in high-latitude wintertime. Wind-induced undercatch of solid precipitation is removed using the results from the World Meteorological Organization (WMO) Solid Precipitation Measurement Intercomparison. Precipitation is disaggregated in space to 1.0掳 by statistical downscaling using relationships developed with the Global Precipitation Climatology Project (GPCP) daily product. Disaggregation in time from daily to 3 hourly is accomplished similarly, using the Tropical Rainfall Measuring Mission (TRMM) 3-hourly real-time dataset. Other meteorological variables (downward short- and longwave radiation, specific humidity, surface air pressure, and wind speed) are downscaled in space while accounting for changes in elevation. The dataset is evaluated against the bias-corrected forcing dataset of the second Global Soil Wetness Project (GSWP2). The final product provides a long-term, globally consistent dataset of near-surface meteorological variables that can be used to drive models of the terrestrial hydrologic and ec

DOI

[19]
Dee D P, Uppala S M, Simmons A J, et al. The ERA-Interim reanalysis: configuration and performance of the data assimilation system[J]. Quarterly Journal of the Royal Meteorological Society, 137(656):553-597.ABSTRACT ERA-Interim is the latest global atmospheric reanalysis produced by the European Centre for Medium-Range Weather Forecasts (ECMWF). The ERA-Interim project was conducted in part to prepare for a new atmospheric reanalysis to replace ERA-40, which will extend back to the early part of the twentieth century. This article describes the forecast model, data assimilation method, and input datasets used to produce ERA-Interim, and discusses the performance of the system. Special emphasis is placed on various difficulties encountered in the production of ERA-40, including the representation of the hydrological cycle, the quality of the stratospheric circulation, and the consistency in time of the reanalysed fields. We provide evidence for substantial improvements in each of these aspects. We also identify areas where further work is needed and describe opportunities and objectives for future reanalysis projects at ECMWF. Copyright 漏 2011 Royal Meteorological Society

DOI

[20]
陈海山,熊明明,沙文钰.CLM3.0对中国区域陆面过程的模拟试验及评估I:土壤温度[J].气象科学,2010,30(5):621-630.利用NCAR公用陆面模式 (Community Land Model 3.0,CLM3.0)及普林斯顿大学1948—2001年1°×1°、3 h一次的全球大气近地面强迫资料,对中国地区1948-2001年的土壤温度进行了off-line模拟试验,通过对模拟结果和全国台站观测土壤温度资料 的对比,评估了CLM3.0对中国区域不同层次土壤温度的模拟能力。结果表明:模式能模拟出中国地区多年平均土壤温度的空间分布型,除部分地区模拟比观测 偏高外,模式模拟的土壤温度普遍偏低;模式能较好地反映出中国地区土壤温度的年际变化,对4月的模拟稍好于7月。对于划分的8个子区域,东部区域模拟好于 其它各区,除高原一带外,表层的模拟均好于深层;模式基本能抓住土壤温度的变化趋势,而且模拟出了7月长江流域以南地区土壤温度显著降低这一趋势,但模拟 的趋势比观测有所偏弱。

DOI

文章导航

/