全球卫星气候遥感数据

基于LTDR AVHRR和MODIS观测的全球长时间序列叶面积指数遥感反演

  • 刘洋 ,
  • 刘荣高 , *
展开
  • 中国科学院地理科学与资源研究所 资源与环境信息系统国家重点实验室,北京 100101
*通讯作者:刘荣高(1970-),研究员,博士,研究方向为定量遥感。E-mail:

作者简介:刘 洋(1986-),女,甘肃庆阳人,博士,研究方向为定量遥感反演与分析。E-mail:

收稿日期: 2015-03-06

  要求修回日期: 2015-04-21

  网络出版日期: 2015-11-10

基金资助

气象行业科研专项(GYHY201106014)

国家自然科学基金项目(41301354)

中国科学院战略性先导科技专项(XDA05090303)

资源与环境信息系统国家重点实验室青年人才培养基金项目(08R8B6G0YA)

Retrieval of Global Long-term Leaf Area Index from LTDR AVHRR and MODIS Observations

  • LIU Yang ,
  • LIU Ronggao , *
Expand
  • State Key Laboratory of Resources and Environmental Information System, Institute of Geographic Sciences and Natural Resources Research, Chinese Academy of Sciences, Beijing 100101, China
*Corresponding author: LIU Ronggao, E-mail:

Received date: 2015-03-06

  Request revised date: 2015-04-21

  Online published: 2015-11-10

Copyright

《地球信息科学学报》编辑部 所有

摘要

叶面积指数是描述土壤-植被-大气之间物质和能量交换的关键参数,获取大区域长时间序列叶面积指数有助于研究气候变化条件下植被的响应及反馈。本文利用MODIS观测和经过重新处理的地表长时间数据集(Land Long Term Data Record)LTDR AVHRR数据,生成了全球1981-2012年叶面积指数数据。算法通过建立二者之间像元级关系,利用高质量MODIS观测约束历史AVHRR数据的反演,这有助于减小2种存在显著差别传感器反演结果的不一致性,也有助于提高AVHRR反演质量。首先算法利用高质量MODIS地表反射率反演2000-2012年叶面积指数,然后利用多年每8 d的LTDR AVHRR地表反射率数据计算简单比植被指数(Simple Ratio,SR),利用SR平均值和MODIS LAI平均值建立像元级AVHRR SR-MODIS LAI关系。在此基础上,实现1981-1999年AVHRR LAI反演,最终得到全球1981-2012年叶面积指数数据。本算法反演的AVHRR和MODIS LAI与全球植被的空间分布吻合,能表征主要生物群系类型的季节变化特征,2个数据集一致性较好,并且与NASA MODIS LAI标准产品(MOD15A2)的空间分布和季节变化曲线吻合较好。

本文引用格式

刘洋 , 刘荣高 . 基于LTDR AVHRR和MODIS观测的全球长时间序列叶面积指数遥感反演[J]. 地球信息科学学报, 2015 , 17(11) : 1304 -1312 . DOI: 10.3724/SP.J.1047.2015.01304

Abstract

Leaf area index (LAI) is a primary parameter for charactering the water, carbon and energy exchanges among soil, vegetation and the atmosphere. Global long-term LAI datasets help to understand the response and feedback of vegetation to climate change. In this paper, the global LAI was retrieved during a 32-year period from 1981 to 2012 by utilizing a combination of MODIS measurements and reprocessed long-term data record (LTDR) AVHRR observations. The high-quality MODIS observations were used to constrain the LAI retrieval from historical AVHRR data, by establishing the pixel-by-pixel relationship between them directly. Thus, the inconsistency of LAI derived from these two notably different sensors could be reduced, and the quality of LAI derived from AVHRR data could be improved. Firstly, MODIS LAI series (2000-2012) were generated from high-quality MODIS land surface reflectance based on the GLOBCARBON LAI algorithm. Then, the relationships between AVHRR Simple Ratio (SR) and MODIS LAI were regressed pixel-by-pixel using the multi-year average values of these two data for each 8-day period. After that, the AVHRR LAI was estimated from historical AVHRR observations based on these pixel-level relationships from 1981 to 1999. The retrieved LAI could represent the spatial distribution of global vegetation and the seasonal characteristics of the major biomes. The LAI derived from AVHRR was inter-compared with that from MODIS. The results demonstrate a good consistency between the LAIs from these two different sensors. The comparison with NASA MODIS standard products of MOD15A2 shows that our results are consistent with MOD15A2 in both spatial pattern and seasonal cycle.

1 引言

叶面积指数(Leaf Area Index,LAI)是定量分析植被生长动态和生物物理过程的一个重要植被结构参数,也是大多数气候、水文、生物地球化学和生态系统模型的关键输入参数[1-2]。获得大区域长时间序列叶面积指数有助于模拟陆地生态系统碳水循环对气候变化的响应和反馈[3]
自20世纪70年代以来,NOAA/AVHRR、SPOT/VEGETATION、TERRA-AQUA/MODIS、ENVISAT/MERIS和TERRA/MISR等卫星传感器持续观测地球表面。目前已生成了多个叶面积指数标准产品,如AVHRR数据的ECOCLIMAP[4]和ISLSCP-II[5],VEGETATION数据的CYCLOPES[6]、GLOBCARBON[7]和加拿大叶面积指数图[8],MODIS数据的MOD15[2],以及MERIS LAI[9]和MISR LAI[10],并被应用于全球碳、水循环等研究[11-12]。但是,这些叶面积指数数据多以单个传感器生成,其时间序列大多较短。
基于AVHRR和MODIS观测可生成长时间序列叶面积指数数据。已有学者利用三维辐射传输模型,通过修正不同传感器冠层光谱方向反射率的波段和空间分辨率差异,基于AVHRR GIMMS NDVI数据获得了1981-2006年与MODIS LAI标准产品MOD15相似质量的长时间序列叶面积指数数据[13]。但是,AVHRR的数据质量低于MODIS,而低质量的AVHRR数据直接采用传统基于物理模型反演的方法得到的叶面积指数质量劣于MODIS。通过AVHRR和MODIS的重叠观测,建立了每个像元上AVHRR 简单比植被指数(Simple Ratio,SR)和MODIS反演得到的高质量LAI之间的关系,获得了1981-2012年全球高一致性的叶面积指数GLOBMAP LAI[14]。但GLOBMAP LAI采用的GIMMS NDVI数据存在定标和大气校正的问题,且数据空间分辨率仅为8 km。地表长时间数据集(Land Long Term Data Record,LTDR)计划改进NOAA/AVHRR的定标等预处理,并且对数据进行大气校正,提供全球0.05°AVHRR 地表反射率数据,为历史叶面积指数反演提供了更高质量的数据源[15]
本文基于LTDR AVHRR和MODIS数据重新生成全球1981年以来的叶面积指数数据。首先算法基于高质量MODIS观测反演获得2000年之后的叶面积指数,然后通过建立其与LTDR AVHRR植被指数之间像元级的关系,实现MODIS高质量观测约束AVHRR反演,最终生成全球1981-2012年0.05°分辨率的叶面积指数数据。对反演结果进行了空间分布、季节变化及植被类型合理性分析,并与NASA MODIS标准产品MOD15进行了比较。

2 数据及算法

2.1 AVHRR及MODIS数据

本文基于MODIS地表反射率和土地覆盖数据,实现2000年以来MODIS LAI反演,利用LTDR AVHRR地表反射率数据计算简单比植被指数SR,建立像元级别AVHRR SR-MODIS LAI关系,实现1981年以来的AVHRR LAI反演,并用最新版本的NASA MODIS标准产品MOD15A2(C5)评估算法结果。
LTDR重新处理AVHRR观测生成了1981年以来的地表方向反射率等数据。该数据集重新处理了NOAA 7、9、11、14、16和17的AVHRR 4 km全球覆盖GAC(Global Area Coverage)数据,基于净海和精确的瑞利散射计算对红波段和近红外波段进行了传感器衰退定标[16],利用NCEP、TOMS等数据进行了大气校正,提供了红波段、近红外波段和中红外波段的地表反射率,以及中红外波段和热红外波段大气顶层亮温、太阳和观测角度及质量信息[15]。覆盖1981年7月到1999年12月,时间分辨率为天,空间分辨率为0.05°。
MODIS数据空间分辨率为250~1000 m。其中,MOD09为地表反射率产品,提供了全球8 d合成500 m分辨率的1-7波段消除了大气中气体、气溶胶和薄卷云影响的地表方向反射率数据。本文采用MODIS全球土地覆盖分类产品MCD12Q1(500 m)的IGBP全球植被分类体系结果,该分类将全球植被分为17类,包括11种自然植被、3种混合地类和3种非植被类型。叶面积指数/光合有效辐射吸收比率产品MOD15A2提供了全球8天合成1 km分辨率陆地植被的叶面积指数数据。
为了与LTDR AVHRR数据进行匹配,将2000-2012年MODIS地表反射率MOD09A1、叶面积指数数据MOD15A2以及土地覆盖数据MCD12Q1转换为等距圆柱投影(Plate Carrée Projection),分别合成到全球范围,并利用状态标志信息对云污染、水和冰雪像元进行标识。

2.2 叶面积指数反演算法

本算法通过建立像元级别AVHRR SR-MODIS LAI关系,用MODIS高质量观测约束AVHRR反演,生成长时间序列叶面积指数数据。算法由3个步骤组成:(1)利用MODIS地表反射率驱动GLOBCARBON LAI算法[7],生成2000-2012年MODIS LAI数据;(2) 分别统计每8 d MODIS LAI和LTDR AVHRR SR的均值,并建立像元级别的AVHRR SR-MODIS LAI关系;(3) 利用LTDR AVHRR 地表反射率数据,以SR-LAI关系反演,生成1981-1999年AVHRR LAI数据。最终,为了保持时间序列的统一性和去除云的影响,将AVHRR和MODIS进行空间和时间重采样,通过时间和空间内有效值平均的方法转换为0.05°、8 d分辨率,构成长时间序列叶面积指数序列。
2.2.1 基于MODIS地表反射率反演MODIS LAI
采用GLOBCARBON LAI算法,基于MOD09A1地表反射率和观测、太阳角度数据,生成2000-2012年MODIS LAI时间序列。算法采用植被覆盖类型的LAI-SR和LAI-RSR(减小简单比植被指数Reduced Simple Ratio)关系,并利用4尺度模型和切比雪夫多项式单独考虑了BRDF效应。反演中采用MCD12Q1土地覆盖分类数据,将MCD12Q1 Type1 IGBP全球植被分类体系的17种分类归并为6种,包括草地和谷类作物、针叶林、热带雨林、落叶阔叶林、混交林及灌丛,非植被覆盖区域未参与反演[7]。首先通过不同植被类型的LAI-SR/RSR关系提取有效叶面积指数,然后利用基于MODIS生成的500 m分辨率像元集聚指数来考虑植被的集聚效应,将有效叶面积指数转换为真实叶面积指数[17],如式(1)所示。
LAI = L eff / Ω (1)
式中, LAI 为真实叶面积指数; LA I eff 为有效叶面积指数; Ω 为集聚指数。
2.2.2 像元级AVHRR SR-MODIS LAI关系建立
植被的生长具有显著的季节变化规律,而且这种特征在年际间保持相对稳定。通过多年观测,统计获得每个像元上AVHRR植被指数(Vegetation Index,VI)和MODIS LAI每8 d的平均状况,通过LAI与VI之间良好的相关关系,建立像元级的AVHRR VI-MODIS LAI关系模型。本研究采用SR作为植被指数建立VI-LAI关系[8],具体步骤如下:
(1)AVHRR SR计算。基于1981-1999年AVHRR地表反射率数据,利用近红外波段反射率除以红波段反射率计算SR。
(2)AVHRR SR和MODIS LAI数据时空一致性处理。反演获得MODIS LAI空间分辨率为500 m,时间分辨率为8 d,而AVHRR SR则分别为0.05°和每天,需进行一致性处理。将500 m分辨率的MODIS LAI重采样为0.05°,采样方法为取0.05°内有效反演的平均值,并通过每8 d有效值平均的方法,将AVHRR SR数据时间分辨率由每天转换为8 d。
(3)构建像元级的AVHRR SR-MODIS LAI关系。对于每个像元,利用1981-1999年的AVHRR SR计算每8 d SR的平均值,并利用2000-2012年MODIS LAI计算每8 d的LAI平均值。利用每个像元(x,y)46个SR均值和LAI均值代表植被的季节变化状况,拟合该像元 LA I x , y S R x , y 之间的线性关系系数 a x , y b x , y ,从而获得像元级的AVHRR SR-MODIS LAI关系(式(2))。
LA I x , y = a x , y × S R x , y + b x , y (2)
式中, LA I x , y 为像元(x,y)的叶面积指数; S R x , y 为像元(x,y)的简单比植被指数SR; a x , y b x , y 为像元(x,y) LAI与SR之间的线性关系系数。
2.2.3 基于AVHRR SR反演AVHRR LAI
对于AVHRR SR影像中的每个像元(x,y),分别查找该像元对应的AVHRR SR-MODIS LAI关系模型系数 a x , y b x , y ,并根据式(2)将AVHRR观测的SR反演得到LAI。对于标识为非植被的像元,不作反演。

3 叶面积指数遥感反演结果与分析

利用2000-2012年MODIS 8 d合成地表反射率MOD09A1和1981-1999年LTDR AVHRR地表反射率数据,基于本算法实现了全球叶面积指数反演。最终,长时间序列数据集由AVHRR LAI(1981-1999年)和MODIS LAI(2000-2012年)组成,时间分辨率为8 d,空间分辨率为0.05°。NASA提供的MODIS叶面积指数标准产品MOD15是目前最常用的全球叶面积指数遥感产品之一,将本算法反演结果与最新版(C5)MOD15A2进行比较,以评估本算法效果。采用2001-2011年8 d合成MOD15A2产品进行比较,去除云和备用算法结果后,通过范围内有效值平均采样到0.05°。

3.1 遥感反演结果

图1是1995、2005年1月(DOY001)及7月(DOY193)反演的叶面积指数分布图。其中,1995年为AVHRR反演结果,2005年为MODIS反演结果,2个传感器反演结果的空间分布类似,都合理地反映出全球植被的空间分布和季节特征。相对于南半球和赤道区域,北半球(30°~70°N)的季节变化更为显著。北半球中高纬度广泛分布着落叶林和落叶作物,受年内辐射和温度变化的影响,该区域植被具有显著的季节变化,而反演得到的叶面积指数表征了这一特征。赤道区域水热条件常年优越,覆盖类型多为常绿林,因而叶面积指数常年在4以上。而南半球(30°~70°S)植被覆盖区域较小,叶面积指数的季节变化相对较小。1995年和2005年叶面积指数略有差别:1月刚果盆地2005年叶面积指数略小于1995年同期;而7月北美东部的2005年叶面积指数大于4的区域则比1995年更为广阔。这可能与植被10年间的变化有关,也可能是2个传感器的差别尚未完全消除。
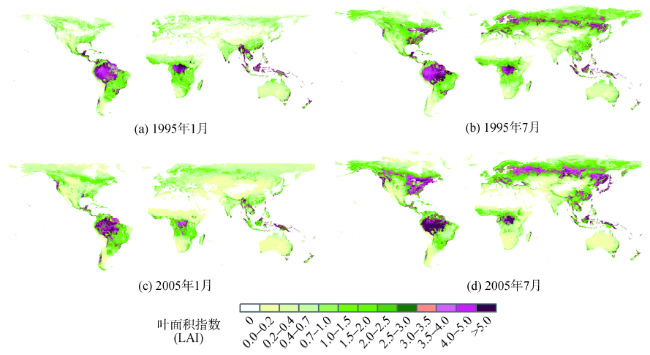
Fig. 1 LAI map in January (DOY001) and July (DOY193) in 1995 and 2005

图1 1995和2005年1月(DOY001)及7月(DOY193)叶面积指数分布图

3.2 叶面积指数的空间分布

为了评价产品结果在空间分布上的合理性,分别统计了AVHRR LAI和MODIS LAI在1月和7月的LAI均值,并与MODIS标准产品MOD15A2进行比较。为保证结果的可靠性,MODIS LAI和MOD15A2统计的时间范围一致,都采用有完整数据的年份(2001-2011年),AVHRR统计范围为1983-1999年。
图2为AVHRR、MODIS及MOD15A2 在1月及7月的平均叶面积指数分布图。3个数据的空间分布在总体上吻合良好。1月,南半球中低纬度(20°~50°S)植被区域AVHRR、MODIS和MOD15A2 叶面积指数多在2-3,澳大利亚内陆的非森林区域则在1以下;而北半球中高纬(30°~70°N)由于处于冬季,叶面积指数小于2,甚至降至1。MODIS LAI、MOD15A2 LAI和AVHRR LAI小于1的像元占该区域总植被像元比例分别高达89.34%、95.61%和95.18%。7月,南美洲和非洲中南部处于冬季,叶面积指数相应降低到2以下;北半球中高纬森林覆盖区处于夏季,植被生长茂盛,森林叶面积指数多大于3甚至4。沿赤道的热带区域,植被常年茂盛,热带雨林叶面积指数在1月和7月多大于4。
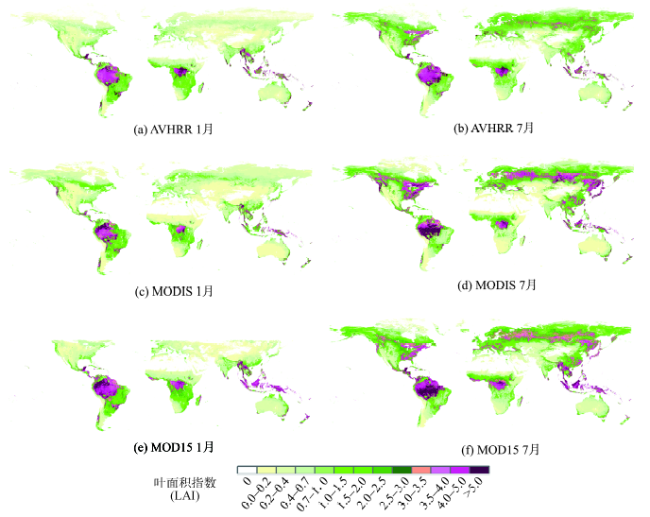
Fig. 2 AVHRR, MODIS and MOD15A2 mean LAI maps in January and July

图2 AVHRR、MODIS及MOD15A2的1月及7月平均叶面积指数分布图

3个数据集也存在一些差别。1月,MODIS LAI在亚马逊东部和刚果盆地的热带雨林区域,叶面积指数大于3.5的区域范围略小于AVHRR LAI和MOD15A2,这可能是由于热带雨林区域薄卷云的检测存在问题,一些残云参与反演导致叶面积指数偏低。另外,1月,50°N 以北MOD15A2的叶面积指数值缺乏有效反演,这可能是由于冰雪和云检测等影响,缺乏对有效的晴空遥感观测值的判断用于反演。7月,MODIS LAI和MOD15A2 LAI在北美东部,以及北半球高纬的北方森林区域叶面积指数多在4以上,略大于AVHRR LAI,这既可能是由于算法未能完全消除AVHRR和MODIS传感器的差别,也可能是北半球高纬植被受到全球变暖的影响近年来生长更加茂密;另外,北方森林区域MODIS LAI也略高于MOD15A2 LAI,这可能是由于MOD15A2算法利用三维辐射传输模型考虑了冠层、植被和景观尺度的集聚效应,而MODIS LAI采用了像元级集聚指数,直接考虑了植被的集聚效应,可更好地表征北方森林广泛分布的针叶林显著的叶片集聚特征。

3.3 叶面积指数的季节变化

为了评估叶面积指数的季节变化合理性,采取AVHRR LAI、MODIS LAI和MOD15A2 LAI数据集不同生物群系类型的时间序列曲线进行分析。首先,分别计算3个数据集每8 d有效反演的均值,其中,AVHRR LAI采用1983-1999年数据,MODIS LAI和MOD15A2 LAI采用2001-2011年数据。然后,对于每8 d,分别计算6种主要生物群系类型(包括针叶林、落叶阔叶林、常绿阔叶林、混交林、灌丛、草地和作物)全球该类型所有像元叶面积指数平均值,从而获得时间序列曲线。其中,采用MCD12Q1 Type 1 IGBP全球植被分类结果判断像元生物群系类型(归并方法见文献[18])。雪/冰、裸地或稀疏植被和水体未参与统计。
图3为6种不同生物群系类型的叶面积指数时间序列剖面。3个叶面积指数数据集的时间序列曲线接近,可表征不同生物群系类型显著的季节变化特征和差异。针叶林叶面积指数1-5月在1左右,6月开始急剧增大,7-8月达到最大值(2-3.5),9月开始降为2以下。落叶阔叶林同样呈现出显著的季节变化,但其叶面积指数在6-9月稳定在3左右,平台期长于针叶林,这可能是由于落叶阔叶林相对针叶林生长纬度更低,一年中水热条件较优的生长季时段长于针叶林。混交林的季节变化曲线类似针叶林和落叶阔叶林,叶面积指数达到3左右的平台期长度介于二者之间。常绿阔叶林的叶面积指数年内变化较小,常年在4左右。灌丛、草地和作物叶面积指数的年际变化小于森林,一般7-8月达到最大值1-1.5,其余时段则基本在1以下。总体来说,除热带雨林外,叶面积指数的季节曲线与北半球的气候特征吻合,都在7-8月达到最大值,这是由于南半球植被覆盖面积远小于北半球。
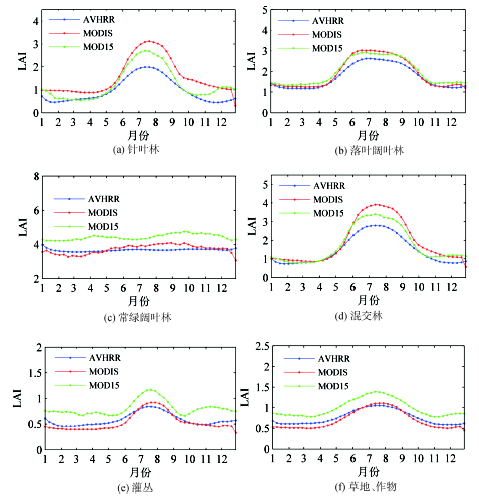
Fig. 3 AVHRR, MODIS and MOD15A2 8-day mean LAI series for various biomes, including coniferous, deciduous, tropical and mixed forests, shrubs, and grasses and crops

图3 不同生物群系类型AVHRR、MODIS及MOD15A2的8 d平均叶面积指数时间序列图

AVHRR和MODIS LAI的季节曲线与MOD15A2形状相似,特别是MODIS与MOD15A2的叶面积指数值差别基本在0.5以内(热带雨林差别达到0.5-1),但在绝对值上还存在一些差别。灌丛、草地和作物,MODIS LAI和AVHRR LAI吻合的更好;而森林类型,MODIS LAI和MOD15A2 LAI多大于AVHRR LAI,这可能是由于MODIS波段更窄,对于植被信号更为敏感,且数据集统计时段不一致。另外,MODIS LAI在常绿阔叶林区域的季节变化大于AVHRR和MOD15A2 LAI,这可能是由于热带区域雨季大量薄卷云未被检测出来的原因。MOD15A2 LAI与MODIS LAI在落叶阔叶林类型上吻合良好,在灌丛、草地、作物、常绿阔叶林类型中,MOD15A2 LAI略大于MODIS LAI,这是不同的反演算法及反演中采用的土地覆盖输入差别造成的。而在针叶林和混交林区域,MODIS LAI略大于MOD15A2 LAI,这可能是由于本算法采用了集聚指数,更好地考虑了针叶林显著的集聚效应。

3.4 不同植被类型统计

分别统计6种主要生物群系类型(包括针叶林、落叶阔叶林、常绿阔叶林、混交林、灌丛、草地和作物)AVHRR LAI(1983-1999年)、MODIS LAI(2001-2011年),以及MOD15A2 LAI(2001-2011年)的频率分布(生物群系类型归并方法同3.3节)。
图4为6种主要生物群系类型3个叶面积指数数据的频率直方图。3个数据的形状基本类似。对于针叶林、落叶阔叶林和混交林,MODIS LAI与MOD15A2 LAI分布较为接近,都比AVHRR LAI具有更多的高值。对于阔叶林,MODIS LAI和MOD15A2 LAI大于3的比例分别达到28.04%和27.5%,而AVHRR为20.83%。混交林LAI大于3的高值更多,MODIS LAI和MOD15A2 LAI的比例分别为32.57%和27.03%,而AVHRR则为16.08%。针叶林3个数据集的差别更大,MODIS LAI和MOD15A2 LAI大于3的比例分别达到21.89%和13.12%,而AVHRR仅为4.72%。3种森林类型MODIS LAI比MOD15A2都有更多大于3的高值,这可能是由于2个算法在考虑集聚效应方面的差别所致。整体来说,2种传感器反演结果差别大于同种传感器的反演结果,这可能是由2种传感器特性的差异及统计时段的差别引起的。对于灌丛、草地和作物,3种传感器的结果非常接近。对于灌丛,AVHRR LAI、MODIS LAI和MOD15A2 LAI小于1的比例分别为76.94%、76.98%和68.67%;而对于草地和作物,该比例分别为70.18%、72.1%和62.31%。总体来说,AVHRR LAI和MODIS LAI比MOD15A2 LAI具有更多的低值,这可能是由于稀疏植被的土壤效应造成的。常绿阔叶林3个数据集的差别较大,MOD15A2高值集中在6左右,高于AVHRR LAI(集中在4.5左右)和MODIS LAI(分布在2-6.5),这可能是由于MOD15A2算法中考虑了景观尺度的集聚效应,而GLOBCARBON LAI算法并未考虑[10,24]。而MODIS LAI则在2-6.5都有较多的像元分布,这是由于热带雨林大量薄卷云未能成功检出,造成反演值偏低。
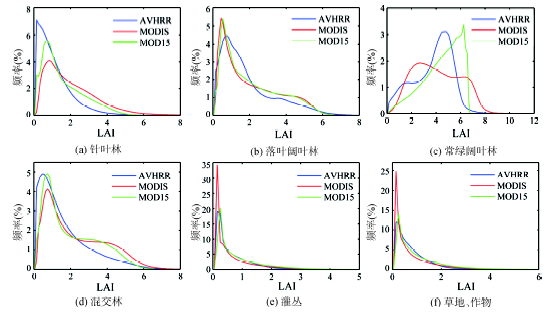
Fig. 4 AVHRR, MODIS and MOD15A2 LAI frequencies for various biomes, including coniferous, deciduous, tropical and mixed forests, shrubs, and grasses and crops

图4 不同植被类型AVHRR、MODIS及MOD15A2的LAI频率直方图

4 结论与讨论

本文利用高质量MODIS观测数据约束AVHRR历史观测的反演,采用重新处理后的LTDR AVHRR地表反射率数据,生成了1981-2012年全球叶面积指数数据。算法首先利用高质量MODIS地表反射率反演2000-2012年LAI,然后基于植被季节变化稳定的假设,利用每8 d AVHRR SR与MODIS LAI的平值拟合每个像元上二者的关系,建立像元级AVHRR SR-MODIS LAI关系。在此基础上,基于LTDR AVHRR 地表反射率实现1981-1999年AVHRR LAI反演。基于本算法反演的AVHRR和MODIS LAI与区域植被的空间分布特征吻合,可表征主要植被类型的季节变化状况,空间一致性较好,且与NASA MODIS LAI标准产品MOD15A2的空间分布和季节变化曲线吻合良好。
本算法会受到一些因素的影响,如土地覆盖及其变化和BRDF效应。由于不同植被类型的植被结构完全不同。土地覆盖分类是叶面积指数反演的关键输入[23]。本算法中,MODIS LAI的反演正是基于4尺度模型模拟和不同的植被类型的LAI与SR/RSR之间的关系,不同植被类型的关系存在差别。算法采用了MODIS的土地覆盖产品MDC12Q1 IGBP分类作为输入来区分不同的植被类型,用于反演MODIS LAI进而生成AVHRR SR-LAI关系。由于AVHRR LAI是基于MODIS LAI得到,因而MDC12Q1的精度会影响到本算法生成的整个叶面积指数产品的质量。
算法在建立像元级AVHRR SR-MODIS LAI关系时,假设反演期内每个像元的植被季节变化年际间稳定,这就要求植被覆盖类型的稳定。当这一时期内土地覆盖发生变化,SR-LAI关系也会随之变化,进而给AVHRR的反演带来不确定性。当植被被破坏时,植被系数导致SR值较低,这样原有的SR-LAI关系仍然适用。当森林转变为草地或农作物时,SR-LAI关系会发生改变,但是这种状况下SR也会大幅降低。反之,当不同森林类型之间发生转换,特别是当发生针叶林和阔叶林的变化,这种变化引起的不确定性将较大。
BRDF效应同样会影响AVHRR LAI的反演。AVHRR扫描具有55°,这会导致不同像元具有不同的太阳观测和卫星观测角度。另外,NOAA AVHRR系列卫星的过境时间每月会漂移1-2 min,长期积累甚至会达到4.5 h的差别,这都会导致观测的角度存在差异[25]。尽管LTDR对AVHRR观测进行了传感器衰退定标,但方向反射率数据并未做BRDF归一化。而由于AVHRR有限的角度采样和低数据质量,很难得到BRDF模型参数。本算法尽量降低BRDF效应的影响,一方面由于红和近红外波段的相关性,SR通过2个波段比值的方法可降低BRDF效应的影响[26];另一方面,由于SR-LAI关系是基于多年观测建立,每个像元不同太阳和观测角度的差别造成的BRDF效应会互相削弱。
算法有望今后在以下方面有所提高。AVHRR的BRDF效应和大气效应是影响其反演的重要因素,通过与其他传感器的融合有助于校正这2种效应的影响[27]。重合时期的MODIS高质量观测可为大气和BRDF参数反演提供约束条件。另外,AVHRR数据的进一步处理(如更为可靠的大气校正、定标、地理定位和角度校正)将获得更高质量的反射率数据,改进了叶面积指数的反演。另外,更准确的云检测和插值处理将有助于提高产品质量,特别是对生态系统模型模拟十分必要[23-24]。随着遥感技术的发展,越来越多的地表和植被物理和生物化学参数可由遥感数据中获得。将这些参数作为辐射传输模型输入,可提供每个像元上的约束,将有助于提高历史低质量数据的参数反演。

The authors have declared that no competing interests exist.

[1]
Chen J M, Black T A.Defining Leaf-Area Index for non-flat leaves[J]. Plant Cell and Environment, 1992,15(4):421-429.ABSTRACT To eliminate the confusion in the definition of leaf area index ( L ) for non-flat leaves, the projection coefficients of several objects including spheres, cylinders, hemicircular cylinders, and triangular and square bars are investigated through mathematical derivation and numerical calculation for a range of ellipsoidal angular distributions. It is shown that the projection coefficient calculated based on half the total intercepting area is close to a constant of 0.5 when the inclination angle of the objects is randomly (spherically) distributed, whereas the calculated results based on the object's largest projected area are strongly dependent on the shape of the objects. Therefore, it is suggested that the leaf area index of non-flat leaves be defined as half the total intercepting area per unit ground surface area and that the definition of L based on the projected leaf area be abandoned.

DOI

[2]
Myneni R B, Hoffman S, Knyazikhin Y, et al.Global products of vegetation leaf area and fraction absorbed PAR from year one of MODIS data[J]. Remote Sensing of Environment, 2002,83(1-2):14-231.An algorithm based on the physics of radiative transfer in vegetation canopies for the retrieval of vegetation green leaf area index (LAI) and fraction of absorbed photosynthetically active radiation (FPAR) from surface reflectances was developed and implemented for operational processing prior to the launch of the moderate resolution imaging spectroradiometer (MODIS) aboard the TERRA platform in December of 1999. The performance of the algorithm has been extensively tested in prototyping activities prior to operational production. Considerable attention was paid to characterizing the quality of the product and this information is available to the users as quality assessment (QA) accompanying the product. The MODIS LAI/FPAR product has been operationally produced from day one of science data processing from MODIS and is available free of charge to the users from the Earth Resources Observation System (EROS) Data Center Distributed Active Archive Center. Current and planned validation activities are aimed at evaluating the product at several field sites representative of the six structural biomes. Example results illustrating the physics and performance of the algorithm are presented together with initial QA and validation results. Potential users of the product are advised of the provisional nature of the product in view of changes to calibration, geolocation, cloud screening, atmospheric correction and ongoing validation activities.

DOI

[3]
GCOS.GCOS, Systematic observation requirements for satellite-based products for climate. WMO/TD No.1338. September 2006, 103. (available at ).

[4]
Masson V, Champeaux J L, Chauvin F, et al.A global database of land surface parameters at 1-km resolution in meteorological and climate models[J]. Journal of Climatology, 2003,16(9):1261-1282.Abstract Ecoclimap, a new complete surface parameter global dataset at a 1

DOI

[5]
Los S O, Collatz G J, Sellers P J, et al.A global 9-yr biophysical land surface dataset from NOAA AVHRR data[J]. Journal of Hydrometeorology, 2000,1(2):183-199.ABSTRACT

DOI

[6]
Baret F, Hagolle O, Geiger B, et al.LAI, fAPAR and fCover CYCLOPES global products derived from VEGETATION - Part 1: Principles of the algorithm[J]. Remote Sensing of Environment, 2007,110(3):275-286.ABSTRACT This article describes the algorithmic principles used to generate LAI, fAPAR and fCover estimates from VEGETATION observations. These biophysical variables are produced globally at 10 days temporal sampling interval under lat–lon projection at 1/112掳 spatial resolution. After a brief description of the VEGETATION sensors, radiometric calibration process, based on vicarious desertic targets is first presented. The cloud screening algorithm was then fine tuned using a global network of cloudiness observations. Atmospheric correction is then achieved using the SMAC code with inputs coming from meteorological values of pressure, ozone and water vapour. Aerosol optical thickness is derived from MODIS climatology assuming continental aerosol type. The Roujean BRDF model is then adjusted for red, near infrared and short wave infrared bands used to the remaining cloud free observations collected over a time window of 卤 15 days. Outliers due to possible cloud contamination or residual atmospheric correction are iteratively eliminated and prior information is used to get more robust estimates of the three BRDF kernel coefficients. Nadir viewing top of canopy reflectance in the three bands is input to the biophysical algorithm to compute the products at 10 days sampling interval. This algorithm is based on training neural networks over SAIL + PROPSPECT radiative transfer model simulations for each biophysical variable. Details on the way the training data base was generated and the neural network designed and calibrated are presented. Finally, theoretical performances are discussed. Validation over ground measurement data sets and inter-comparison with other similar biophysical products are presented and discussed in a companion paper. The CYCLOPES products and associated detailed documentation are available at http://postel.mediasfrance.org.

DOI

[7]
Deng F, Chen J M, Plummer S, et al.Algorithm for global leaf area index retrieval using satellite imagery[J]. IEEE Transactions on Geoscience and Remote Sensing, 2006,44(8):2219-2229.Leaf area index (LAI) is one of the most important Earth surface parameters in modeling ecosystems and their interaction with climate. Based on a geometrical optical model (Four-Scale) and LAI algorithms previously derived for Canada-wide applications, this paper presents a new algorithm f

DOI

[8]
Chen J M, Pavlic G, Brown L, et al.Derivation and validation of Canada-wide coarse-resolution leaf area index maps using high-resolution satellite imagery and ground measurements[J]. Remote Sensing of Environment, 2002,80(1):165-184.Leaf area index (LAI) is one of the surface parameters that has importance in climate, weather, and ecological studies, and has been routinely estimated from remote sensing measurements. Canada-wide LAI maps are now being produced using cloud-free Advanced Very High-Resolution Radiometer (AVHRR) imagery every 10 days at 1-km resolution. The archive of these products began in 1993. LAI maps at the same resolution are also being produced with images from the SPOT VEGETATION sensor. To improve the LAI algorithms and validate these products, a group of Canadian scientists acquired LAI measurements during the summer of 1998 in deciduous, conifer, and mixed forests, and in cropland. Common measurement standards using the commercial Tracing Radiation and Architecture of Canopies (TRAC) and LAI-2000 instruments were followed. Eight Landsat Thematic Mapper (TM) scenes at 30-m resolution were used to locate ground sites and to facilitate spatial scaling to 1-km pixels. In this paper, examples of Canada-wide LAI maps are presented after an assessment of their accuracy using ground measurements and the eight Landsat scenes. Methodologies for scaling from high- to coarse-resolution images that consider surface heterogeneity in terms of mixed cover types are evaluated and discussed. Using Landsat LAI images as the standard, it is shown that the accuracy of LAI values of individual AVHRR and VEGETATION pixels was in the range of 50鈥75%. Random and bias errors were both considerable. Bias was mostly caused by uncertainties in atmospheric correction of the Landsat images, but surface heterogeneity in terms of mixed cover types were also found to cause bias in AVHRR and SPOT VEGETATION LAI calculations. Random errors come from many sources, but pixels with mixed cover types are the main cause of random errors. As radiative signals from different vegetation types were quite different at the same LAI, accurate information about subpixel mixture of the various cover types is identified as the key to improving the accuracy of LAI estimates.

DOI

[9]
Bacour C, Baret F, Beal D, et al.Neural network estimation of LAI, fAPAR, fCover and LAIxC(ab), from top of canopy MERIS reflectance data: Principles and validation[J]. Remote Sensing of Environment, 2006,105(4):313-325.A neural network is developed to operationally estimate biophysical variables over land surfaces from the observations of the ENVISAT-MERIS instrument: the leaf area index (), the fraction of absorbed photosynthetically active radiation (), the fraction of vegetation cover (), and the canopy chlorophyll content (脳). The neural network requires as input the geometry of observation and the top of canopy reflectances, corrected from the atmospheric effects, in eleven spectral bands. It is trained on a reflectance database made of radiative transfer model simulations. The principles underlying the generation of the database and the design of the network are first presented. The estimated variables are then compared to other existing products, - and -MODIS and -MERIS, and validated against ground measurements performed i

DOI

[10]
Diner D J, Martonchik J V, Borel C, et al.MISR Level 2 Surface Retrieval Algorithm Theoretical Basis[R]. Pasadena, California: Jet Propulsion Laboratory, California Institute of Technology, 2008.

[11]
Zhao M, Running S W.Drought-induced reduction in global terrestrial vet primary production from 2000 through 2009[J]. Science, 2010,329(5994):940-943.Terrestrial net primary production (NPP) quantifies the amount of atmospheric carbon fixed by plants and accumulated as biomass. Previous studies have shown that climate constraints were relaxing with increasing temperature and solar radiation, allowing an upward trend in NPP from 1982 through 1999. The past decade (2000 to 2009) has been the warmest since instrumental measurements began, which could imply continued increases in NPP; however, our estimates suggest a reduction in the global NPP of 0.55 petagrams of carbon. Large-scale droughts have reduced regional NPP, and a drying trend in the Southern Hemisphere has decreased NPP in that area, counteracting the increased NPP over the Northern Hemisphere. A continued decline in NPP would not only weaken the terrestrial carbon sink, but it would also intensify future competition between food demand and proposed biofuel production.

DOI PMID

[12]
Leuning R, Zhang Y Q, Rajaud A, et al.A simple surface conductance model to estimate regional evaporation using MODIS leaf area index and the Penman-Monteith equation[J]. Water Resources Research, 2008,44(10):1-17.1] We introduce a simple biophysical model for surface conductance, G s , for use with remotely sensed leaf area index ( L ai ) data and the Penman-Monteith (PM) equation to calculate daily average evaporation, E , at kilometer spatial resolution. The model for G s has six parameters that represent canopy physiological processes and soil evaporation: g sx , maximum stomatal conductance; Q 50 and D 50 , the values of solar radiation and atmospheric humidity deficit when the stomatal conductance is half its maximum; k Q and k A , extinction coefficients for visible radiation and available energy; and f , the ratio of soil evaporation to the equilibrium rate corresponding to the energy absorbed at the soil surface. Model parameters were estimated using 2鈥3 years of data from 15 flux station sites covering a wide range of climate and vegetation types globally. The PM estimates of E are best when all six parameters in the G s model are optimized at each site, but there is no significant reduction in model performance when Q 50 , D 50 , k Q , and k A are held constant across sites and g sx and f are optimized (linear regression of modeled mean daily evaporation versus measurements: slope = 0.83, intercept = 0.22 mm/d, R 2 = 0.80, and N = 10623). The average systematic root-mean-square error in daytime mean evaporation was 0.27 mm/d (range 0.09鈥0.50 mm/d) for the 15 sites. The average unsystematic component was 0.48 mm/d (range 0.28鈥0.71 mm/d). The new model for G s with two parameters yields better estimates of E than an earlier, simple model G s = c L L ai , where c L is an optimized parameter. Our study confirms that the PM equation provides reliable estimates of evaporation rates from land surfaces at daily time scales and kilometer space scales when remotely sensed leaf area indices are incorporated into a simple biophysical model for surface conductance. Developing remote sensing techniques to measure the temporal and spatial variation in f is expected to enhance the utility of the model proposed in this paper.

DOI

[13]
Ganguly S, Schull M A, Samanta A, et al.Generating vegetation leaf area index earth system data record from multiple sensors. Part 1: Theory[J]. Remote Sensing of Environment, 2008,112(12):333-4343.The generation of multi-decade long Earth System Data Records (ESDRs) of Leaf Area Index (LAI) and Fraction of Photosynthetically Active Radiation absorbed by vegetation (FPAR) from remote sensing measurements of multiple sensors is key to monitoring long-term changes in vegetation due to natural and anthropogenic influences. Challenges in developing such ESDRs include problems in remote sensing science (modeling of variability in global vegetation, scaling, atmospheric correction) and sensor hardware (differences in spatial resolution, spectral bands, calibration, and information content). In this paper, we develop a physically based approach for deriving LAI and FPAR products from the Advanced Very High Resolution Radiometer (AVHRR) data that are of comparable quality to the Moderate resolution Imaging Spectroradiometer (MODIS) LAI and FPAR products, thus realizing the objective of producing a long (multi-decadal) time series of these products. The approach is based on the radiative transfer theory of canopy spectral invariants which facilitates parameterization of the canopy spectral bidirectional reflectance factor (BRF). The methodology permits decoupling of the structural and radiometric components and obeys the energy conservation law. The approach is applicable to any optical sensor, however, it requires selection of sensor-specific values of configurable parameters, namely, the single scattering albedo and data uncertainty. According to the theory of spectral invariants, the single scattering albedo is a function of the spatial scale, and thus, accounts for the variation in BRF with sensor spatial resolution. Likewise, the single scattering albedo accounts for the variation in spectral BRF with sensor bandwidths. The second adjustable parameter is data uncertainty, which accounts for varying information content of the remote sensing measurements, i.e., Normalized Difference Vegetation Index (NDVI, low information content), vs. spectral BRF (higher information content). Implementation of this approach indicates good consistency in LAI values retrieved from NDVI (AVHRR-mode) and spectral BRF (MODIS-mode). Specific details of the implementation and evaluation of the derived products are detailed in the second part of this two-paper series.

DOI

[14]
Liu Y, Liu R G, Chen J M.Retrospective retrieval of long-term consistent global leaf area index (1981-2011) from combined AVHRR and MODIS data[J]. Journal of Geophysical Research-Biogeosciences, 2012,117(G04003):1-14.

[15]
Pedelty J, Devadiga S, Masuoka E, et al.Generating a long-term land data record from the AVHRR and MODIS instrument[C]. IGARRS '07, Barcelona, Spain, 2007:23-27.

[16]
Vermote E F, Kaufman Y J.Absolute calibration of AVHRR visible and near-infrared channels using ocean and cloud views[J]. International Journal of Remote Sensing, 1995,16(13):2317-2340.1995, in preparation indicates that this shift is due to an out of band transmission ( 6 per cent at 900nm) for AVHRR channel 1 previously unidentified.

DOI

[17]
He L, Chen J M, Pisek J, et al.Global clumping index map derived from the MODIS BRDF product[J]. Remote Sensing of Environment, 2012,119:118-130.ABSTRACT In this study, we show for the first time a global Clumping Index (CI) map at 500 m resolution derived using the Bidirectional Reflectance Di

DOI

[18]
Liu R G, Chen J M, Liu J, et al.Application of a new leaf area index algorithm to China's landmass using MODIS data for carbon cycle research[J]. Journal of Environmental Management, 2007,85(3):649-658.lt;h2 class="secHeading" id="section_abstract">Abstract</h2><p id="">An operational system was developed for mapping the leaf area index (LAI) for carbon cycle models from the moderate resolution imaging spectroradiometer (MODIS) data. The LAI retrieval algorithm is based on Deng et al. [2006. Algorithm for global leaf area index retrieval using satellite imagery. IEEE Transactions on Geoscience and Remote Sensing, 44, 2219&ndash;2229], which uses the 4-scale radiative transfer model [Chen, J.M., Leblancs, 1997. A 4-scale bidirectional reflection model based on canopy architecture. IEEE Transactions on Geoscience and Remote Sensing, 35, 1316&ndash;1337] to simulate the relationship of LAI with vegetated surface reflectance measured from space for various spectral bands and solar and view angles. This algorithm has been integrated to the MODISoft<sup>&reg;</sup> platform, a software system designed for processing MODIS data, to generate 250&#xA0;m, 500&#xA0;m and 1&#xA0;km resolution LAI products covering all of China from MODIS MOD02 or MOD09 products. The multi-temporal interpolation method was implemented to remove the residual cloud and other noise in the final LAI product so that it can be directly used in carbon models without further processing. The retrieval uncertainties from land cover data were evaluated using five different data sets available in China. The results showed that mean LAI discrepancies can reach 27%. The current product was also compared with the NASA MODIS MOD15 LAI product to determine the agreement and disagreement of two different product series. LAI values in the MODIS product were found to be 21% larger than those in the new product. These LAI products were compared against ground TRAC measurements in forests in Qilian Mountain and Changbaishan. On average, the new LAI product agrees with the field measurement in Changbaishan within 2%, but the MODIS product is positively biased by about 20%. In Qilian Mountain, where forests are sparse, the new product is lower than field measurements by about 38%, while the MODIS product is larger by about 65%.</p>

DOI PMID

[19]
Knyazikhin Y, Martonchik J V, Myneni R B, et al.Synergistic algorithm for estimating vegetation canopy leaf area index and fraction of absorbed photosynthetically active radiation from MODIS and MISR data[J]. Journal of Geophysical Research-Atmosphere, 1998,103(D24):32257-32275.A synergistic algorithm for producing global leaf area index and fraction of absorbed photosynthetically active radiation fields from canopy reflectance data measured by MODIS (moderate resolution imaging spectroradiometer) and MISR (multiangle imaging spectroradiometer) instruments aboard the EOS-AM 1 platform is described here. The proposed algorithm is based on a three-dimensional formulation of the radiative transfer process in vegetation canopies. It allows the use of information provided by MODIS (single angle and up to 7 shortwave spectral bands) and MISR (nine angles and four shortwave spectral bands) instruments within one algorithm. By accounting features specific to the problem of radiative transfer in plant canopies, powerful techniques developed in reactor theory and atmospheric physics are adapted to split a complicated three-dimensional radiative transfer problem into two independent, simpler subproblems, the solutions of which are stored in the form of a look-up table. The theoretical background required for the design of the synergistic algorithm is discussed.

DOI

[20]
Tucker C J, Pinzon J E, Brown M E, et al.An extended AVHRR 8-km NDVI dataset compatible with MODIS and SPOT vegetation NDVI data[J]. International Journal of Remote Sensing, 2005,26(20):4485-4498.Daily daytime Advanced Very High Resolution Radiometer (AVHRR) 4‐km global area coverage data have been processed to produce a Normalized Difference Vegetation Index (NDVI) 8‐km equal‐area dataset from July 1981 through December 2004 for all continents except Antarctica. New features of this dataset include bimonthly composites, NOAA‐9 descending node data from August 1994 to January 1995, volcanic stratospheric aerosol correction for 1982–1984 and 1991–1993, NDVI normalization using empirical mode decomposition/reconstruction to minimize varying solar zenith angle effects introduced by orbital drift, inclusion of data from NOAA‐16 for 2000–2003 and NOAA‐17 for 2003–2004, and a similar dynamic range with the MODIS NDVI. Two NDVI compositing intervals have been produced: a bimonthly global dataset and a 10‐day Africa‐only dataset. Post‐processing review corrected the majority of dropped scan lines, navigation errors, data drop outs, edge‐of‐orbit composite discontinuities, and other artefacts in the composite NDVI data. All data are available from the University of Maryland Global Land Cover Facility ( http://glcf.umiacs.umd.edu/data/gimms/ ).

DOI

[21]
Chen J M.Evaluation of vegetation indices and a modified simple ratio for boreal applications[J]. Canadian Journal of Remote Sensing, 1996,22:229-242.Jing M. Chen is with the Canada Centre for Remote Sensing, #419–588 Booth Street, Ottawa, Ontario K1A OY7.

DOI

[22]
Los S O, North P R J, Grey W M F, et al. A method to convert AVHRR Normalized Difference Vegetation Index time series to a standard viewing and illumination geometry[J]. Remote Sensing of Environment, 2005,99:400-411.The bi-directional reflectance distribution function (BRDF) alters the seasonal and inter-annual variations exhibited in Advanced Very High Resolution Radiometer (AVHRR) Normalized Difference Vegetation Index (NDVI) data and this hampers the detection and, consequently, the interpretation of temporal variations in land-surface vegetation. The magnitude and sign of bi-directional effects in commonly used AVHRR data sets depend on land-surface properties, atmospheric composition and the type of atmospheric correction that is applied to the data. We develop an approach to estimate BRDF effects in AVHRR NDVI time series using the Moderate Resolution Imaging Spectrometer (MODIS) BRDF kernels and subsequently adjust NDVI time series to a standard illumination and viewing geometry. The approach is tested on NDVI time series that are simulated for representative AVHRR viewing and illumination geometry. These time series are simulated with a canopy radiative transfer model coupled to an atmospheric radiative transfer model for four different land cover types&mdash;tropical forest, boreal forest, temperate forest and grassland &ndash; and five different atmospheric conditions &ndash; turbid and clear top-of-atmosphere, turbid and clear top-of-atmosphere with a correction for ozone absorption and Rayleigh scattering applied (Pathfinder AVHRR Land data) and ground-observations (fully corrected for atmospheric effects). The simulations indicate that the timing of key phenological stages, such as start and end of growing season and time of maximum greenness, is affected by BRDF effects. Moreover, BRDF effects vary with latitude and season and increase over the time of operation of subsequent NOAA satellites because of orbital drift. Application of the MODIS kernels on simulated NVDI data results in a 50% to 85% reduction of BRDF effects. When applied to the global 18-year global Normalized Difference Vegetation Index (NDVI) Pathfinder data we find BRDF effects similar in magnitude to those in the simulations. Our analysis of the global data shows that BRDF effects are especially large in high latitudes; here we find that in at least 20% of the data BRDF errors are t

DOI

[23]
Liu R G, Liu Y.Generation of new cloud masks from MODIS land surface reflectance products[J]. Remote Sensing of Environment, 2013,133:21-37.MODIS land surface reflectance product (MOD09) is one of the most popular data sources for characterizing land surface environments. Because those cloudy observations should be excluded from further analysis, the reliable cloud screening is important for downstream applications. In this paper, an approach is proposed to generate cloud masks from time series of MOD09 products. It is found that an inflexion point exists between the clear-sky and cloudy observations if time series of reflectances assembled from the same location are sorted. The maximum surface reflectance can be composited from these inflexions and those observations with reflectance values larger than the inflexion are identified as cloudy. To the best of our knowledge, this is the first method to composite the maximum snow-free surface reflectance. And a new method is proposed to objectively compare cloud detection results derived from different approaches. Comparisons show that this inflexion-based cloud detection algorithm performs generally better than the cloud masks accompanying with the MOD09 products. The new cloud masks are valuable for those applications relying on the MOD09 products as input and for analysis of the uncertainty of the MODIS cloud mask products. (c) 2013 Elsevier Inc. All rights reserved.

DOI

[24]
Lu X L, Liu R G, Liu J Y, et al.Removal of noise by wavelet method to generate high quality temporal data of terrestrial MODIS products[J]. Photogrammetric Engineering & Remote Sensing, 2007,73(10):1129-1140.Time-series terrestrial parameters derived from NOAA/AVHRR, SPOT/VEGETATION, TERRA, or AQUA/MODIS data, such as Normalized Difference Vegetation Index (NDVI), Leaf Index Area (LAI), and Albedo, have been extensively applied to global climate change. However, the noise impedes these data from being further analyzed and used. In this paper, a wavelet-based method is used to remove the contaminated data from time-series observations, which can effectively maintain the temporal pattern and approximate the “true” signals. The method is composed of two steps: (a), timeseries values are linearly interpolated with the help of quality flags and the blue band, and (b), time series are decomposed into different scales and the highest correlation among several adjacent scales is used, which

DOI

文章导航

/