全球卫星气候遥感数据

中国北部地区卫星积雪产品数据集检验

  • 曹冬杰 ,
  • 郑照军 , * ,
  • 唐世浩 ,
  • 王园香
展开
  • 1. 中国气象局中国遥感卫星辐射测量和定标重点开放实验室,北京 100081; 2. 国家卫星气象中心,北京 100081
*通讯作者:郑照军(1976-),男,副研究员,研究方向为冰雪遥感与应用。E-mail:

作者简介:曹冬杰(1980-),男,河北石家庄人,博士,助理研究员,研究方向为卫星遥感产品应用与数据分析。E-mail:

收稿日期: 2015-03-16

  要求修回日期: 2015-09-10

  网络出版日期: 2015-11-10

基金资助

公益性行业(气象)科研专项“卫星遥感全球下垫面类型数据集研制“(GYHY201106014)资助

公益性行业(气象)科研专项“青藏高原遥感积雪气候数据集建设”(GYHY201206040)

新疆维吾尔族自治区科技支疆项目“北疆雪水资源遥感监测分析服务平台建设”(2013911104)

Validation of AVHRR, IMS and MODIS Snow Cover Products in North of China

  • CAO Dongjie ,
  • ZHENG Zhaojun , * ,
  • TANG Shihao ,
  • WANG Yuanxiang
Expand
  • 1. Key Laboratory of Radiometric Calibration and Validation for Environmental Satellites, China Meteorological Administration (LRCVES/CMA), National Satellite Meteorological Center, Beijing 100081, China;2. National Satellite Meteorological Center, Beijing 100081, China;
  • 1. Key Laboratory of Radiometric Calibration and Validation for Environmental Satellites, China Meteorological Administration (LRCVES/CMA), National Satellite Meteorological Center, Beijing 100081, China; 2. National Satellite Meteorological Center, Beijing 100081, China;
*Corresponding author: ZHENG Zhaojun, E-mail:

Received date: 2015-03-16

  Request revised date: 2015-09-10

  Online published: 2015-11-10

Copyright

《地球信息科学学报》编辑部 所有

摘要

同其他卫星相比,NOAA卫星搭载的AVHRR积雪产品,具有长达10 a的长时间序列数据集,能够应用于长时间、较大区域范围的积雪覆盖变化分析。由于不同卫星使用的反演算法,波谱宽度和大气订正等不完全相同,故需对不同卫星积雪产品数据集进行一致性检验,将卫星积雪产品更好地应用于气候分析研究。本文采用一种新的评估方法,对空间分辨率为0.05o×0.05o的AVHRR积雪产品与IMS和MOD10A1积雪产品,分别在空间和时间变化上进行对比分析,对AVHRR积雪产品数据集进行检验,发现AVHRR与MODIS积雪产品具有较好的一致性。

本文引用格式

曹冬杰 , 郑照军 , 唐世浩 , 王园香 . 中国北部地区卫星积雪产品数据集检验[J]. 地球信息科学学报, 2015 , 17(11) : 1341 -1347 . DOI: 10.3724/SP.J.1047.2015.01341

Abstract

Comparing with other satellite sensors, AVHRR has the capability to analyze more than 10 years of medium-resolution satellite imagery on a daily basis. AVHRR thereby holds a great potential to detect, map and quantify long-term environmental changes. However, different satellites use different retrieval algorithms, wavelength bandwidths and atmospheric validations. So it is important to compare different snow cover products retrieved by different satellites. Here, we describe and extensively validate the snow cover products of the historical 0.05°×0.05° AVHRR data. The spatial and seasonal validation includes a comparison with IMS and MOD10A1. It is found that the AVHRR snow products are in good accordance with the MODIS snow products. The influence of acquisition geometry and the sensor-to-sensor consistency will be discussed in future.

1 引言

积雪分布由于受地形条件、风场条件、陆表土地覆盖类型和积雪由于增长与消融等多种因素的影响,雪盖变化较为复杂。其与气候和环境变化密切相关,所以,建立高质量的积雪产品数据集对于气候和环境变化研究非常重要。卫星遥感监测积雪是全球雪盖变化研究的重要手段,与地基观测相比,极轨卫星的优势在于观测范围较大,但观测时间较短,不能针对特定区域进行长时间连续观测。极轨卫星观测周期较长,因此在长时间序列数据集积累方面具有优势。与静止卫星相比,极轨卫星的优势在于其观测视角高(特别是高纬地区),具有较高的空间分辨率,且观测范围大,可实现全球范围的观测。目前,积雪产品数据集已广泛应用于全 球积雪覆盖分布特征的研究[1-5],以及对气候模式的改进。
AVHRR(Advanced Very High Resolution Radiometer)积雪数据集能用于分析连续25 a的全球雪盖变化,其星下点分辨率为1 km,利用该数据集对雪盖的观测研究,以及积雪产品反演算法的改进取得了一系列成果[6-10]。由于不同卫星采用的反演方法不完全相同,反演产品精度存在一定的差别,对不同卫星积雪产品数据集进行检验,对更好地应用产品非常重要。Siljamo提出了一种较为有效的验证方法[10],通过列联表的方法,将运用新算法获得的LSA SAF积雪产品与NOAA卫星和IMS积雪产品进行比较,证明在无云区应用新算法获得的LSA SAF积雪产品精度高于IMS积雪产品。Husler[11]利用MOD10A1和webcam图像对AVHRR积雪产品中的空间和季节分布进行了验证,并利用LANDSAT TM和站点观测数据,对观测地形和传感器一致性,对积雪产品精度的影响进行了讨论。
国内也做了很多积雪产品数据比较的相关分析[12-14],主要对北疆地区的MODIS积雪产品的准确性进行评估,发现MODIS识别精度优于VGT-S10积雪产品,VGT-S10积雪产品受云的影响最小。
本文根据 Siljamo[4]和Husler[11]提出的利用评价指标验证积雪产品的分析方法,分别以MODIS和IMS积雪产品为基准,对反演的中国北部地区AVHRR积雪产品进行检验,分析影响AVHRR积雪产品精度的因素。

2 数据分析方法

表1为2×2列联表(以列表方式将2个或多个属性变量的不同取值置于行和列的位置),其中,a表示2种产品均检测到雪盖的像元数,b表示仅被检验产品检测到积雪(虚报)的像元数,c表示仅基准产品检测到积雪(漏报)的像元数,d表示2种产品均检测无积雪的像元数。首先,分别以MODIS和IMS积雪产品为基准,将中国北部地区AVHRR积雪产品与这2种卫星进行比较;然后,以IMS积雪产品为基准,对MODIS积雪产品与IMS积雪产品进行比较。为便于比较,本文将IMS、MODIS和AVHRR 3种积雪产品的分辨率进行降尺度处理,获得0.5°×0.5°分辨率的积雪产品。Stevenson[15]介绍了该数据产品的基本比较方法,Storch[16]和Wilks[17]对此方法进行了延伸和拓展。积雪产品数据集一致性检验主要采用3类指标:准确度(Accuracy, ACC)、Heidke技巧评分(Heidke Skill Score, HSS)和偏差评分(Bias Score,BIAS)。
Tab. 1 Contingency table showing the comparison between two snow cover products analyses, in which a-d represent the different number of pixels observed to occur in each type

表1 积雪产品比较列联表

基准产品
有雪 无雪
AVHRR
积雪产品
有雪 a (相同) b (虚报)
无雪 c (漏报) d (不同)
ACC定义为2种产品一致的像元数除以总像元数(用于分析的像元总数),ACC的计算表达式如式(1)所示。ACC值为1或0,分别表示2种产品完全一致或完全不一致。
ACC = a + d a + b + c + d (1)
HSS计算表达式如式(2)所示,HSS的范围为 -∞-1。当出现夏季积雪消融这种情况时,2种产品均不能检测到积雪,会导致d值远大于a、b和c的值。HSS值一般保持在0-1之间。若HSS值过低,则说明该时间段分析的区域肯定没有积雪。当被检验产品的正确度与期望的正确度相同时,HSS为零。当被检验产品的正确度低于期望的正确度时,HSS为负值。当HSS=1时,2种产品完全一致。
HSS = 2 ( ad - bc ) a + c c + d + a + b b + d (2)
BIAS定义为被检验产品探测到积雪的像元数与基准产品探测到积雪的像元数之间的比值,可表示被检验产品对积雪的过低估计(BIAS值小于1)和过高估计(BIAS值大于1),该值等于1说明无偏差。公式表达如式(3)所示。
BIAS = a + b a + c (3)
积雪探测正确率(Hit Rate,H)或发现概率(Probability of Detection,POD)如式(4)所示。H值为1,表示2种产品检测的积雪完全相符。
H = a a + c (4)
虚警率(False Alarm Ratio,FAR)如式(5)。
FAR = b a + b (5)
对IMS和AVHRR(AI),IMS和MODIS(MI),以及AVHRR和MODIS(AM)积雪产品分别进行比较,图1(a)为选择的2005-2008年中国北部地区分别对应于陆表无云和雪盖情况的像元数分布,时间尺度为3个冬季和4个夏季。图中绿色虚线、蓝色圆和橙色圆分别对应于IMS、AVHRR和MODIS陆表无云情况的像元数。图中绿色实线、蓝色实线和橙色实线分别对应于IMS,AVHRR和MODIS检测到雪盖的像元数。由图1可看出,一年的积雪覆盖最大值出现在1月,3月中旬开始至4月底,积雪逐渐融化,剩余的主要分布在山顶和冰川上。无云陆表区域的变化主要与云对观测的影响和不同季节天顶角的大小有关(如冬季天顶角太高而不能在北部地区进行全天候观测)。图1(b)-(f)为3类卫星积雪产品的比较结果。图1(b)中,BIAS值普遍小于1,说明分析区域AVHRR探测到的实际积雪区低于IMS。图1(c)中FAR在冬季表现为低值,说明与IMS相比,AVHRR对积雪过低估计,该值在春季随着积雪的融化而增大,夏季该值约为1。FAR值为1的情况对应的BIAS值均大于1,这说明尽管有一定量的积雪,但可能分布在不同的地区。图1(d)中AVHRR平均探测到IMS探测的约10%的积雪(H=0.1),其变化并不如FAR那么明显。图1(e)中ACC值的变化,说明MODIS和AVHRR,以及IMS和MODIS的比较结果基本一致,冬季AI的ACC值较低,表明二者在探测是否有积雪时的一致性较低。如图1(f)所示,由HSS和H值来看,冬季的IMS和AVHRR,IMS和MODIS相差不大,但是随着夏季积雪融化,HSS和H值逐渐减小,反映了夏季没有积雪的客观情况。HSS和H的变化情况相似,但夏季HSS值略低,特别是2006年。IMS验证AVHRR得到的HSS低于IMS验证MODIS,但是当积雪开始融化后,二者的差距变得不明显。
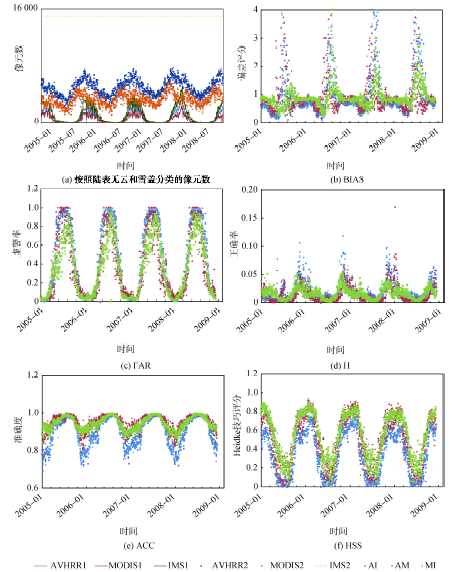
Fig. 1 Comparison between AVHRR and IMS(AI) snow products,IMS and MODIS(MI)snow cover products,AVHRR and MODIS(AM) snow products on the north of China during 2005 to 2008

图1 2005-2008年中国北部地区IMS和AVHRR(AI),IMS和MODIS(MI),AVHRR和MODIS(AM)积雪产品比较

3 卫星积雪产品数据集检验结果与分析

3.1 积雪产品时间分布检验

分别以IMS和MODIS积雪产品为基准产品,对中国北部地区的积雪产品进行比较验证。产品验证结果如图2-5所示。图2为2005年1月至2008年12月ACC,HSS和BIAS月均值的变化情况,从图中ACC和HSS的标准偏差可看出,BIAS值在冬季较低,夏季较高,7-9月明显增大。
以IMS验证AVHRR的结果为例(图2(a)-(c)),ACC月均值基本保持在0.8以上,5-10月的ACC月均值大于0.9,5-9月的标准偏差值较小。根据冬季的ACC值可对积雪产品很好的验证分析,但夏季积雪总数较低,仅根据ACC值不能给出准确的分析。如图2(d)-(f)所示,夏季BIAS值有明显的增加,说明AVHRR过高估计了可能存在的积雪量。如图2(g)-(i)所示,HSS在2-3月较高,夏季随着积雪的融化,HSS值降低,7-8月HSS值降至最低值,标准偏差较小。
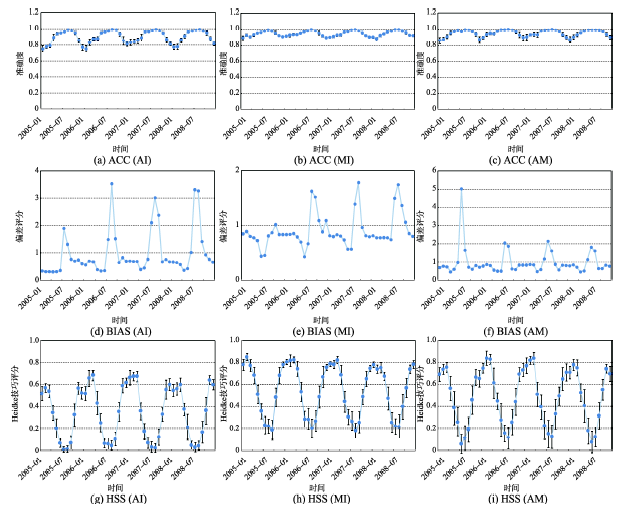
Fig. 2 The monthly averaged evaluation configurations of snow cover product

图2 积雪产品评价指标的月均值变化

3.2 积雪产品空间分布检验

图3所示为以IMS检验AVHRR积雪产品得到的2007年11月至2008年4月中国北部地区ACC、HSS和BIAS值的空间分布图,空间分辨率为0.05o×0.05o。由图3(d)可知,单个像元选择的最大样本数约为168。图3(a)给出的ACC值在华北大部分地区以及东北地区西部较高(0.9-1.0),而在东北地区东部表现为低值(0.0-0.1),该差异可能与分析区域的海拔高度和地表覆盖类型有关。当检测和被检测产品均检测到积雪或均未检测到积雪时,HSS值为零,如图3(b)所示,除东北地区西部外,中国北部大部分地区积雪产品一致性较低。如图3(c)所示,依据BIAS值,东北地区西部产品一致性较高,基本不存在明显的高估或低估情况。HSS和BIAS值是对ACC评价结果较好的补充和说明。
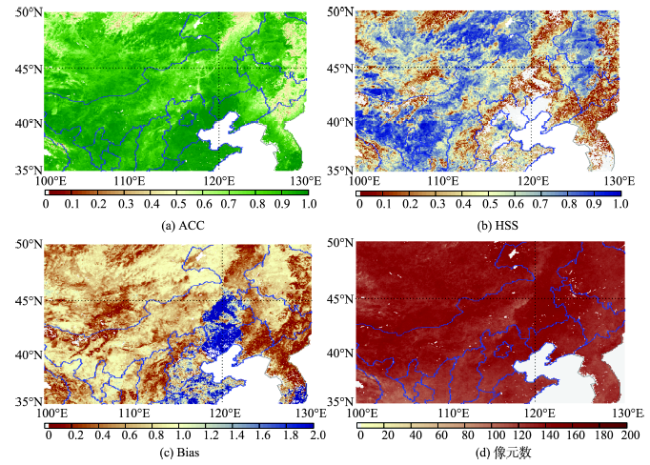
Fig. 3 Comparison between the AVHRR and IMS snow cover products from November 2007 to April 2008

图3 2007年11月至2008年4月AVHRR和IMS积雪产品对比分析图

以MODIS检验AVHRR积雪产品(图4)。图4(d)中单个像元选择的最大样本数为163。图4(a)给出大部分地区的ACC值完全一致(约为1.0)。由图4(b)和(c)也可看出,除内蒙与东北地区交界处,其他分析区域HSS值和BIAS值均为1,AVHRR和MODIS积雪产品具有很好的一致性,2类产品对于积雪的反演基本相同。由于MODIS积雪产品具有较高的空间分辨率和较高的反演精度,可较好地作为评估数据集产品的评价标准,因此,对比分析结果从另一方面证明了反演的AVHRR积雪产品具有较高的精度,能应用于积雪分布特征的研究。
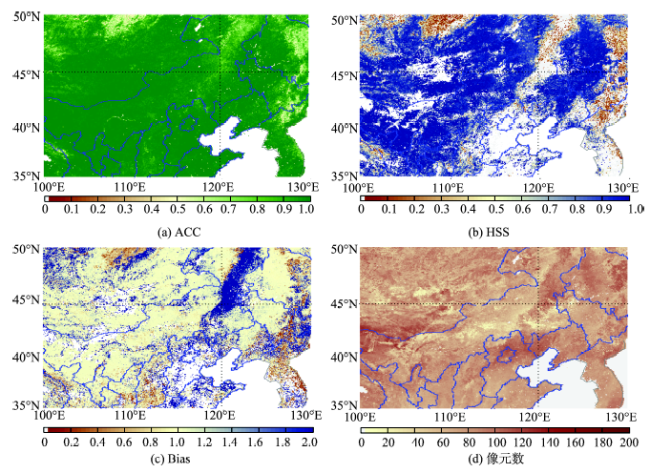
Fig. 4 Comparison between the AVHRR and MODISsnow cover products from November 2007 to April 2008

图4 2007年11月至2008年4月AVHRR和MODIS积雪产品对比分析图

4 结论与讨论

积雪分布随季节的变化能从侧面反映气候变化特征。
本文分别从时间和空间上将AVHRR积雪产品与MODIS积雪产品进行了对比分析。选择中国北部地区,利用不同或不相关的数据集,对AVHRR积雪产品进行检验对比, 表明MODIS积雪产品具有较高的空间分辨率,可作为评价标准对数据集产品进行评估:
(1)AVHRR、IMS和MODIS积雪产品在不同程度上反映了中国北部地区的雪盖分布随季节的明显变化,11月大部分积雪开始形成,雪盖峰值通常出现在1-2月,3月中下旬开始直到5月,积雪逐渐融化,但海拔高度较高的山顶和冰川常年有未融化的积雪。
(2)以IMS检验AVHRR的逐日分析发现,冬季ACC值均较低,表明二者在探测是否有积雪时的一致性较低。联合HSS和H值来看,随着夏季积雪融化,HSS和H值逐渐减小。 根据BIAS值普遍小于1,判断AVHRR检测到的积雪低于IMS。HSS与H的变化相似,但夏季HSS值略低。
以IMS检验AVHRR的逐月对比分析发现,5-10月的ACC月均值保持在0.9以上,5-9月的标准偏差值较小。夏季BIAS值有明显的增加,说明AVHRR积雪产品过高估计了可能存在的积雪量。HSS值在2-3月较高,夏季随着积雪的融化,HSS值降低。
冬季的ACC值能为积雪产品检验提供较为可靠的参考,而夏季由于积雪量较低,ACC值不具备可信度。HSS和BIAS值可对ACC评价结果进行很好的辅助分析。
(3)利用2007年11月至2008年4月的3种积雪产品,从空间分布上,以中国北部地区的IMS和MODIS积雪产品检验AVHRR积雪产品。基于ACC、HSS和BIAS等评价指标分析发现,IMS和AVHRR积雪产品在分析的大部分地区一致性较差,而AVHRR与MODIS积雪产品具有较好的一致性。其中,HSS和BIAS值较好地的体现了产品相关性较差的区域分布。不同卫星积雪产品的反演算法不同,观测精度受观测区域的海拔高度和地表覆盖类型等参数影响,ACC值的分布与分析区域的海拔高度和地表覆盖类型密切相关。AVHRR积雪产品反演算法,具有一定的准确性和稳定性,积雪产品数据集可应用于青藏高原地区的气候变化和环境变化的研究。
与IMS资料相比,AVHRR和MODIS资料由于受云层影响,观测到的积雪覆盖区域面积相对较小,不同积雪产品在积雪分布集中区差别较大,这主要与探测器测量的波谱宽度,观测区域的地形,反演时是否考虑大气订正等有关。本文未详细分析区域海拔高度和地面覆盖类型对验证结果的影响,将来需结合地形数据做进一步分析。
致谢:感谢NSIDC Distributed Active Archive Center (DAAC) 提供了MODIS积雪产品数据集。

The authors have declared that no competing interests exist.

[1]
Derksen C, LeDrew E. Variability and change in terrestrial snow cover: Data acquisition and links to the atmosphere[J]. Progress in Physical Geography, 2000,24(4):469-498.Abstract: Terrestrial snow cover is of significance to global geophysical systems because of its influence on both climatological and hydrological processes. Snow cover acts as a layer which modifies energy exchange between the surface and atmosphere, and as the frozen storage term in the water balance, affecting runoff and streamflow. This review addresses two challenges with regard to snow cover: how to monitor this variable adequately over time, and how to couple trends and variability in snow cover to atmospheric circulation. Developments in remote-sensing technology have provided a range of satellite-derived data products which complement in situ snow measurement procedures. Variability in data spatial resolution and domain, temporal repeatability, time series length and the level of snow-cover information derived (for example, snow extent vs. snow water equivalent) means that data application plays a large role in the utilization of an appropriate dataset. Given the variability in snow-cover data properties, the state of knowledge regarding interactions between snow cover and the atmosphere is similarly mixed. No standardized trends in continental or hemispheric snow cover are evident and the direction of forcing between snow cover and the atmosphere is still ambiguous. Identified associations are typically regional in extent, and statistically moderate in strength, proving cause-and-effect relationships difficult to identify. Future research needs are outlined, with an emphasis on passive-microwave imagery. These data have the necessary characteristics (quantitative estimates of snow-water equivalent, all-weather imaging) to provide the input data to the process based studies necessary to isolate linkages between snow cover and the atmosphere.

DOI

[2]
Foppa N, Wunderle S, Hauser A, et al.Operational sub-pixel snow mapping over the Alps with NOAA-AVHRR data[J]. Annals of Glaciology, 2003,38:245-252.This study is part of research activities concentrating on the real-time application of the U. S. National Oceanic and Atmospheric Administration (NOAA) Advanced Very High Resolution Radiometer (AVHRR) sensor for snow-cover analysis of the European Alps. For mapping snow cover in heterogeneous terrain, we implement the widely used linear spectral mixture algorithm to estimate snow cover at sub-pixel scale. Principal component analysis, including the reflective part of AVHRR channel 3, is used to estimate fractions of "snow" and "not snow" within a pixel, using linear mixture modeling. The combination of these features leads to a fast, simple solution for operational and near-real-time processing. The presented algorithm is applied on the European Alps on 17 January 2003 and successfully maps snow at sub-pixel scale. The detailed snow-cover information makes it easy to recognize the complex topography of the Alps, more so than with either a classic binary map or a Moderate Resolution Imaging Spectroradiometer (MODIS) snow product. The sub-pixel algorithm reasonably identifies snow-cover fractions in regions and at altitudes where neither the classic binary map nor the MODIS algorithm detects any snow. Differences concerning the snow distribution are found in forested areas as well as in the lowest-elevation zones. The algorithm substantially improves snow mapping over complex topography for operational and near-real-time applications.

DOI

[3]
Parajka J, Bloeschl G.Validation of MODIS snow cover images over Austria[J]. Hydrology and Earth System Sciences, 2006,10(5):679-689.

[4]
Siljamo N, Hyvärinen O.New geostationary satellite-based snow-cover algorithm[J]. Journal of Applied Meteorology and Climatology, 2011,50(6):1275-1290.Snow cover plays an important role in the climate system by changing the energy and mass transfer between the atmosphere and the surface. Reliable observations of the snow cover are difficult to obtain without satellites. This paper introduces a new algorithm for satellite-based snow-cover detection that is in operational use for Meteosat in the European Organisation for the Exploitation of Meteorological Satellites Satellite Application Facility on Land Surface Analysis (LSA SAF). The new version of the product is compared with the old version and the NOAA/National Environmental Satellite, Data, and Information Service Interactive Multisensor Snow and Ice Mapping System (IMS) snow-cover product. The new version of the LSA SAF snow-cover product improves the accuracy of snow detection and is comparable to the IMS product in cloud-free conditions.

DOI

[5]
Solberg R, Wangensteen B, Metsämäki S, et al.GlobSnow snow extent product guide product version 1.0[R]. ESA Globsnow, 2010.

[6]
Dybbroe A, Karlsson K, Thoss A.NWCSAF AVHRR cloud detection and analysis using dynamic thresholds and radiative transfer modeling. Part I: Algorithm description[J]. Journal of Applied Meteorology, 2005,44:39-54.New methods and software for cloud detection and classification at high and midlatitudes using Advanced Very High Resolution Radiometer (AVHRR) data are developed for use in a wide range of meteorological, climatological, land surface, and oceanic applications within the Satellite Application Facilities (SAFs) of the European Organisation for the Exploitation of Meteorological Satellites (EUMETSAT), including the SAF for Nowcasting and Very Short Range Forecasting Applications (NWCSAF) project. The cloud mask employs smoothly varying (dynamic) thresholds that separate fully cloudy or cloud-contaminated fields of view from cloud-free conditions. Thresholds are adapted to the actual state of the atmosphere and surface and the sun锟絪atellite viewing geometry using cloud-free radiative transfer model simulations. Both the cloud masking and the cloud-type classification are done using sequences of grouped threshold tests that employ both spectral and textural features. The cloud-type classification divides the cloudy pixels into 10 different categories: 5 opaque cloud types, 4 semitransparent clouds, and 1 subpixel cloud category. The threshold method is fuzzy in the sense that the distances in feature space to the thresholds are stored and are used to determine whether to stop or to continue testing. They are also used as a quality indicator of the final output. The atmospheric state should preferably be taken from a short-range NWP model, but the algorithms can also run with climatological fields as input.

DOI

[7]
Metsamaki S, Anttila S, Huttunen M, et al.A feasible method for fractional snow cover mapping in boreal zone based on a reflectance model[J]. Remote Sensing of Environment, 2005,95:77-95.A feasible method for mapping the fraction of Snow Covered Area (SCA) in the boreal zone is presented. The method (SCAmod) is based on a semi-empirical model, where three reflectance contributors (wet snow, snow-free ground and forest canopy), interconnected by an effective canopy transmissivity and SCA, constitute the observed reflectance from the target area. Given the reflectance observation, SCA is solved from the model. The predetermined values for the reflectance contributors can be adjusted to an optional wavelength region, which makes SCAmod adaptable to various optical sensors. The effective forest canopy transmissivity specifies the effect of forests on the local reflectance observation; it is estimated using Earth observation data similar to that employed in the actual SCA estimation. This approach enables operationl snow mapping for extensive areas, as auxiliary forest data are not needed. Our study area covers 404 000 km(2), comprising all drainage basins of Finland (with an average area of 60 km(2)) and some transboundary drainage basins common with Russia, Norway and Sweden. Applying SCAmod to NOAA/AVHRR cloud-free data acquired during melting periods 2001-2003, we estimated the areal fraction of snow cover for all the 5845 basins. The validation against in situ SCA from the Finnish snow course network indicates that with SCAmod, 15% (absolute SCA-units) accuracy for SCA is gained. Good results were also obtained from the validation against snow cover information provided by the Finnish weather station network, for example, 94% of snow-free and fully snow-covered basins were recognized. A general formula for deriving the statistical accuracy of SCA estimates provided by SCAmod is presented, complemented by the results when the AVHRR data are employed. Snow melting in Finland has been operatively monitored with SCAmod in Finnish Environment Institute (SYKE) since year 2001. The SCA estimates have been assimilated to the Finnish national hydrological modelling and forecasting system since 2003, showing a substantial improvement in forecasts. (c) 2004 Elsevier Inc. All rights reserved.

DOI

[8]
Romanov P, Gutman G Csiszar I. Automated monitoring of snow cover over North America with multispectral satellite data[J]. Journal of Applied Meteorology 2000,39:1866-1880.Examines an automated monitoring of snow cover for snow mapping analysis of the National Oceanic and Atmospheric Administration (NOAA) in North America. Use of satellite data as an alternative source of information; Assessment of system performance; Similarity of automated product accuracy to NOAA manually produced operational snow covering.

DOI

[9]
Zhao H, Ferandes R. Daily snow cover estimation from Advanced Very High Resolution Radiometer Polar Pathfinder data over Northern Hemisphere land surfaces during 1982-2004[J]. Journal of Geophysical Research, 2009,114(5),D05113:1-14.

[10]
Simpson J J, Stitt J R, Sienko M.Improved estimates of the areal extent of snow cover from AVHRR data[J]. Journal of Hydrology, 1998,204(1-4):1-23.ABSTRACT Satellite data provide the only practical way to obtain the necessary spatial and temporal coverage of areal extent of snow cover required for hydrometeorological applications. A new procedure has been developed which: (1) accurately separates snow and cloud from clear land in a terrestrial scene; and (2) uses other criteria to separate both cold, high clouds and warm, low clouds from snow. A mixed pixel class is also identified and pixels in this class can be assigned a percentage composition (cloud, snow, and land) using a linear mixing model. The procedure has been ground-truthed with both Landsat data and SNOTEL (SNOwTELemetry) observations. Classification skill, based on a statistical comparison with SNOTEL observations, is about 97%. Application of the procedure to a wide variety of terrestrial environments is demonstrated.

DOI

[11]
Husler F, Jonas T, Wunderle S, et al.Validation of a modified snow cover retrieval algorithm from historical 1-km AVHRR data over the European Alps[J]. Remote Sensing of Environment, 2012,121:497-515.Seasonal snow cover is a valuable indicator of climatic variations due to its sensitivity to temperature and precipitation. Complementary to ground-based station data, satellite time series provide large-scale spatial capabilities. The primary disadvantage of this technique, however, is the relative brevity of records. Only AVHRR offers the opportunity to analyze more than 25聽years of medium-resolution satellite imagery on a daily basis. AVHRR thereby holds a great potential to detect, map and quantify long-term environmental changes. However, to serve this purpose though, adequate algorithms and careful validation are of major significance.Here, we describe and extensively validate snow cover retrieval from historical 1-km AVHRR data using a stable snow detection algorithm, which allows consistent snow sampling across all AVHRR sensors. As a new asset, a pixel-wise probability map based on logistic regression is provided for each snow mask. The spatial and seasonal validation includes a comparison to MOD10A1 and webcam imagery. In addition, the influence of acquisition geometry and the sensor-to-sensor consistency have been investigated using LANDSAT TM data and a snow climatology based on long-term station data.We conclude that the snow detection algorithm tested allows for a 1-km snow extent climatology to be generated from the 25-year full-resolution AVHRR data archived at the University of Bern with favorable accuracy and stability. Given the importance of mountainous regions for climate change studies, this satellite-based data set could become an important tool for assessing environmental changes in the European Alps.

DOI

[12]
黄晓东,张学通,李霞,等.北疆牧区MODIS积雪产品MOD10A1和MOD10A2的精度分析与评价[J]. 冰川冻土, 2007,29(5):722-729.以北疆为研究区,结合气象台站记录的雪情数据,利用地理信息系统方法分析了2004年12月1日至2005年2月28日期间北疆地区90个时相的MODIS每日积雪产品MOD10A1和8日合成产品MOD10A2的积雪分类精度.研究表明:1)当积雪深度≤3 cm时,MOD10A1对积雪的识别率非常低,仅为7.5%;积雪深度为4~6 cm时,积雪识别率达到29.3%;积雪深度为15~20 cm,平均积雪识别率达到45.6%.当积雪深度>20 cm时,平均积雪识别率为32.2%;2)MOD10A1产品的积雪分类精度受天气状况的严重影响.在晴空状况下,该产品的最大积雪识别率达到58.2%;但是在多云或阴天时,平均积雪识别率仅为17.8%;3)下垫面对MOD10A1的分类结果也会造成影响,在荒漠区MOD10A1的积雪识别率为39.8%,在草原和稀树草原区的积雪识别率为37.2%,农业用地的积雪识别率最低,为29.1%;4)MOD10A2产品可较好的消除云层对地表积雪分类精度的影响,平均积雪识别率达87.5%,可较好的反映地表积雪的分布状况.

[13]
Wang X W, Xie H J, Liang T G.Evaluation of MODIS Snow Cover and Cloud Mask and Its Application in Northern Xinjiang, China[J]. Remote Sensing of Environment, 2008,112:1497-1513.Using five-year (2001–2005) ground-observed snow depth and cloud cover data at 20 climatic stations in Northern Xinjiang, China, this study: 1) evaluates the accuracy of the 8-day snow cover product (MOD10A2) from the Moderate Resolution Imaging Spectroradiometer (MODIS)/Terra satellite, 2) generates a new snow cover time series by separating the MODIS cloud masked pixels as snow and land, and 3) examines the temporal variability of snow area extent (SAE) and correlations of air temperature and elevation with SAE. Results show that, under clear sky conditions, the MOD10A2 has high accuracies when mapping snow (94%) and land (99%) at snow depth ≥024 cm, but a very low accuracy (<0239%) for patchy snow or thin snow depth (<024 cm). Most of the patchy snow is misclassified as land. The mean accuracy of the cloud mask used in MOD10A2 for December, January and February is very low (19%). Based on the ratio of snow to land of ground observations in each month, the new snow cover time series generated in this study provides a better representation of actual snow cover for the study area. The SAE (%) time series exhibits similar patterns during six hydrologic years (2001–2006), even though the accumulation and melt periods do not exactly coincide. The variation of SAE is negatively associated with air temperature over the range of 610210 °C to 5 °C. An increase in elevation generally results in longer periods of snow cover, but the influence of elevation on SAE decreases as elevation exceeds 4 km in the Ili River Watershed (IRW). The number of days with snow cover shows either a decreasing trend or no trend in the IRW and the entire study area in the study

DOI

[14]
郝晓华,张璞,王建,等.MODIS和VEGETATION积雪产品在北疆的验证及比较[J].遥感技术与应用,2009,24(5):603-610.<p>雪盖产品的准确性评估对于水文模型中的遥感应用具有重要的意义,利用北疆47个气象站实测雪深资料,并将气象站根据海拔和下垫面进行分类,对我国可使用的3种光学遥感雪盖产品MOD10A1、MOD10A2和VGT-S10雪盖产品进行验证。研究表明,MOD10A1、MOD10A2和VGT-S10雪盖产品识别总体精度分别为91.3%、90.6%和87.9%,3种产品在农田、草地、城镇和建筑用地总体精度更高 |在稀疏灌木林、裸地与稀疏植被识别总体精度较低,特别是在山区,3种产品识别精度均较低,分别为66.3%、75.7%和61.9%。进一步统计3种雪盖产品的错分误差、漏分误差,发现3种产品错分误差都比较小,但在山区站的漏分误差比较严重,分别为32.4%、21.7%和36.3%,3种产品在山区都低估了雪盖面积。3种不同时间分辨率的雪盖产品云影响率分别为61.8%、7.6%和1.8%。最后将MODIS合成与VGT-S10时间分辨率相同的雪盖产品,并对两种产品在积雪积累期和消融期进行相互比较,比较发现MODIS识别精度要优于VGT-S10雪盖产品,3种产品中VGT-S10由于合成天数最多,所以雪盖产品受云的影响最小。</p>

[15]
Stevenson M, Jolliffe T, Stephenson D B.Forecast verification: A practitioner's guide in atmospheric science[J]. International Journal of Forecasting, 2006,22(2):403-405.the quality of individual forecasts 11.5 Decadal and longer-range forecast verification 11.6Summary 12: Epilogue 1.1 A brief history and current practice Forecasts are made in a wide rangeof It gives a good up-to-date overview of verification methods and issues associated with

[16]
Storch H V, Zwiers F W.Statistical analysis in climate research[M]. Cambridge, UK: New York Cambridge University Press, 2001:1484.

[17]
Wilks D S.Statistical methods in the atmospheric sciences[M]. NewYork: Academic Press, 2005.

文章导航

/