全球卫星气候遥感数据

印度植被净初级生产力的时空变异及其影响因素分析

  • 王猛 , 1, 2 ,
  • 李贵才 , 1, * ,
  • 王军邦 3 ,
  • 孙晓芳 2 ,
  • 郭兆迪 1
展开
  • 1. 国家卫星气象中心,北京 100081
  • 2. 曲阜师范大学,日照 276826
  • 3. 中国科学院地理科学与资源研究所,北京 100101
*通讯作者:李贵才(1973-),男,内蒙古人,博士,副研究员,研究方向为植被遥感。E-mail:

作者简介:王猛(1982-),男,山东淄博人,博士,讲师,研究方向为生态遥感。E-mail:

收稿日期: 2015-05-04

  要求修回日期: 2015-06-01

  网络出版日期: 2015-11-10

基金资助

国家自然科学基金项目(41371400、31400428)

曲阜师范大学博士科研启动基金项目(BSQD040000056)

Spatio-Temporal Variation of the Net Primary Production in Indian and Their Relationships to Climate Factors

  • WANG Meng , 1, 2 ,
  • LI Guicai , 1, * ,
  • WANG Junbang 3 ,
  • SUN Xiaofang 2 ,
  • GUO Zhaodi 1
Expand
  • 1. National Satellite Meteorological Centre, Beijing 100081, China
  • 2. Qufu Normal University, Rizhao 276826, China
  • 3. Institute of Geographic Sciences and Natural Resources Research, Chinese Academy of Sciences, Beijing 100101, China
*Corresponding author: LI Guicai, E-mail:

Received date: 2015-05-04

  Request revised date: 2015-06-01

  Online published: 2015-11-10

Copyright

《地球信息科学学报》编辑部 所有

摘要

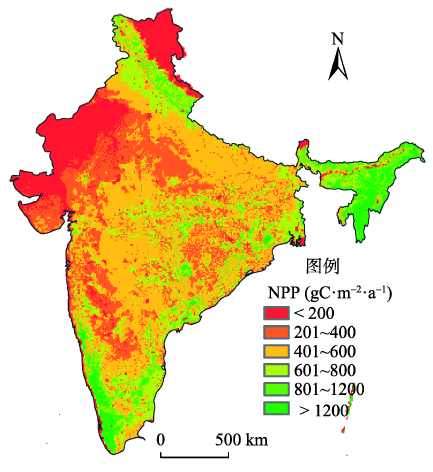
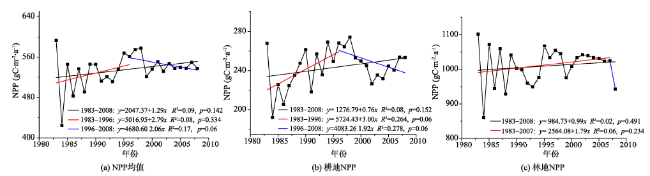
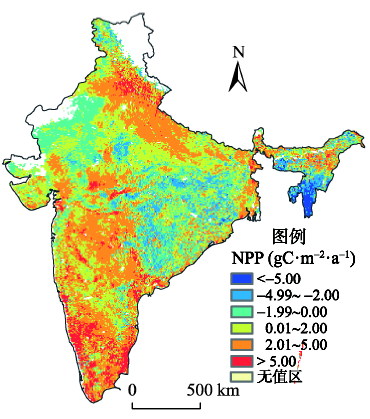
本研究旨在探讨1983-2008 年间印度植被净初级生产力(NPP)的时空变化格局及其与温度降水的关系。基于遥感数据和GLOPEM-CEVSA模型估算区域植被NPP,利用分段线性回归,分析了过去26年印度植被NPP的时空格局与变化特征。结果表明:(1)过去26年间印度植被年均NPP为414.29 gC·m-2·a-1,森林、农田和草地的NPP平均值分别为1002.32、485.98和631.39 gC·m-2·a-1。(2)分段线性回归结果显示,1983-2008 年间,印度植被总平均NPP呈先上升后下降的趋势,趋势转折点在1996年。占印度面积比例最大的农田植被类型的平均NPP也呈先上升后下降的趋势,趋势转折点在1996年,与总平均NPP的趋势转折点一致。(3)在空间上,印度大部分地区,发生了趋势转折,趋势转折点集中在1991-2000年间,大部分地区NPP在趋势转折点前呈上升趋势,其后呈下降趋势,与区域平均NPP的变化趋势一致。(4)印度西北部干旱地区植被NPP与温度呈负相关,与降水呈正相关。喜马拉雅山南部森林NPP则与温度呈正相关。降雨量较大的印度南部地区NPP与降水呈负相关。

本文引用格式

王猛 , 李贵才 , 王军邦 , 孙晓芳 , 郭兆迪 . 印度植被净初级生产力的时空变异及其影响因素分析[J]. 地球信息科学学报, 2015 , 17(11) : 1355 -1361 . DOI: 10.3724/SP.J.1047.2015.01355

Abstract

Net primary production (NPP) quantifies the net carbon contained by plants, which is of great importance to estimate the terrestrial carbon sink. Monitoring regional carbon storage in the form of NPP is, therefore, indispensable for improving the health state of the biosphere and system for carbon credit trading. In this study, the spatial and temporal patterns of NPP and their climatic controls in the ecosystems of India for the period of 1983-2008 were analyzed using a remote sensing based GLOPEM-CEVSA carbon model and piecewise regression methods. Results showed that the average annual NPP of the study area from 1983 to 2008 was 414.29 gC·m-2·a-1. The mean NPP of forest, cropland and grassland were 1002.32 gC·m-2·a-1, 485.98 gC·m-2·a-1, and 631.39 gC·m-2·a-1 respectively. At the national scale, a statistically insignificant positive trend of NPP was observed during 1983-2008. However, the increasing trend in NPP was not continuous throughout the 26-year period at the national scale. There were two distinct periods with opposite trends in NPP during 1983-2008. A significant turning point in 1996 was detected by the piecewise regression method. Firstly, NPP increased significantly from 1983 to 1996, while it then decreased from 1996 to 2008. The increase in NPP was primarily due to the enhancement of productivity over agricultural lands in the country. There are further spatial analyses supporting the concluded trend of average NPP. At the regional scale, the turning points appeared mostly in the 1991-2000 period. Savanna experienced the earliest trend of change. Climate had a strong impact on NPP during the period. The correlation coefficients indicated that the inter-annual variability in NPP was primarily driven by the precipitation and temperature variability. NPP in the northwest India was negatively correlated to temperature and positively correlated to precipitation. NPP in south Himalaya forest was positively correlated to temperature. NPP in southern region of India was negatively correlated to precipitation. These results are critical to understand the response of vegetation growth and carbon cycle to environmental change.

1 引言

植被净初级生产力(Net Primary Production,NPP)可反映植被生态系统的生产能力,是衡量生态系统健康状况的重要指标[1]。另外,作为地表碳循环的重要组成部分,NPP是碳循环的主要研究内容之一。由于NPP是判定生态系统碳源/汇的主要因子,在全球变化及碳循环研究中具有重要的作用[2]
过去几十年全球许多地区的NPP呈增加趋 势[3-5]。Nemani等研究表明全球NPP在1982-1999年间增加了6%,认为热带生态系统NPP的增加对全球NPP增加贡献率最大[3]。然而,最近的研究表明,NPP增加趋势在20世纪初放缓,甚至出现了NPP下降趋势。Zhao等研究表明,2000-2009年间全球平均NPP下降了0.55 PgC,并发现南半球热带地区的干旱事件导致了NPP的下降[6]。近年来,研究人员在印度地区开展了一系列NPP的研究,并取得较大进展。Nayak等利用 CASA模型模拟得到2003年印度的总NPP为1.57 Pg C,比同时期MODIS NPP产品1.30 Pg C略高[7]。Singh等基于GLO-PEM的研究与上述研究差异较大,在1983和1998年分别为3.56和4.57 Pg C,研究表明,1981-2000年间净初级生产力每10 a增加8.5%[8]。Nayak等基于CASA模型研究了印度地区植被净初级生产力的年际变化,研究表明1981-2006年间,NPP增加了8.5%,且在不同时间段,NPP增加的变化速率不一致,即1981-1995年间植被净初级生产力增加了15%,而在1991-2005年间植被净初级生产力仅增加了2.5%,植被净初级生产力的变化速率放缓明显[9]。可见,在过去几十年的不同时段,印度地区NPP的变化趋势并不一致。由于气候变化的复杂性,植被参数年际动态往往呈非单调线性变化。近年来,学者将分段线性回归方法(Piecewise Linear Regression, PLR)应用于NDVI等参数的时间变化动态研究中,相对于线性回归方法,PLR方法在理论上能更好地表征植被的年际动态变化[10]
由于输入数据和碳循环模型的差异,不同估算研究得到的NPP结果差异较大,仍需对印度地区的NPP时空变化特征进行进一步研究。遥感-过程耦合模型融合了生态生理过程模型和光能利用率模型的优点,实现了碳循环过程的跨尺度模拟,能较好地进行碳循环模拟[11]。Wang等将生态系统过程模型CEVSA和生产效率模型GLOPEM进行耦合,构建了GLOPEM-CEVSA模型,与碳通量数据比较表明,该模型能较好地模拟植被碳循环[12]。为了准确地反映近30 a来印度地区NPP的时空变化趋势,本文基于GLOPEM-CEVSA模型估算的印度地区植被的NPP,利用分段线性回归分析了印度地区NPP的时空变化特征,旨在定量研究NPP的变化和分布规律,降低区域碳循环的不确定性。

2 研究地区和研究方法

2.1 研究区概况

本文选择印度65°~100°E,5°~40°N为研究区,包含耕地、耕地和自然植被镶嵌区、林地、永久湿地、热带草原、灌丛、水域等地表覆盖类型(图1)。气候和土壤质地的分布决定了陆地生态系统植被的分布,研究区气候条件差异较大,因此,植被类型较为多样,包含了具有不同叶面积的阔叶林和针叶林,以及相应的落叶林、常绿林及半常绿林。
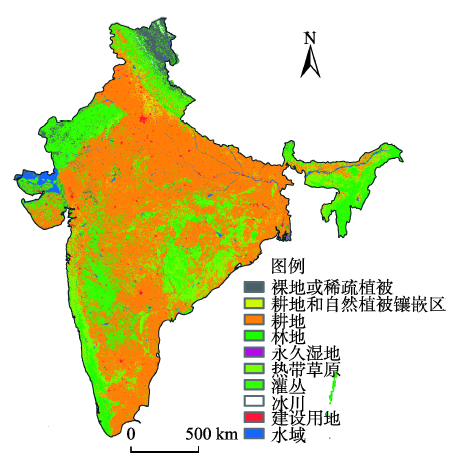
Fig. 1 The land cover map of the research area according to the MODIS land cover product MOD12Q1

图1 研究区地表覆盖类型图(基于MODIS土地利用产品MCD12Q1)

2.2 研究方法

2.2.1 GLOPEM-CEVSA 模型
本文利用GLOPEM-CEVSA模型[13]模拟NPP数据。在遥感-过程耦合模型GLOPEM-CEVSA中,基于碳循环理论将生态系统过程模型CEVSA和生态遥感模型GLO-PEM模型进行耦合。GLOPEM-CEVSA模型基于光能利用率原理,遥感反演的光合有效辐射吸收比率FPAR,模拟植被吸收光合有效辐射,得到总初级生产力GPP,其中,植被潜在光能利用率依据光合作用内禀光量子效率理论区分C3和C4进行确定。以植被生物量与气温的关系、不同植被类型维持性呼吸的系数与温度之间的关系,模拟得到植被维持呼吸Rm和生长呼吸Rg,GPP减去自养呼吸Ra(即Rm和Rg之和),得到植被净初级生产力NPP。由于原GLO-PEM模型中仅通过植被生物量与气温的经验关系模拟自养呼吸,GLOPEM-CEVSA进一步采用基于过程的自养呼吸模拟,更好地刻画植被生长过程,进而提高了NPP的模拟精度[14]。与完全采用气候数据作为驱动数据的生态系统模型不同,GLOPEM-CEVSA模型仍为光能利用率模型,其沿用了生理生态学的最大光能利用率模拟方法,以遥感数据和气候数据作为驱动数据,通过GLO-PEM与CEVSA模型的耦 合,实现碳周转、碳固定、碳分配等碳循环过程的 模拟[13]
GLOPEM-CEVSA模型的输入数据包括遥感反演的FPAR、气温、降水、空气相对湿度、风速和辐射等数据。其中,FPAR数据基于GIMMS3g(Global Inventory Modelling and Mapping Studies)NDVI数据计算得到[13],空间分辨率为8 km×8 km。气象输入数据由站点数据采用Auspline方法进行插值处理,得到与遥感FPAR数据具有相同空间分辨率 (8 km×8 km)的气象栅格数据。其中,空气相对湿度由露点温度和大气温度计算得到[13];大气温度、露点温度、风速来自于国家气候中心(http://www.ncdc.noaa.gov/)。降水数据来自APHRODITE(Asian Precipitation-Highly Resolved Observational Data Integration Towards Evaluation of Water Resources)研究计划建立的逐日亚洲陆地降水数据集(简称APHRO),以最邻近算法对该数据集进行转投影和重采样,得到与本研究中其他数据相一致的投影和时空分辨率;地表辐射平衡数据来自于美国航空航天局兰利研究中心大气科学数据中心(NASA/GEWEX SRB)项目(http://www.rankinsider.com/eosweb.larc.nasa.gov),空间分辨率为1°×1°,由于辐射数据空间连续性较好,因此采用双线性插值将该数据集重采样为8 km×8 km。
2.2.2 NPP时空变化趋势分析
为了分析时间序列植被变化趋势,首先采用最小二乘回归法拟合NPP的线性变化趋势。另外,由于受到气候波动、人类活动等因素的影响,植被动态变化趋势常具有明显的阶段性(即存在趋势转折点),导致整体上的一个单一趋势无法反映植被动态变化在不同阶段的特征,因此,为了更加合理地分析植被变化的趋势,本研究中同时采用了分段线性回归模型分析了每个栅格NPP的变化趋势,分段线性回归模型的计算公式如式(1)所示[15-16]
y = β 0 + β 1 t + ε t α β 0 + β 1 t + β 2 ( t - α ) + ε t > α (1)
式中,y为因变量;t为自变量; β 0 为拟合直线的截距; β 1 β 1 + β 2 分别为2个阶段的斜率; α 是待估计的趋势转折点; ε 是随机误差。分段线性模型可计算出时间序列的趋势转折点,在转折点前后分别做线性拟合,使拟合残差平方和最小的转折点和斜率即为分段拟合的最优解[17]。利用F统计量检验转折点的显著性,当P<0.05时拒绝零假设,认为转折点显著存在。分段线性回归模型已应用于不同领域的研究,如群落生态[18-20]、植物生长与气候的相关性分析[10,21]、长时间序列气候资料非均一性的检验[17,22]等。

3 植被净初级生产力时空分析

3.1 NPP多年均值的空间格局

图2为1983-2008年间印度植被NPP年均值的空间分布。由图2可知,该地区NPP的空间变异较大:印度东北部和西南部森林分布区年均单位面积植被NPP较大,均值大于1000 gC·m-2·yr-1;印度东北恒河平原的年均NPP在400~800 gC·m-2·a-1之间;印度中部的草地和混合灌丛的年均NPP介于200~600 gC·m-2·a-1之间;印度西北部荒漠和北部喜马拉雅山区年均NPP较低,大部分低于200 gC·m-2a-1。该空间分布特征与印度气候条件具有较好的一致性。模型结果显示,不同植被类型的年均单位面积植被NPP差异较大。模型估算的森林年均单位面积植被NPP为1002.32 gC·m-2·a-1,其中农田的年均单位面积植被NPP 为485.98 gC·m-2·a-1,灌丛为188.7 gC·m-2·a-1,热带草原为631.39 gC·m-2·a-1,农田和自然植被镶嵌体为619.26 gC·m-2·a-1。研究区农田植被类型的总面积最大,占研究区域面积的54.1%,农田植被类型的NPP对区域碳收支影响较大,农田NPP占印度总植被NPP的51.5%,其次是森林植被类型,占20.5%(表1)。
Fig. 2 Spatial distribution of average annual NPP in India from 1983 to 2008

图2 1983-2008年间印度年均植被NPP分布

Tab. 1 Statistics of annual NPP over major land cover types in India

表1 印度主要植被类型的面积及NPP统计值

地表覆盖类型 占总面积的比例(%) 平均值(gC·m-2·a-1) 贡献率(%)
林地 10.4 1002.32 20.5
灌丛 12.9 245.51 6.2
耕地 54.1 485.98 51.5
热带草原 13.3 631.39 16.4
耕地和自然植被镶嵌区 2.6 619.26 3.2

3.2 NPP年际变化趋势

图3(a)可看出,1983-2008年间,印度植被年均NPP呈波动上升趋势,但是趋势不显著(p=0.142)。分段线性回归分析结果表明,过去26年印度年均NPP发生了趋势转折,趋势转折点在1996年。其中,1983-1996年间NPP呈上升趋势,趋势不显著(p=0.334),1996-2008年间NPP呈下降趋势,趋势明显。
在国家尺度上,分析了占印度总面积比例较高的2种植被类型农田和森林的NPP年际变化趋势。农田的年均NPP年际变化趋势转折点在1996年,该转折点年份恰好与整个区域的趋势转折点一致,而且农田生态系统的趋势斜率更大,显著性相较印度总NPP均值明显(图3(b))。森林生态系统NPP在整个时间尺度上,呈现上升趋势,趋势转折点2007年,趋势转折点不显著,说明在整个时间段未发生趋势转折(图3(c))。由此得出,由于印度农田面积较大,印度在过去30年NPP年际变化的主要驱动因素,是农田NPP的趋势变化。Nayak等分析了印度年均NPP在1981-1995年和1991-2005年2个时间段的变化趋势,发现2个时间段NPP都呈增加趋势,后一阶段NPP上升趋势较前一阶段上升速率小很多[9]。这与本研究年际变化趋势不尽一致,本研究采用分段线性回归方法,发现1996年前后2个阶段的NPP呈相反变化趋势。
Fig. 3 Inter-annual variations of NPP

图3 研究区NPP的年际变化趋势

3.3 NPP变化趋势的时空分布

图4为NPP在整个研究时段内变化趋势的空间分布格局,研究时段内印度NPP减少和增加的区域相间分布。在1983-2008年间,大部分农田和森林植被生态系统的NPP呈上升趋势,印度北部喜马拉雅山附近和印度西南部森林NPP增加幅度较大,仅印度东北部地区森林植被NPP下降幅度较大。大部分草原和灌丛植被类型的NPP呈下降趋势,下降趋势较明显。
Fig. 4 The spatial pattern of NPP changing trend

图4 NPP变化趋势的分布格局

图5可知,印度大部分农田NPP趋势转折点在1991-2000年间,这与均值NPP的趋势转折点基本一致。东北部草原灌丛NPP趋势转折点发生较早,趋势转折点大部分介于1983-1990年间。森林植被类型的趋势转折点空间分布差异较大,东北部森林趋势转折点发生较晚,大部分趋势转折点发生在2000年之后。而西南部森林趋势转折点大多发生在1996-2000年间。基于各像元趋势转折点,分析了趋势转折点前后的NPP变化趋势;研究表明,趋势转折点前大部分区域NPP呈升高趋势(图6(a)),转折点后大部分区域NPP呈下降趋势(图6(b))。这一变化趋势在农田生态系统较为明显,在森林和草原生态系统不明显。印度西南部部分森林区,转折点前,NPP呈下降趋势,而转折点后则呈上升趋势,与其他地区不一致。
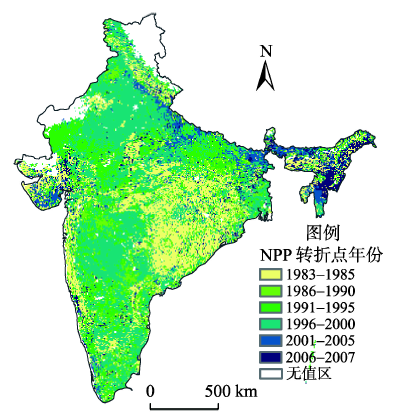
Fig. 5 The spatial pattern of NPP turning point

图5 研究区NPP转折点年份空间分布图

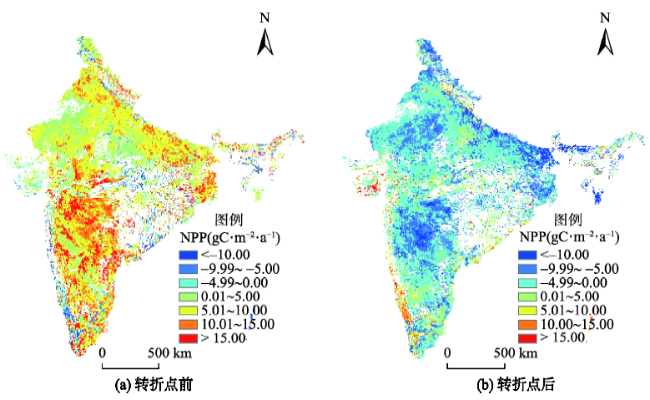
Fig. 6 The trend of NPP variation before and after the turnpoint

图6 NPP转折点前、后变化趋势分布图

3.4 NPP与温度降水的区域相关性

为了探究印度NPP年际变化的驱动因素,在栅格尺度上分析了印度NPP与年均温和年累计降雨的相关关系(图7)。如图7所示,西北部干旱区的灌丛和沙漠NPP,与温度呈较强的负相关,增温将降低该区域的NPP。大部分农田生态系统NPP与温度呈负相关,在西北部干旱区域,这种负相关性更明显。喜马拉雅山南部森林,由于海拔较高,受温度限制,该区域的森林植被NPP与温度呈正相关。东部沿海部分农田和西南部的森林区,植被与温度呈正相关。印度西北部灌丛和荒漠地区NPP与降水呈正相关。西北部部分农田植被NPP与降水呈正相关,该区域较为干旱,降水有助于植被生长。西北部灌丛和荒漠区植被NPP与降水呈显著的正相关。南部农田和森林NPP与降水呈负相关,该区域降水较多,持续的降水降低区域辐射强度,降水减少有利于该区植被生长。热带草原NPP与降水呈正相关,东北部森林NPP与降水呈较显著的正相关。农田区域除了受温度和降水的影响,人为管理措施对农田NPP影响较大。Bala等研究发现过去几十年印度灌溉面积和施肥量的增加,导致农田NPP提高明显。近年来,由于农业技术对NPP提高作用的贡献率下降,NPP变化趋势有所改变[23]
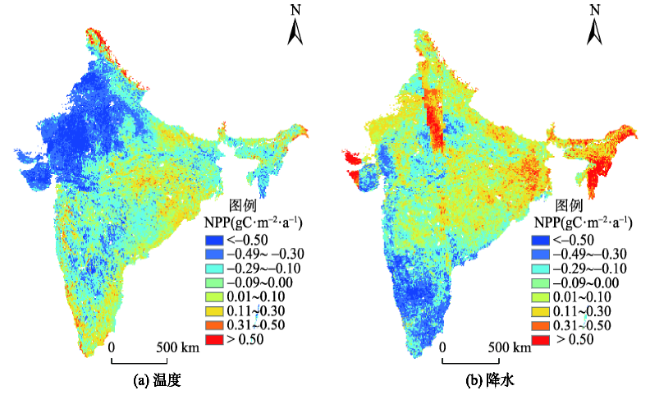
Fig. 7 The spatial distribution of correlation coefficient of NPP and temperature and precipitation

图7 研究区NPP与温度和降水的相关系数

4 结论

本文以长时间序列遥感数据和GLOPEM-CEVSA模型,利用分段线性回归等方法,分析了过去26 a间印度植被NPP的时空格局与变化特征及其影响因素,得出以下结论:
(1)过去26 a间,印度植被年均NPP为414.29 gC·m-2·a-1,森林、农田和草地的NPP 平均值分别为1002.32、485.98和631.39 gC·m-2·a-1。农田植被类型的NPP对区域碳收支影响较大,农田NPP占印度总植被NPP的51.5%。
(2)1983-2008年间,印度植被年均NPP呈上升趋势,趋势不显著。分段线性回归分析表明,年均NPP年际变化趋势存在趋势转折,趋势转折点在1996年。1996年之前,NPP呈上升趋势,之后NPP呈下降趋势。农田生态植被NPP呈先增长,后下降的趋势,趋势转折点在1996年,与印度总NPP年际变化趋势基本一致。农田植被类型面积占印度总面积的54.1%,印度总NPP变化趋势主要受农田NPP变化趋势的影响。
(3)在空间上,大部分像元的趋势转折点在1991-2000年间,东北部草原和灌丛趋势转折点发生较早,东北部森林的趋势转折点较晚。趋势转折点前,研究区大部分区域NPP呈上升趋势,趋势转折点后,NPP呈下降趋势。西南部部分森林区,趋势转折前呈下降趋势,趋势转折后呈上升趋势,与其他区域不一致。
(4)印度西北部干旱地区植被NPP与温度呈负相关,与降水呈正相关。喜马拉雅山南部森林和东部部分农田植被NPP与温度呈正相关。降雨量较大的南部地区NPP与降水呈显著的负相关。除了温度降水外,人为管理措施对农田的NPP影响较大。

The authors have declared that no competing interests exist.

[1]
张镱锂,祁威,周才平,等.青藏高原高寒草地净初级生产力(NPP)时空分异[J].地理学报,2013,68(9):1197-1211.基于1982-2009 年间的遥感数据和野外台站生态实测数据,利用遥感生产力模型(CASA模型) 估算青藏高原高寒草地植被净初级生产力(NPP),分别从地带属性(自然地带、海拔高程、经纬度)、流域、行政区域(县级) 等方面对其时空变化过程进行分析,阐述了1982 年以来青藏高原高寒草地植被NPP的时空格局与变化特征。结果表明:① 青藏高原高寒草地NPP多年均值的空间分布表现为由东南向西北逐渐递减;1982-2009 年间,青藏高原高寒草地的年均总NPP为177.2&#215;10<sup>12</sup> gC&#183;yr<sup>-1</sup>单位面积年均植被NPP为120.8 gC&#183;m<sup>-2</sup>yr<sup>-1</sup>;② 研究时段内,青藏高原高寒草地年均NPP 在112.6~129.9 gC&#183;m<sup>-2</sup>yr<sup>-1</sup> 间,呈波动上升的趋势,增幅为13.3%;NPP 增加的草地占草地总面积的32.56%、减少的占5.55%;③ 青藏高原多数自然地带内的NPP呈增加趋势,仅阿里山地半荒漠、荒漠地带NPP呈轻微减低趋势,其中高寒灌丛草甸地带和草原地带的NPP增长幅度明显大于高寒荒漠地带;年均NPP增加面积比随着海拔升高呈现"升高—稳定—降低"的特点,而降低面积比则呈现"降低—稳定—升高"的特征;④ 各主要流域草地年均植被NPP均呈现增长趋势,其中黄河流域增长趋势显著且增幅最大。植被NPP和盖度及生长季时空变化显示,青藏高原高寒草地生态系统健康状况总体改善局部恶化。

DOI

[2]
朱文泉,潘耀忠,张锦水.中国陆地植被净初级生产力遥感估算[J].植物生态学报,2007,31(3):413-424.该文在综合分析已有光能利用率模型的基础上,构建了一个净初级生产力(<EM>NPP</EM>)遥感估算模型,该模型体现了3方面的特色:1)将植被覆盖分类引入模型,并考虑植被覆盖分类精度对 <EM>NPP</EM> 估算的影响,由它们共同决定不同植被覆盖类型的归一化植被指数(<EM>NDVI</EM>)最大值;2)根据误差最小的原则,利用中国的<EM>NPP</EM>实测数据,模拟出各植被类型的最大光能利用率,使之更符合中国的实际情况;3)根据区域蒸散模型来模拟水分胁迫因子,与土壤水分子模型相比,这在一定程度上对有关参数实行了简化,使其实际的可操作性得到加强。模拟结果表明,1989~1993年中国陆地植被<EM>NPP</EM>平均值为3.12 Pg C (1 Pg=10<SUP>15</SUP> g),<EM>NPP</EM>模拟值与观测值比较接近,690个实测点的平均相对误差为4.5%;进一步与其它模型模拟结果以及前人研究结果的比较表明,该文所构建的<EM>NPP</EM>遥感估算模型具有一定的可靠性,说明在区域及全球尺度上,利用地 理信息系统技术将遥感数据和各种观测数据集成在一起,并对<EM>NPP</EM>模型进行参数校正, 基本上可以实现全球范围不同生态系统<EM>NPP</EM>的动态监测。

[3]
Nemani R R, Keeling C D, Hashimoto H, et al.Climate-driven increases in global terrestrial net primary production from 1982 to 1999[J]. Science, 2003,300(5625):1560-1563.Recent climatic changes have enhanced plant growth in northern mid-latitudes and high latitudes. However, a comprehensive analysis of the impact of global climatic changes on vegetation productivity has not before been expressed in the context of variable limiting factors to plant growth. We present a global investigation of vegetation responses to climatic changes by analyzing 18 years (1982 to 1999) of both climatic data and satellite observations of vegetation activity. Our results indicate that global changes in climate have eased several critical climatic constraints to plant growth, such that net primary production increased 6% (3.4 petagrams of carbon over 18 years) globally. The largest increase was in tropical ecosystems. Amazon rain forests accounted for 42% of the global increase in net primary production, owing mainly to decreased cloud cover and the resulting increase in solar radiation.

DOI PMID

[4]
Cao M, Prince S D, Small J, et al.Remotely sensed interannual variations and trends in terrestrial net primary productivity 1981-2000[J]. Ecosystems, 2004,7(3):233-242.lt;a name="Ab1"></a>Spatial and temporal variations in net primary production (NPP) are of great importance to ecological studies, natural resource management, and terrestrial carbon sink estimates. However, most of the existing estimates of interannual variation in NPP at regional and global scales were made at coarse resolutions with climate-driven process models. In this study, we quantified global NPP variation at an 8 km and 10-day resolution from 1981 to 2000 based on satellite observations. The high resolution was achieved using the GLObal Production Efficiency Model (GLO-PEM), which was driven with variables derived almost entirely from satellite remote sensing. The results show that there was an increasing trend toward enhanced terrestrial NPP that was superimposed on high seasonal and interannual variations associated with climate variability and that the increase was occurring in both northern and tropical latitudes. NPP generally decreased in El Ni&ntilde;o season and increased in La Ni&ntilde;a seasons, but the magnitude and spatial pattern of the response varied widely between individual events. Our estimates also indicate that the increases in NPP during the period were caused mainly by increases in atmospheric carbon dioxide and precipitation. The enhancement of NPP by warming was limited to northern high latitudes (above 50&deg;N); in other regions, the interannual variations in NPP were correlated negatively with temperature and positively with precipitation.

DOI

[5]
Hicke J A, Lobell D B.Spatiotemporal patterns of cropland area and net primary production in the central United States estimated from USDA agricultural information[J]. Geophysical research letters, 2004,31(20):L20502.1] The central United States, which is dominated by agriculture, has been selected as the first North American Carbon Program intensive campaign. Data sets that describe spatiotemporal variability in carbon fluxes are needed to support this campaign. Here we report the behavior of county cropland net primary production (NPP) in the first intensive region derived using USDA information together with crop-specific parameters that convert agronomic data into carbon fluxes. Total cropland area in the eight-state region was 65550,000 km 2 (40% of total area), with some interannual variability but no temporal trend from 1972 to 2001. Regional production (P) was 0.3 Pg C yr 611 in the late 1990s, roughly 64% of the total US crop production. P was highest in the central counties (>1.2 Tg C yr 611 ). In contrast to area, both NPP (flux per unit area) and P (spatially aggregated flux) increased during the study period (46 and 51%, respectively). Corn was the dominant crop type grown in the region, contributing 58% of the total production, with soybeans second most productive but substantially less (20%) despite similar harvested area. Maximum year-to-year variability in P was high, generally greater than 30% for most counties, though exceeding 80% for some counties.

DOI

[6]
Zhao M, Running S W.Drought-induced reduction in global terrestrial net primary production from 2000 through 2009[J]. Science, 2010,329(5994):940-943.Terrestrial net primary production (NPP) quantifies the amount of atmospheric carbon fixed by plants and accumulated as biomass. Previous studies have shown that climate constraints were relaxing with increasing temperature and solar radiation, allowing an upward trend in NPP from 1982 through 1999. The past decade (2000 to 2009) has been the warmest since instrumental measurements began, which could imply continued increases in NPP; however, our estimates suggest a reduction in the global NPP of 0.55 petagrams of carbon. Large-scale droughts have reduced regional NPP, and a drying trend in the Southern Hemisphere has decreased NPP in that area, counteracting the increased NPP over the Northern Hemisphere. A continued decline in NPP would not only weaken the terrestrial carbon sink, but it would also intensify future competition between food demand and proposed biofuel production.

DOI PMID

[7]
Nayak R K, Patel N, Dadhwal V.Estimation and analysis of terrestrial net primary productivity over India by remote-sensing-driven terrestrial biosphere model[J]. Environmental monitoring and assessment, 2010,170(1-4):195-213.In the present study, the Carnegie&#8211;Ames&#8211;Stanford Approach (CASA), a terrestrial biosphere model, has been used to investigate spatiotemporal pattern of net primary productivity (NPP) during 2003 over the Indian subcontinent. The model drivers at 2-min spatial resolution were derived from National Oceanic and Atmospheric Administration advanced very high resolution radiometer normalized difference vegetation index, weather inputs, and soil and land cover maps. The annual NPP was estimated to be 1.57&nbsp;Pg&nbsp;C (at the rate of 544&nbsp;g&nbsp;C&nbsp;m<sup>&#8201;&#8722;&#8201;2</sup>), of which 56% contributed by croplands (with 53% of geographic area of the country (GAC)), 18.5% by broadleaf deciduous forest (15% of GAC), 10% by broadleaf evergreen forest (5% of GAC), and 8% by mixed shrub and grassland (19% of GAC). There is very good agreement between the modeled NPP and ground-based cropland NPP estimates over the western India (<i>R</i> <sup>2</sup>&#8201;=&#8201;0.54; <i>p</i>&#8201;=&#8201; 0.05). The comparison of CASA-based annual NPP estimates with the similar products from other operational algorithms such as C-fix and Moderate Resolution Imaging Spectroradiometer (MODIS) indicate that high agreement exists between the CASA and MODIS products over all land covers of the country, while agreement between CASA and C-Fix products is relatively low over the region dominated by agriculture and grassland, and the agreement is very low over the forest land. Sensitivity analysis suggest that the difference could be due to inclusion of variable light use efficiency (LUE) across different land cover types and environment stress scalars as downregulator of NPP in the present CASA model study. Sensitivity analysis further shows that the CASA model can overestimate the NPP by 50% of the national budget in absence of downregulators and underestimate the NPP by 27% of the national budget by the use of constant LUE (0.39&nbsp;gC&nbsp;MJ<sup>&#8201;&#8722;&#8201;1</sup>) across different vegetation cover types.

DOI PMID

[8]
Singh R, Rovshan S, Goroshi S, et al.Spatial and temporal variability of net primary productivity (NPP) over terrestrial biosphere of India using NOAA-AVHRR based GloPEM model[J]. Journal of the Indian Society of Remote Sensing, 2011,39(3):345-353.Abstract<br/>The monitoring of terrestrial carbon dynamics is important in studies related with global climate change. This paper presents results of the inter-annual variability of Net Primary Productivity (NPP) from 1981 to 2000 derived using observations from NOAA-AVHRR data using Global Production Efficiency Model (GloPEM). The GloPEM model is based on physiological principles and uses the production efficiency concept, in which the canopy absorption of photosynthetically active radiation (APAR) is used with a conversion “efficiency” to estimate Gross Primary Production (GPP). NPP derived from GloPEM model over India showed maximum NPP about 3,000 gCm<sup class="a-plus-plus">−2</sup>year<sup class="a-plus-plus">−1</sup> in west Bengal and lowest up to 500 gCm<sup class="a-plus-plus">−2</sup>year<sup class="a-plus-plus">−1</sup> in Rajasthan. The India averaged NPP varied from 1,084.7 gCm<sup class="a-plus-plus">−2</sup>year<sup class="a-plus-plus">−1</sup> to 1,390.8 gCm<sup class="a-plus-plus">−2</sup>year<sup class="a-plus-plus">−1</sup> in the corresponding years of 1983 and 1998 respectively. The regression analysis of the 20 year NPP variability showed significant increase in NPP over India (<em class="a-plus-plus">r</em> = 0.7, <em class="a-plus-plus">F</em> = 17.53, <em class="a-plus-plus">p</em> &lt; 0.001). The mean rate of increase was observed as 10.43 gCm<sup class="a-plus-plus">−2</sup>year<sup class="a-plus-plus">−1</sup>. Carbon fixation ability of terrestrial ecosystem of India is increasing with rate of 34.3 TgC annually (<em class="a-plus-plus">t</em> = 4.18, <em class="a-plus-plus">p</em> &lt; 0.001). The estimated net carbon fixation over Indian landmass ranged from 3.56 PgC (in 1983) to 4.57 PgC (in 1998). Grid level temporal correlation analysis showed that agricultural regions are the source of increase in terrestrial NPP of India. Parts of forest regions (Himalayan in Nepal, north east India) are relatively less influenced over the study period and showed lower or negative correlation (trend). Finding of the study would provide valuable input in understanding the global change associated with vegetation activities as a sink for atmospheric carbon dioxide.<br/>

DOI

[9]
Nayak R K, Patel N R, Dadhwal V K.Inter-annual variability and climate control of terrestrial net primary productivity over India[J]. International Journal of Climatology, 2013,33(1):132-142.Using satellite observations of Normalized Difference Vegetation Index together with climate data from other sources in a terrestrial biosphere model, inter-annual variability of Net Primary Productivity (NPP) over India during 1981-2006 was studied. It is revealed that the variability is large over mixed shrub and grassland (MGL), moderate over cropland and small over the forest regions. Inter-annual variability of NPP exhibits strong positive coherence with the variability of precipitation, and weak coherence with the variability of temperature and solar radiation. Estimated linear growth rate of annual NPP is 0.005 Pg C Yr (2) which is equivalent to 8.5% over the country during past 25 years. This increase is primarily due to the enhancement of productivity over agricultural lands in the country. NPP has increased over most parts of the country during the early 15-year period (1981-1995) resulting in a 10% growth rate of national NPP budget. On the other hand, the NPP growth rate has been reduced to 2.5% during later 15 years period (1991-2005) owing to large decline of NPP over the Indo-Gangetic plains. Climate had a strong control on NPP growth rate during both the periods. Copyright (C) 2012 Royal Meteorological Society

DOI

[10]
Piao S, Wang X, Ciais P, et al.Changes in satellite-derived vegetation growth trend in temperate and boreal Eurasia from 1982 to 2006[J]. Global Change Biology,2011,17(10):3228-3239.Abstract Monitoring changes in vegetation growth has been the subject of considerable research during the past several decades, because of the important role of vegetation in regulating the terrestrial carbon cycle and the climate system. In this study, we combined datasets of satellite-derived Normalized Difference Vegetation Index (NDVI) and climatic factors to analyze spatio-temporal patterns of changes in vegetation growth and their linkage with changes in temperature and precipitation in temperate and boreal regions of Eurasia (> 23.5°N) from 1982 to 2006. At the continental scale, although a statistically significant positive trend of average growing season NDVI is observed (0.5 × 10 613 year 611 , P = 0.03) during the entire study period, there are two distinct periods with opposite trends in growing season NDVI. Growing season NDVI has first significantly increased from 1982 to 1997 (1.8 × 10 613 year 611 , P < 0.001), and then decreased from 1997 to 2006 (611.3 × 10 613 year 611 , P = 0.055). This reversal in the growing season NDVI trends over Eurasia are largely contributed by spring and summer NDVI changes. Both spring and summer NDVI significantly increased from 1982 to 1997 (2.1 × 10 613 year 611 , P = 0.01; 1.6 × 10 613 year 611 P < 0.001, respectively), but then decreased from 1997 to 2006, particularly summer NDVI which may be related to the remarkable

DOI

[11]
赵国帅, 王军邦, 范文义, 等. 2000-2008年中国东北地区植被净初级生产力的模拟及季节变化[J].应用生态学报,2011,22(3):621-630.lt;p>利用GLOPEM-CEVSA模型模拟并分析了中国东北地区2000-2008年植被净初级生产力(NPP)时空分布格局及其影响因素,并以4个森林生态站点(大兴安岭、老爷岭、凉水和长白山森林生态站)为例研究了东北地区森林NPP季节变化特征及其环境驱动.结果表明:2000-2008年,东北地区植被年均NPP为445 g C&middot;m<sup>-2</sup>&middot;a<sup>-1</sup>;整个研究区沿长白山山脉到小兴安岭山脉地区以及三江平原部分地区的NPP最高,沿长白山山脉到小兴安岭山脉西侧的辽河平原、松嫩平原东部、三江平原和大兴安岭地区次之,西部稀疏草原和荒漠地区的NPP最低.东北地区森林生态系统年均NPP最高,其次为灌丛、农田和草地,荒漠最低.森林生态系统中,针阔混交林年均NPP最大(722 g C&middot;m<sup>-2</sup>&middot;a<sup>-1</sup>),落叶针叶林年均NPP最小(451g C&middot;m<sup>-2</sup>&middot;a<sup>-1</sup>).〖JP〗研究期间,森林NPP无显著年际变化,其中2007、2008年较往年NPP大幅增加,很可能与该地区期间气温上升有关(较往年偏高1 ℃~2 ℃).东北地区森林自北向南生长季开始时间逐渐提前,生长季变长.</p>

[12]
Wang J, Liu J, Cao M, et al.Modelling carbon fluxes of different forests by coupling a remote-sensing model with an ecosystem process model[J]. International Journal of Remote Sensing, 2011,32(21):6539-6567.range of 0.64 to 0.87. This work demonstrates the potential of GLOPEM-CEVSA to quantify the spatial patterns and temporal dynamics of terrestrial ecosystem carbon sources and sinks with consideration of the spatial heterogeneity of ecosystems based on remote sensing.

DOI

[13]
Wang J, Dong J, Liu J, et al.Comparison of gross primary productivity derived from GIMMS NDVI3g, GIMMS, and MODIS in Southeast Asia[J]. Remote Sensing, 2014,6(3):2108-2133.中国科学院机构知识库(中国科学院机构知识库网格(CAS IR GRID))以发展机构知识能力和知识管理能力为目标,快速实现对本机构知识资产的收集、长期保存、合理传播利用,积极建设对知识内容进行捕获、转化、传播、利用和审计的能力,逐步建设包括知识内容分析、关系分析和能力审计在内的知识服务能力,开展综合知识管理。

DOI

[14]
王军邦,刘纪远,邵全琴,等.基于遥感-过程耦合模型的1988-2004年青海三江源区净初级生产力模拟[J].植物生态学报,2009,33(2):254-269.三江源区不仅是地处青藏高原的全球气候变化的敏感区, 也是我国甚至亚洲最重要河流的上游关键源区。作为提供物质基础的植被净初级生产力(Net primary production, <EM>NPP</EM>), 是评价生态系统状况的重要指标。该文应用已在碳通量观测塔验证, 扩展到区域水平的遥感-过程耦合模型GLOPEM-CEVSA, 以空间插值的气象数据和1 km分辨率的AVHRR遥感反演的FPAR数据为模型主要输入, 模拟并分析了1988~2004年该区<EM>NPP</EM>时空格局及其控制机制。结果表明, 该区植被平均<EM>NPP</EM>为143.17 gC·m<SUP>–2</SUP>·a<SUP>–1</SUP> 呈自东南向西北逐渐降低的空间格局, 其中, 以森林<EM>NPP</EM>最高(267.90 gC·m<SUP>–2</SUP>·a<SUP>–1</SUP>), 其次为农田(222.94 gC·m<SUP>–2</SUP>·a<SUP>–1</SUP>)、草地(160.90 gC·m<SUP>–2</SUP>·a<SUP>–1</SUP>)和湿地(161.36 gC·m<SUP>–2</SUP>·a<SUP>–1</SUP>), 荒漠最低(36.13 gC·m<SUP>–2</SUP>·a<SUP>–1</SUP>)。其年际变化趋势在空间上呈现出明显的差异, 西部地区<EM>NPP</EM>表现为增加趋势, 每10 a增加7.8~28.8 gC·m<SUP>–2</SUP>; 而中、东部表现为降低趋势, 每10 a降低13.1~42.8 gC·m<SUP>–2</SUP>。根据显著性检验, <EM>NPP</EM>呈增加趋势(趋势斜率b&gt;0), 显著性水平高于99%和95%的区域占研究区总面积的13.43%和20.34%, 主要分布在西部地区; <EM>NPP</EM>呈降低趋势(趋势斜率b&lt;0), 显著性水平高于99%和95%的区域占研究区面积的0.75%和3.77%, 主要分布在中、东部地区, 尤以该区长江和黄河等沿线区分布更为集中, 变化显著性也更高。三江源<EM>NPP</EM>的年际变化趋势的气候驱动力分析表明, 整个区域水平上该地区植被生产力受气候变化的主导, 西部地区暖湿化趋势, 造成了该地区生产力较为明显的、大范围的增加趋势; 但东、中部地区则主要受人类活动的影响, 特别是长江、黄河等河流沿线, 是人类居住活动密集的地区, 造成这些地区放牧压力较大、草地退化严重, 而该地区暖干化趋势加剧了这一过程。

DOI

[15]
Toms J D, Lesperance M L.Piecewise regression: A tool for identifying ecological thresholds[J]. Ecology, 2003,84(8):2034-2041.

DOI

[16]
Tome A R, Miranda P M A. Piecewise linear fitting and trend changing points of climate parameters[J]. Geophysical Research Letters, 2004,31(2):L02207.ABSTRACT Finding an overall linear trend is a common method in scientific studies. It is almost a requirement when one intends to study variability. Nevertheless, when dealing with long climate temporal series, fitting a straight line only seldom has a relevant meaning. This paper proposes and describes a new methodology for finding overall trends, and, simultaneously, for computing a new set of climate parameters: the breakpoints between periods with significantly different trends. The proposed methodology uses a least-squares approach to compute the best continuous set of straight lines that fit a given time series, subject to a number of constraints on the minimum distance between breakpoints and on the minimum trend change at each breakpoint. The method is tested with three climate time series.

DOI

[17]
王少鹏,王志恒,朴世龙,等.我国40年来增温时间存在显著的区域差异[J]. 科学通报,2010,55(16):1538-1543.lt;p>过去几十年全球温度经历了显著的变化, 评估其变化的方法无疑十分重要. 过去评估气温变化趋势的通用方法是利用线性回归计算温度在一个时间段内的整体变化率. 但是, 不同时期的温度变化率往往是不同的, 即温度变化过程中存在趋势转折点. 这使得整体变化率只能反映温度变化的一个方面, 可能掩盖某些阶段性特征. 因此, 为了更准确地描述我国近几十年来的温度变化过程及其空间特征, 使用分段线性回归方法分析了1961~2004年全国536个气象站点的年均温序列. 结果表明: 我国近40年来的年均温变化趋势存在显著的转折点, 全国平均升温开始于1984年, 增温率为0.058℃/a. 在1984年以前, 年均温无显著变化. 从站点水平看, 我国升温开始时间呈现由北向南逐渐推迟的空间格局: 北方地区(40&deg;N以北)升温开始于20世纪70年代, 而南方大部分地区(40&deg;N以南)在20世纪80年代开始升温. 特别地, 青藏高原升温始于1983年. 此外, 不同地区的增温率存在较大差异. 全国大部分地区升温率在0.05℃/a以上, 新疆个别站点甚至达到0.1℃/a以上, 但四川盆地、华中和华南地区升温率相对较低, 在0.025~0.05℃/a之间. 增温时间及变率的区域差异可能与寒潮和积雪的反馈作用有关.</p>

[18]
Ferrarini A, Rossi P, Rossi O.Ascribing ecological meaning to habitat shape by means of a piecewise regression approach to fractal domains[J]. Landscape Ecology, 2005,20(7):799-809.lt;a name="Abs1"></a>A fractal dimension (FD) indicates the ability of a set of structures to fill the Euclidean space where it is embedded. For habitat boundaries, FD is bound to a plane, thus 1&nbsp;&#8804;&nbsp;FD &nbsp;&#8804;&nbsp;2. FD is low for simple shapes and increases as patches become more irregular. Some authors have found that FD metric delineating area-perimeter relation (APR) is best fitted through piecewise linear curves, where the slope of each line segment is one-half the FD over the corresponding scaling region. The detection of shifts in boundary FD of landscape habitats is a significant issue in ecology, since discontinuities could be an index of a substantial modification of the processes and dynamics that generate and maintain habitats. This work makes use of fractal analysis to examine the relationship between anthropogenic processes and habitat spatial patterns. It proposes two goals (1) suggesting Multivariate Adaptive Regression Splines (MARS?) as a fast and effective approach to discover shifts in APR of landscape patches; (2) explaining the substantial existence of such shifts using a set of human-related predictor variables. MARS methodology has been applied to 6 types of habitats within the Baganza stream watershed (Parma, Italy) and the discovered patterns have been correlated with anthropogenic variables that could influence APR. A standardized linear discriminant analysis (DA) has been used to predict FDs from the set of the employed predictors. DA corroborated the existence of breakpoints in APR and explained the contribute of predictor variables in determining the discovered shifts.

DOI

[19]
Ficetola G F, Denoel M.Ecological thresholds: an assessment of methods to identify abrupt changes in species-habitat relationships[J]. Ecography,2009,32(6):1075-1084.Habitat thresholds are usually defined as 鈥減oints of abrupt change鈥 in the species-habitat relationships. Habitat thresholds can be a key tool for understanding species requirements, and provide an objective definition of conservation targets, by identifying when habitat loss leads to a rapid loss of species, and the minimum amount of habitat necessary for species persistence. However, a large variety of statistical methods have been used to analyse them. In this context, we reviewed these methods and, using simulated data sets, we tested the main models to compare their performance on the identification of thresholds. We show that researchers use very different analytical tools, corresponding to different operational definitions of habitat thresholds, which can considerably affect their detection. Piecewise regression and generalized additive models allow both the distinction between linear and nonlinear dynamics, and the correct identification of break point position. In contrast, other methods such as logistic regression fail because they may incorrectly detect thresholds in gradual patterns, or they may over or underestimate the threshold position. In conservation or habitat modelling, it is important to focus efforts efficiently and the inappropriate choice of statistical methods may have detrimental consequences.

DOI

[20]
Sun J, Wang X, Chen A, et al.NDVI indicated characteristics of vegetation cover change in China's metropolises over the last three decades[J]. Environmental Monitoring and Assessment, 2011,179(1-4):1-14.How urban vegetation was influenced by three decades of intensive urbanization in China is of great interest but rarely studied. In this paper, we used satellite derived Normalized Difference Vegetation Index (NDVI) and socioeconomic data to evaluate effects of urbanization on vegetation cover in China&#8217;s 117 metropolises over the last three decades. Our results suggest that current urbanization has caused deterioration of urban vegetation across most cities in China, particularly in East China. At the national scale, average urban area NDVI (NDVI<sub>u</sub>) significantly decreased during the last three decades (<i>P</i>&#8201;&lt;&#8201;0.01), and two distinct periods with different trends can be identified, 1982&#8211;1990 and 1990&#8211;2006. NDVI<sub>u</sub> did not show statistically significant trend before 1990 but decrease remarkably after 1990 (<i>P</i>&#8201;&lt;&#8201;0.01). Different regions also showed difference in the timing of NDVI<sub>u</sub> turning point. The year when NDVI<sub>u</sub> started to decline significantly for Central China and East China was 1987 and 1990, respectively, while NDVI<sub>u</sub> in West China remained relatively constant until 1998. NDVI<sub>u</sub> changes in the Yangtze River Delta and the Pearl River Delta, two regions which has been undergoing the most rapid urbanization in China, also show different characteristics. The Pearl River Delta experienced a rapid decline in NDVI<sub>u</sub> from the early 1980s to the mid-1990s; while in the Yangtze River Delta, NDVI<sub>u</sub> did not decline significantly until the early 1990s. Such different patterns of NDVI<sub>u</sub> changes are closely linked with policy-oriented difference in urbanization dynamics of these regions, which highlights the importance of implementing a sustainable urban development policy.

DOI PMID

[21]
Wang X, Piao S, Ciais P, et al.Spring temperature change and its implication in the change of vegetation growth in North America from 1982 to 2006[J]. Proceedings of the National Academy of Sciences of the United States of America, 2011,108(4):1240-1245.Understanding how vegetation growth responds to climate change is a critical requirement for projecting future ecosystem dynamics. Parts of North America (NA) have experienced a spring cooling trend over the last three decades, but little is known about the response of vegetation growth to this change. Using observed climate data and satellite-derived Normalized Difference Vegetation Index (NDVI) data from 1982 to 2006, we investigated changes in spring (April-May) temperature trends and their impact on vegetation growth in NA. A piecewise linear regression approach shows that the trend in spring temperature is not continuous through the 25-year period. In the northwestern region of NA, spring temperature increased until the late 1980s or early 1990s, and stalled or decreased afterwards. In response, a spring vegetation greening trend, which was evident in this region during the 1980s, stalled or reversed recently. Conversely, an opposite phenomenon occurred in the northeastern region of NA due to different spring temperature trends. Additionally, the trends of summer vegetation growth vary between the periods before and after the turning point (TP) of spring temperature trends. This change cannot be fully explained by summer drought stress change alone and is partly explained by changes in the trends of spring temperature as well as those of summer temperature. As reported in previous studies, summer vegetation browning trends have occurred in the northwestern region of NA since the early 1990s, which is consistent with the spring and summer cooling trends in this region during this period.

DOI PMID

[22]
Lund R, Reeves J.Detection of undocumented changepoints: A revision of the two-phase regression model[J]. Journal of Climate, 2002,15(17):2547-2554.Abstract Changepoints (inhomogeneities) are present in many climatic time series. Changepoints are physically plausible whenever a station location is moved, a recording instrument is changed, a new method of data collection is employed, an observer changes, etc. If the time of the changepoint is known, it is usually a straightforward task to adjust the series for the inhomogeneity. However, an undocumented changepoint time greatly complicates the analysis. This paper examines detection and adjustment of climatic series for undocumented changepoint times, primarily from single site data. The two-phase regression model techniques currently used are demonstrated to be biased toward the conclusion of an excessive number of unobserved changepoint times. A simple and easily applicable revision of this statistical method is introduced.

DOI

[23]
Bala G, Joshi J, Chaturvedi R K, et al.Trends and variability of AVHRR-derived NPP in India[J]. Remote Sensing, 2013,5(2):810-829.In this paper, we estimate the trends and variability in Advanced Very High Resolution Radiometer (AVHRR)-derived terrestrial net primary productivity (NPP) over India for the period 1982-2006. We find an increasing trend of 3.9% per decade (r = 0.78, R-2 = 0.61) during the analysis period. A multivariate linear regression of NPP with temperature, precipitation, atmospheric CO2 concentration, soil water and surface solar radiation (r = 0.80, R-2 = 0.65) indicates that the increasing trend is partly driven by increasing atmospheric CO2 concentration and the consequent CO2 fertilization of the ecosystems. However, human interventions may have also played a key role in the NPP increase: non-forest NPP growth is largely driven by increases in irrigated area and fertilizer use, while forest NPP is influenced by plantation and forest conservation programs. A similar multivariate regression of interannual NPP anomalies with temperature, precipitation, soil water, solar radiation and CO2 anomalies suggests that the interannual variability in NPP is primarily driven by precipitation and temperature variability. Mean seasonal NPP is largest during post-monsoon and lowest during the pre-monsoon period, thereby indicating the importance of soil moisture for vegetation productivity.

DOI

文章导航

/