
基于人类时空活动的城市土地利用分类研究
作者简介:鲁国珍(1991-),女,陕西西安人,硕士生,研究方向为时空数据分析与挖掘。E-mail: guozhen3963@gmail.com
收稿日期: 2015-10-10
要求修回日期: 2015-10-28
网络出版日期: 2015-12-20
基金资助
国家自然科学基金项目(41371377、41501486)
中国博士后基金项目(2015M572364)
CCF-腾讯犀牛鸟科研基金项目(CCF-TencentARG20150101)
城市空间信息工程北京市重点实验室经费重点项目(2014101)
深圳市科技研发基金项目(ZDSY20121019111146499、JCYJ20121019111128765)
Land Use Classification Based on Massive Human-Activity Spatio-temporal Data
Received date: 2015-10-10
Request revised date: 2015-10-28
Online published: 2015-12-20
Copyright
准实时监测城市发展、掌握城市土地利用类型是日趋科学化、合理化进行城市规划的基本要求。随着信息通信技术、移动互联网技术、位置服务等的发展,海量的手机数据、浮动车数据、公交卡数据、社交网络数据等在内的人类时空活动信息为从“人”的角度动态实时感知城市土地利用、空间结构提供了可能。本文以深圳市为例,基于百万名QQ用户2013年的电子足迹数据,提出了不同类型的人类时空活动指数,以建立人类活动与城市地物间的对应关系;借鉴遥感影像不同波段记录各类地物在特定波谱区间辐射值的思想,生成各类人类时空活动指数波段图;并利用最大似然法对该“类高光谱影像”进行城市土地监督分类,获取城市的土地利用图。通过与深圳市规划图的对比验证,全体分类精度为72%。相较于传统基于“物”的遥感探测手段,基于“人”的城市感知更能反映城市内部相同地类的发展差异性。
鲁国珍 , 常晓猛 , 李清泉 , 赵庆亮 . 基于人类时空活动的城市土地利用分类研究[J]. 地球信息科学学报, 2015 , 17(12) : 1497 -1505 . DOI: 10.3724/SP.J.1047.2015.01497
Macroscopically monitoring the status of urbanization and fast acquiring the land covers or land use in urban areas is essential for urban planning, management and scientific policy-making. The rapidly developing remote sensing technologies have been recognized as an essential approach to carry out this work because of their vital ability to capture the physical features of different land use, such as the spectral and textural properties. However, these technologies could not reveal the heterogeneity of urban development and differentiate the vitality in and among cities with the similar physical properties interpreted from remote sensing images. Human-activity based sensing technologies nowadays have been recognized as a promising alternative to resolve these problems. Spatio-temporal distribution of human activities could be derived from mobile phone records and smart card records stored in the public transportation systems, social media or social networking services (SNSs), and etc. They are good indicators for the social function of land use and urban vitality. We proposed types of indices to bridge the relationships between the intensities of human activities and land covers. Similar to the spectral bands of remote sensing images, more than thirty social bands were generated in this paper to describe the social characteristics of ground objects by aggregating and gridding human activities into pixels. According to the spectral profiles of eight land covers, a supervised classification approach was then applied to infer the land covers of the research area. Validation experiments were conducted in Shenzhen, China using a large-scale of people’s historical login information on Tencent QQ, which is the most popular SNS, during 2013. Results showed that the land cover of Shenzhen could be determined with a detection rate of 72% according to an urban planning map of Shenzhen. Compared to the classification results from remote sensing images, the human-activity based sensing technologies can obtain more detailed insight into the urban form, city skeleton, and the heterogeneity of development and vitality in different urban areas.
Key words: huamn activity; digital footprints; social network data; land use; land cover; classification
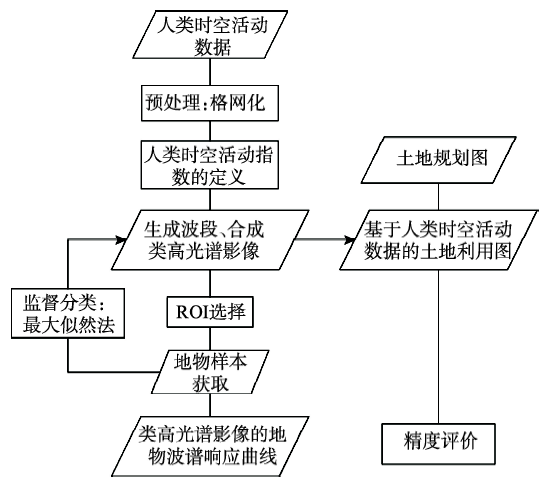
Fig. 1 Framework of urban land user classification using human-activity tracking data图1 基于人类时空活动提取土地利用类型的流程图 |
Tab. 1 The description of human activity bands表1 人类活动指数描述 |
| 指数 | 波段 | 波段全称 | 公式 | 统计方式 | 指数含义 |
|---|---|---|---|---|---|
| NV | NWV | Number of Whole Visitors | 反映格网被访问的人数,用以提取诸如博物馆、公园、旅游景点等访问人数很高的区域 | ||
| NLV | Number of Local Visitors | ||||
| NOV | Number of Outside Visitors | ||||
| TIV | TDW | Total Visit Days of Whole Visitors | 用户访问总天数 | 反映格网被访问的人次,用于提取诸如工作地、住宅地等被频繁访问的区域 | |
| TDL | Total Visit Days of Local Visitors | ||||
| TDO | Total Visit Days of Outside Visitors | ||||
| TTW | Total Visit Times of Whole Visitors | 用户访问总次数 | |||
| TTL | Total Visit Times of Local Visitors | ||||
| TTO | Total Visit Times of Outside Visitors | ||||
| AIV | ADW | Average Visit Days of Whole Visitors | 用户访问总天数 | 访问人次与访问人数的比值 | |
| ADL | Average Visit Days of Local Visitors | ||||
| ADO | Average Visit Days of Outside Visitors | ||||
| ATW | Average Visit Times of Whole Visitors | 用户访问总次数 | |||
| ATL | Average Visit Times of Local Visitors | ||||
| ATO | Average Visit Times of Outside Visitors | ||||
| ADWPLR | Averge Visit Days of Whole Visitors by Per-capita Local Resident | 用户访问总天数 | 访问人次与本地用户密度的比值 | ||
| ADLPLR | Averge Visit Days of Local Visitors by Per-capita Local Resident | ||||
| ADOPLR | Averge Visit Days of Outside Visitors by Per-capita Local Resident | ||||
| ATWPLR | Average Visit Times of Whole Visitors by Per-capita Local Resident | 用户访问总次数 | |||
| ATLPLR | Average Visit Times of Local Visitors by Per-capita Local Resident | ||||
| ATOPLR | Average Visit Times of Outside Visitors by Per-capita Local Resident |
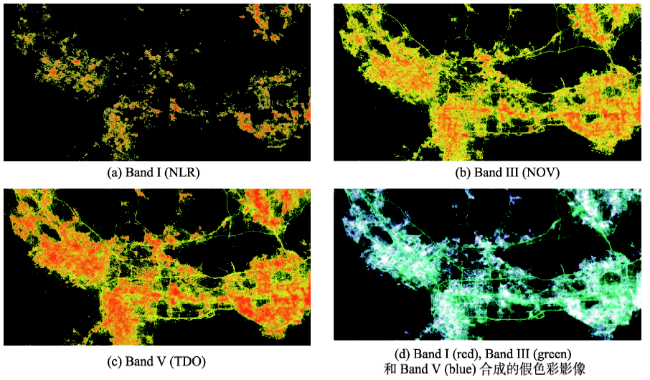
Fig. 2 Example of three bands and their false color composite image derived from human-activity sensing images图2 “类高光谱影像”的示例波段及合成的假彩色影像 |
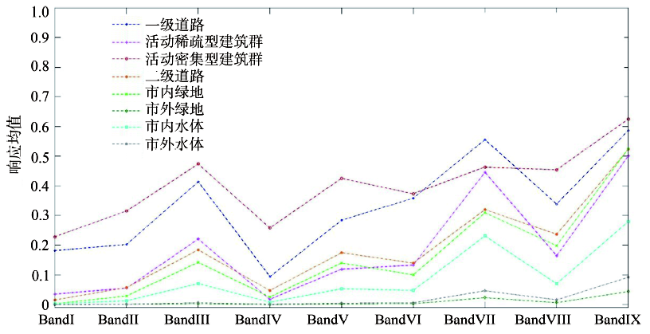
Fig. 3 Spectral profiles derived from human sensing images of nine major land cover types in Shenzhen area图3 深圳地区的“类高光谱影像”的波谱响应曲线 |
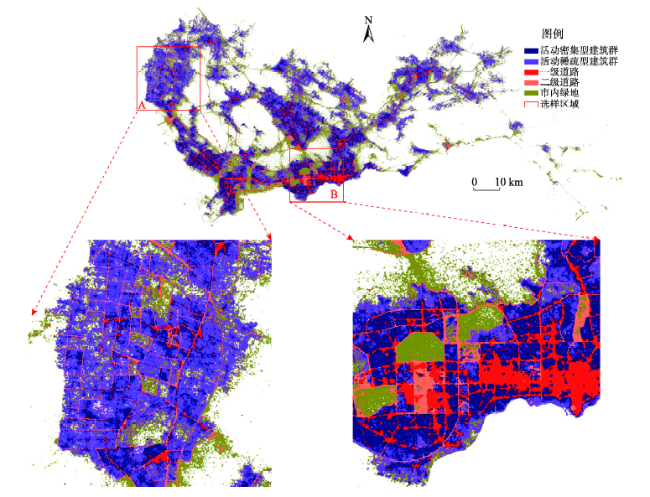
Fig. 4 Result of land use classification in Shenzhen图4 深圳市的土地利用分类结果图 |
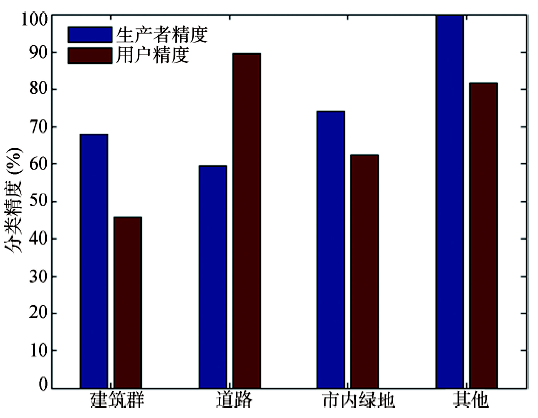
Fig. 5 Producer’s and user’s accuracies of the classification图5 分类结果的用户精度、生产者精度 |
Tab. 2 Confusion matrix of the classification表2 分类结果的混淆矩阵 |
| 建筑群 | 道路 | 市内绿地 | 其他 | |
|---|---|---|---|---|
| 建筑群 | 0.6807 | 0.2037 | 0.0903 | 0 |
| 道路 | 0.1171 | 0.5955 | 0.0602 | 0 |
| 市内绿地 | 0.1431 | 0.1913 | 0.7398 | 0.0024 |
| 其他 | 0.0591 | 0.0095 | 0.1097 | 0.9976 |
The authors have declared that no competing interests exist.
| [1] |
|
| [2] |
|
| [3] |
|
| [4] |
|
| [5] |
|
| [6] |
|
| [7] |
|
| [8] |
|
| [9] |
|
| [10] |
从鬼城看中国城市化前景.
|
| [11] |
|
| [12] |
|
| [13] |
|
| [14] |
|
| [15] |
|
| [16] |
|
| [17] |
|
| [18] |
|
| [19] |
|
| [20] |
|
| [21] |
|
| [22] |
|
| [23] |
|
| [24] |
|
| [25] |
|
| [26] |
|
| [27] |
|
| [28] |
|
| [29] |
|
| [30] |
|
| [31] |
微信光芒万丈,拥有8亿月活跃用户的QQ到底在想什么?.
|
| [32] |
2014年深圳市常住人口中户籍与非户籍人口数.
|
| [33] |
腾讯QQ同时在线人数突破2亿.
|
| [34] |
|
| [35] |
|
| [36] |
|
/
| 〈 |
|
〉 |