
基于信息量模型的涪陵区地质灾害易发性评价
作者简介:谭玉敏(1977-),女,博士,副教授,研究方向为遥感与GIS应用。E-mail:tanym@buaa.edu.cn
收稿日期: 2015-03-24
要求修回日期: 2015-06-10
网络出版日期: 2015-12-20
基金资助
2013国家卫星及应用高技术产业化专项“基于国产卫星应用技术的三峡库区生态环境动态监测与应急服务示范”
Geological Hazard Risk Assessment Based on Information Quantity Model in Fuling District, Chongqing City, China
Received date: 2015-03-24
Request revised date: 2015-06-10
Online published: 2015-12-20
Copyright
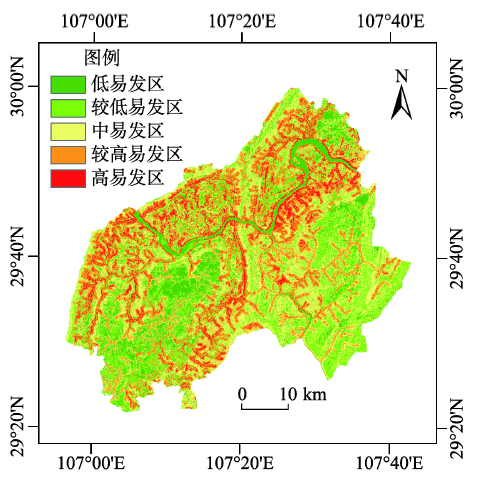
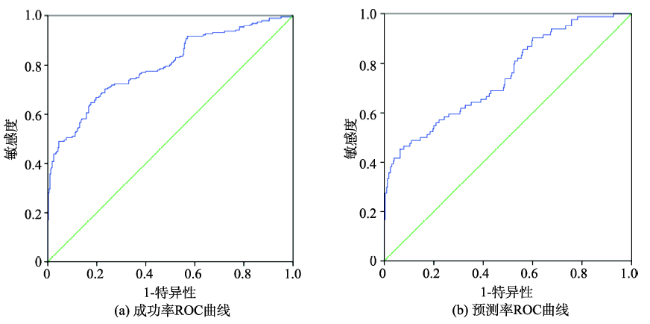
本文以重庆涪陵区为研究区域,选取坡度、坡向、累计汇水面积、地层岩性、水域、降雨量、植被和土地利用分类8个影响因子,提取高分一号遥感数据(2013.12.24)动态影响因子,引入信息量模型,分别计算上述影响因子对应的信息量,对该时期示范区的地质灾害危险性进行评价,并引入ROC曲线和AUC评价指标,对得到的区域地质灾害易发性评价结果进行精度评估。结果显示,2013年12月研究区内高易发区面积占总面积的9.73%,该易发区内含有104个地质灾害点,占所有灾害点的52.7%,灾积比为5.42,明显大于其他易发等级类别。利用ROC评价方法,计算成功率曲线AUC为0.796,预测率曲线AUC为0.748(74.8%),具有较高的可靠性,证明本文方法在该区域地质灾害易发性评价的适应性良好。
谭玉敏 , 郭栋 , 白冰心 , 许波 . 基于信息量模型的涪陵区地质灾害易发性评价[J]. 地球信息科学学报, 2015 , 17(12) : 1554 -1562 . DOI: 10.3724/SP.J.1047.2015.01554
Using geospatial technologies to assess geological hazard risk has been proved feasible, effective and important in the southwest of China, which is featured by mountainous landscape and the population density is very large. The main objective of this study is to make the risk assessment of the geological hazards in Fuling district using information quantity model, and eight triggering factors are used, including slope, aspect, cumulative catchment area, formation lithology, distances to water, precipitation, vegetation, and land use/land cover type respectively. GaoFen-1 image of December 24, 2013 is used to extract two dynamic triggering factors, vegetation and land use, and precipitation is also taken as a dynamic triggering factor. All triggering factors were then used to construct an information model to assess and predict the geological hazards in the study area in December 2013, producing a geological hazard risk distribution map. Finally, ROC curve was used to validate the information model. The statistical results indicate that the areas with high risk zone is about 9.73% of the entire area and that the percentage of the geological hazards sites is about 52.7% of the entire geological hazards sites. And it shows a satisfactory consistency between the susceptibility map and the geological hazard locations. The AUC of success-rate ROC of 0.796 and the AUC of prediction-rate ROC of 0.748 demonstrate the robustness and relatively good reliability of the information quantity model. Above all, the model can be applied to interpret and predict the geological hazard occurrences in the study area.
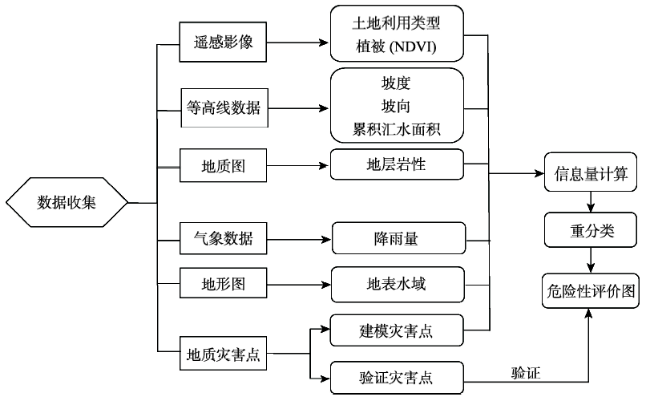
Fig. 1 Methodology flow chart图1 地质灾害易发性评价流程 |
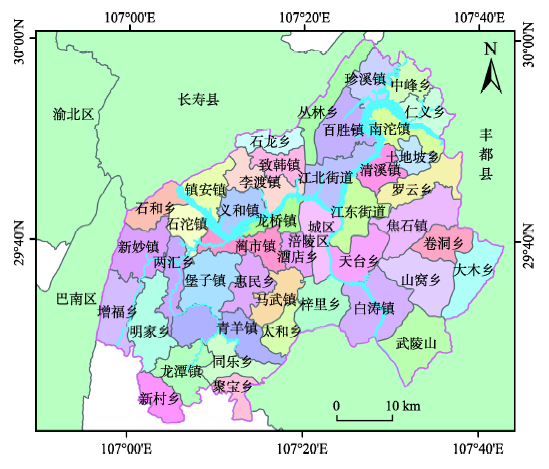
Fig. 2 Study area图2 研究区位置 |
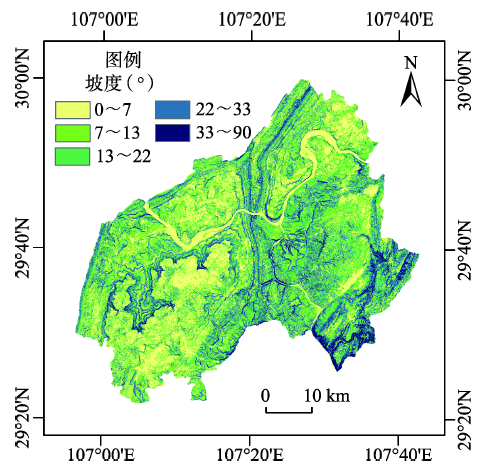
Fig. 3 Slope distribution图3 坡度分布图 |
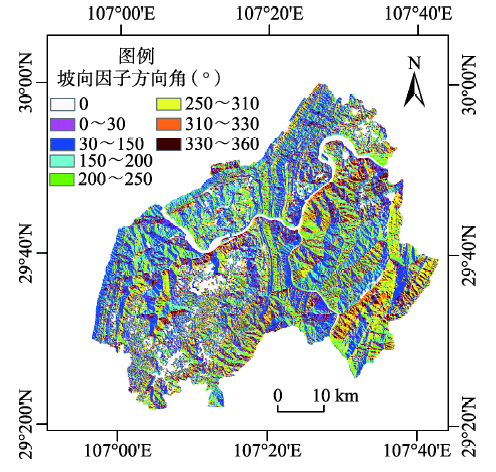
Fig. 4. Slope aspect distribution图4 坡向分布图 |
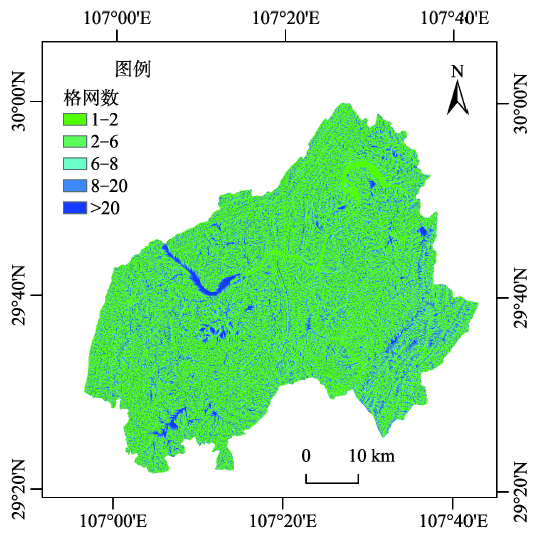
Fig. 5 Cumulative catchment area图5 累计汇水面积分布图 |
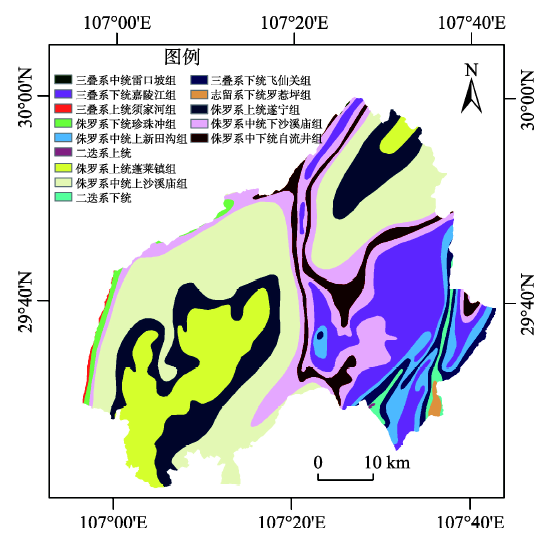
Fig. 6 Formation lithology图6 地层岩性(地质因子)分布图 |
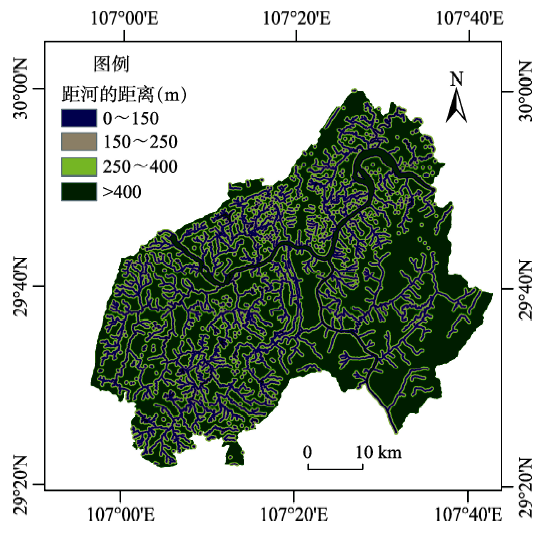
Fig. 7 Multiple buffer zones of surface stream and river network图7 水域缓冲(地表水因子)分布图 |
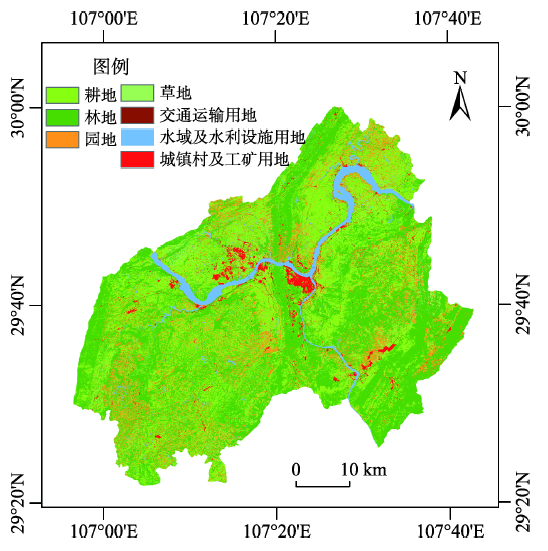
Fig. 8 Land use/Land cover map图8 土地利用分类图 |
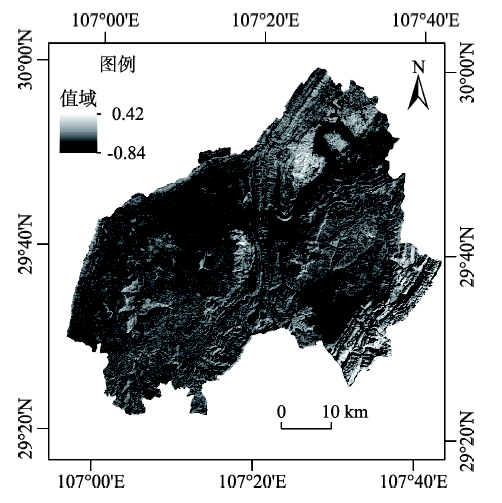
Fig. 9 Vegetation NDVI distribution map图9 植被(NDVI)分布 |
Tab. 1 Example of precipitation in Fuling district表1 涪陵区部分降雨量信息 |
| 站点 | 日降雨 | rain5d | rain4d | rain3d | rain2d | rain1d |
|---|---|---|---|---|---|---|
| 白涛 | 0 | 0 | 0.5 | 0 | 0 | 0 |
| 百胜 | 0 | 0 | 0.8 | 0 | 0.1 | 0.1 |
| 从林 | 0 | 0 | 1.7 | 0 | 0.1 | 0.5 |
| 大木 | 0.1 | 0 | 2.5 | 0.1 | 0 | 0.1 |
| 大溪 | 0 | 0 | 1.7 | 0 | 0 | 0.2 |
| 对比站 | 0 | 0 | 0 | 0 | 0 | 0 |
| 涪陵本站 | 0 | 0 | 1.7 | 0 | 0.5 | 0.4 |
| 明家 | 0.1 | 0 | 0.8 | 0.1 | 0.5 | 0.1 |
注:rain1d,…,rain5d分别表示相对0天前第1-5天日降雨量 |
Tab. 2 Example information values for individual triggering factors表2 影响因子信息量计算表 |
| 地质灾害因子 | 分段 | 地灾个数(个) | 信息量 | 信息量主要排序 |
|---|---|---|---|---|
| 坡度(°) | 0~5 | 18 | -1.514609 | - |
| 5~10 | 31 | -0.352688 | - | |
| 10~15 | 87 | 0.530870 | 11 | |
| 15~20 | 56 | 0.667521 | 8 | |
| 20~25 | 4 | -1.244959 | - | |
| 坡向(°) | 平坦 | 5 | -2.08588 | - |
| 0~30 | 10 | -0.326033 | - | |
| 30~150 | 66 | 0.189856 | 19 | |
| 150~200 | 21 | -0.005354 | - | |
| 200~250 | 30 | 0.372565 | 16 | |
| 250~310 | 32 | -0.020237 | - | |
| 310~330 | 13 | 0.04228 | - | |
| 330~360 | 19 | 0.357179 | 17 | |
| 累积汇水面积 (格网) | 1~2 | 114 | 0.100335 | 21 |
| 2~4 | 31 | 0.437477 | 15 | |
| 4~8 | 15 | -0.550313 | - | |
| 8~20 | 21 | 0.162117 | 20 | |
| >20 | 15 | -0.793704 | - | |
| 土地利用类型 | 耕地 | 76 | 0.503849 | 12 |
| 林地 | 61 | -7.919041 | - | |
| 园地 | 19 | 1.316537 | 2 | |
| 草地 | 5 | -0.589446 | - | |
| 交通运输用地 | 2 | 0.743452 | 7 | |
| 水域及水利设施用地 | 11 | 0.478293 | 13 | |
| 城镇村及工矿用地 | 22 | 2.009376 | 1 | |
| 离地表水距离 (m) | 0~150 | 97 | 1.218703 | 3 |
| 150~250 | 60 | 1.187452 | 4 | |
| 250~400 | 21 | -0.728606 | - | |
| >400 | 18 | -2.39345 | - | |
| 地层岩性 | 三叠系中统雷口坡组 | 0 | 0 | - |
| 三叠系下统嘉陵江组 | 12 | -1.138709 | - | |
| 三叠系上统须家河组 | 0 | 0 | - | |
| 侏罗系下统珍珠冲组 | 0 | 0 | - | |
| 侏罗系中统新田沟组 | 0 | 0 | - | |
| 二迭系上统 | 0 | 0 | - | |
| 侏罗系上统蓬莱镇组 | 2 | -3.63999 | - | |
| 侏罗系中统上沙溪庙组 | 106 | 0.783518 | 6 | |
| 二迭系下统 | 0 | 0 | - | |
| 三叠系下统飞仙关组 | 0 | 0 | - | |
| 志留系下统罗惹坪组 | 0 | 0 | - | |
| 侏罗系上统遂宁组 | 49 | 0.797644 | 5 | |
| 侏罗系中统下沙溪庙组 | 22 | -0.309074 | - | |
| 侏罗系中下统自流井组 | 5 | -0.961061 | - | |
| 植被(NDVI) | -1~0 | 176 | 0.132877 | 21 |
| 0~0.2 | 11 | -1.164542 | - | |
| 0.2~0.4 | 9 | 0.353476 | 18 | |
| 0.4~1.0 | 0 | 0 | - | |
| 降雨量(mm) | 0.0~1.0 | 65 | 0.568849 | 10 |
| 1.0~2.0 | 43 | 0.453245 | 14 | |
| 2.0~3.0 | 80 | 0.572047 | 9 | |
| >3.0 | 8 | -0.003276 | - |
Fig. 10 Geological hazard risk distribution map图10 地质灾害易发性评价分区图 |
Tab. 3 Comparison of risk zones and geological hazards sites表3 危险性等级分布表 |
| 易发性等级 | 该级别面积(km2) | 占研究区面积比(%)(a) | 灾害点个数 | 占灾害点总数比(%)(b) | 灾积比(b/a) |
|---|---|---|---|---|---|
| 低 | 449.617 | 15.27 | 3 | 1.5 | 0.09 |
| 较低 | 666.110 | 22.62 | 12 | 6.3 | 0.27 |
| 中 | 895.299 | 30.41 | 21 | 10.8 | 0.36 |
| 较高 | 648.251 | 21.97 | 56 | 28.7 | 1.31 |
| 高 | 286.582 | 9.73 | 104 | 52.7 | 5.42 |
Fig.11 Success-rate ROC curve and prediction-rate ROC curve图11 成功率ROC曲线和预测率ROC曲线 |
The authors have declared that no competing interests exist.
| [1] |
|
| [2] |
|
| [3] |
|
| [4] |
|
| [5] |
|
| [6] |
|
| [7] |
|
| [8] |
|
| [9] |
|
| [10] |
|
| [11] |
|
| [12] |
|
| [13] |
|
| [14] |
|
| [15] |
|
| [16] |
|
| [17] |
|
| [18] |
|
| [19] |
|
| [20] |
|
| [21] |
|
| [22] |
|
| [23] |
|
/
| 〈 |
|
〉 |