
热红外地表方向性辐射温度与半球辐射温度关系研究
作者简介:彭硕(1989-),女,内蒙古呼和浩特人,硕士生,研究方向为热红外方向性辐射。E-mail: pengs.12s@igsnrr.ac.cn
收稿日期: 2015-03-09
要求修回日期: 2015-04-21
网络出版日期: 2016-01-10
基金资助
国家自然科学基金重点项目(41231170)
中国科学院地理科学与资源研究所可桢杰出青年学者计划项目(2012RC101)
Study of the Relationship Between Thermal Infrared Directional and Hemispherical Radiative Temperatures
Received date: 2015-03-09
Request revised date: 2015-04-21
Online published: 2016-01-10
Copyright
地表温度是陆面过程的一个重要影响因素,利用地表温度的遥感反演算法只能获取卫星传感器观测角度条件下的地表温度(即某个方向上的辐射温度),但地球表面普遍存在非同温像元,反演得到的像元地表辐射温度具有方向性特征。本文利用热红外辐射传输模型4 SAIL(Scattering by Arbitrarily Inclined Leaves),以及方向性热辐射参数化模型,针对非同温均匀冠层,考虑冠层结构、太阳位置和观测角等因素的影响,模拟得到方向性辐射温度数据,与半球辐射温度数据比较,得到估算半球辐射温度的最佳观测角度。此外,开展热红外地面观测试验,对热红外地表辐射温度的角度效应,以及利用模拟数据得到的半球辐射温度最佳观测角度进行了验证。结果表明,当太阳高度角较低时,均匀草地的地表辐射温度,会随着观测天顶角的增大而增加,受观测方位角的影响较小,当观测天顶角为75°时,倾斜观测与垂直观测得到的辐射温度差值达到2.7 K,说明热辐射存在明显的方向性特征。同时,将热红外地表方向性辐射温度与同步观测的半球辐射温度进行对比分析,当叶面积指数小于1.0时,半球辐射温度的最佳替代角度为51°,与模拟结果相符。
关键词: 4 SAIL模型; 方向性热辐射参数化模型; 方向性辐射温度; 多角度观测试验; 半球辐射温度
彭硕 , 唐伯惠 , 李召良 , 吴骅 , 唐荣林 . 热红外地表方向性辐射温度与半球辐射温度关系研究[J]. 地球信息科学学报, 2016 , 18(1) : 106 -116 . DOI: 10.3724/SP.J.1047.2016.00106
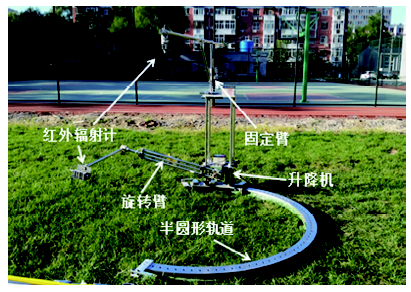
Land surface temperature (LST) is one of the key parameters in land surface processes, and hemispherical radiative surface temperature is also an important input parameter for land surface models. However, notably the LST derived from satellite scale data is affected by the variation of viewing zenith angles. Therefore, it is necessary to develop methods to estimate the hemispherical radiative temperature from the satellite-derived LST before inputting the hemispherical radiative temperature into land surface models. This paper firstly analyzes the relationship between the directional and hemispherical radiative temperatures simulated by a thermal-infrared radiative transfer model and a parameterized model for flat and homogeneous canopy, considering leaf inclination distribution function (LIDF), leaf area index (LAI), solar zenith angle and viewing azimuth angle. Then, a best directional radiative temperature is proposed to substitute the hemispherical radiative temperature. In addition, this paper also briefly describes the angular effect of the radiative surface temperature via field experimental study. The experiments were conducted over a homogenous and flat grassy lawn using two KT-15.85D infrared radiometers mounted on a multi-angle observation device. The grass radiative surface temperature under different viewing angles was measured by one radiometer through rotating the arm of the multi-angle observation device. The radiative surface temperature at nadir was measured by the other radiometer on a fixed arm. The results reveal that the radiative surface temperature increases with the increase of viewing zenith angle and it depends slightly on the variation of viewing azimuth angle. Comparing the off-nadir radiative temperatures to those measured at nadir, it exhibits a maximum difference of 2.7 K when the viewing zenith angle is at 75°, which implies that the angular effect of infrared radiation does exist. Comparing and analyzing the directional and hemispherical radiative temperatures, we found that the directional radiative temperature measured at a viewing zenith angle of 51° can be the best substitute for the hemispherical radiative temperature when the LAI is below 1.0.
Tab. 1 Input variables for the two simulation models表1 利用模型进行模拟所需的主要输入参数 |
| 参数 | 4 SAIL模型 | 参数化模型 |
|---|---|---|
| 太阳天顶角(SZA) | 88° | 20°,60° |
| 太阳方位角(SAA) | 267° | 120° |
| 观测天顶角(VZA) | 0~90° | 0~90° |
| 观测方位角(VAA) | 0° | 0~360° |
| 叶面积指数(LAI) | 0.5,1,2,3 | 0.5,1,2 |
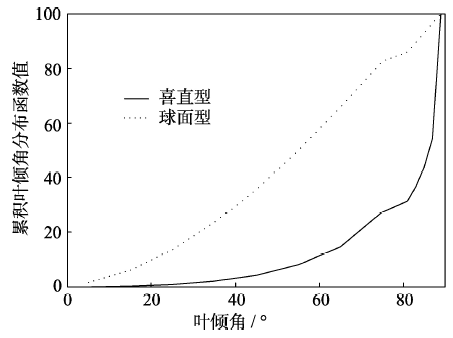
| 叶倾角分布函数(LIDF) | 喜直型,球面型 | 平均叶倾角=0.7854 |
| 光照叶片温度(Th) | 21° | 17° |
| 阴影叶片温度(Tc) | 19° | 17° |
| 光照土壤温度(Ts) | 19.5° | 32° |
| 阴影土壤温度(Td) | 16° | 22° |
| 天空温度(Tsky) | -30° | - |
| 叶片发射率() | 0.985 | 0.985 |
| 土壤发射率() | 0.95 | 0.95 |
Fig. 1 Modeled cumulative LIDFs图1 叶倾角分布函数示意图 |
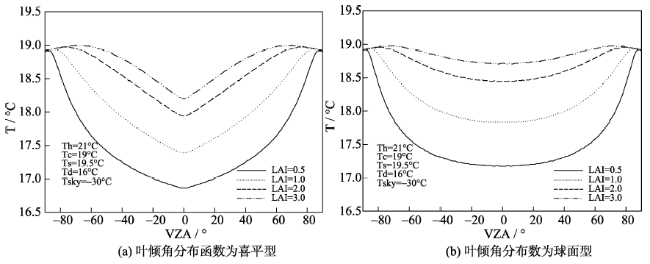
Fig. 2 Simulated directional radiative temperature profiles for four LAI values and two LIDFs using 4 SAIL model图2 利用4 SAIL模型模拟的不同叶倾角分布函数下的4种叶面积指数对应方向性辐射温度曲线图 |
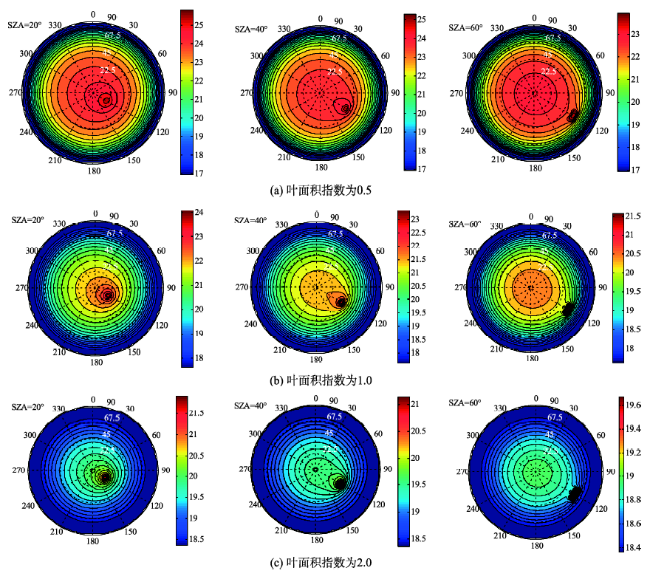
Fig. 3 Simulated directional radiative temperature for three SZA values and three LAI values using a parameterized model图3 利用方向性热辐射参数化模型模拟的不同太阳天顶角条件及3种叶面积指数条件下的冠层方向性辐射温度的半球空间分布 |
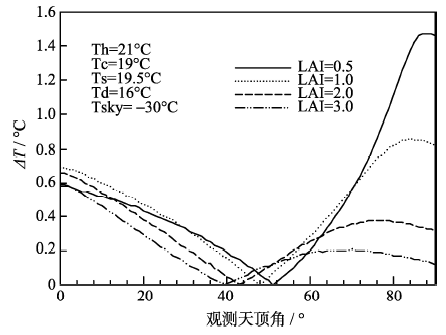
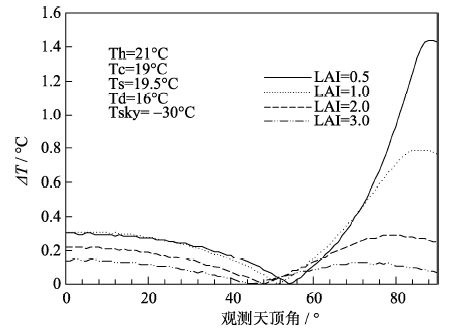
Fig. 4 Simulated differences profiles between the directional radiative temperature and the hemispherical radiative temperature under four LAI values and the erectophile LIDF by 4 SAIL model图4 利用4 SAIL模型模拟的叶倾角分布函数为喜直型,4种不同叶面积指数条件下方向性辐射温度与半球辐射温度差值曲线 |
Fig. 5 Simulated differences profiles between the directional radiative temperature and the hemispherical radiative temperature under four LAI values and the spherical LIDF by 4 SAIL model图5 利用4 SAIL模型模拟的叶倾角分布函数为球面型,4种不同叶面积指数条件下方向性辐射温度与半球辐射温度差值的曲线 |
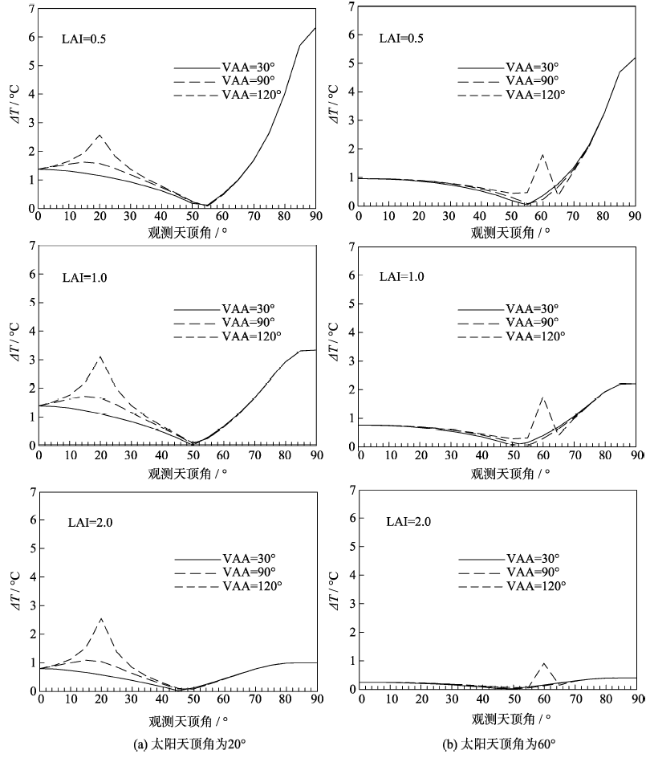
Fig. 6 Simulated differences profiles between the directional radiative temperature and the hemispherical radiative temperature under three viewing azimuth angles, two solar zenith angles and three LAI values by a parameterized model with SZA=20° and SZA=60°图6 参数化模型模拟的不同观测方位角及不同太阳天顶角和不同叶面积指数条件下方向性辐射温度与半球辐射温度差值曲线 |
Fig. 7 Photo of the automatic multi-angle observation device setup for multi-angle thermal infrared measurements图7 多角度观测装置 |
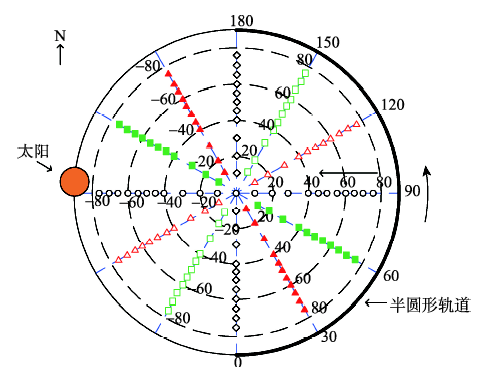
Fig. 8 Schematic representation of the hemispheric measurement in polar coordinate. (Each point represents a measurement at the corresponding viewing zenith and azimuth angle)图8 极坐标下的半球观测示意图(在每点对应的观测天顶角和观测方位角进行一次观测) |
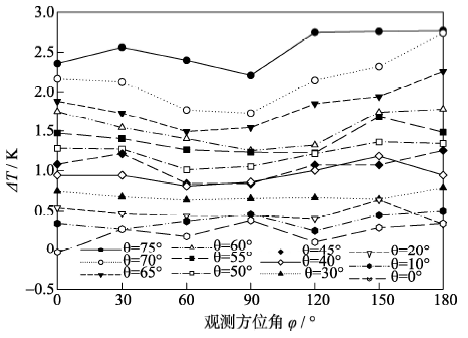
Fig. 9 ΔT of grassy lawn for different viewing azimuth angles图9 不同观测方位角下草地的亮度温度差值曲线 |
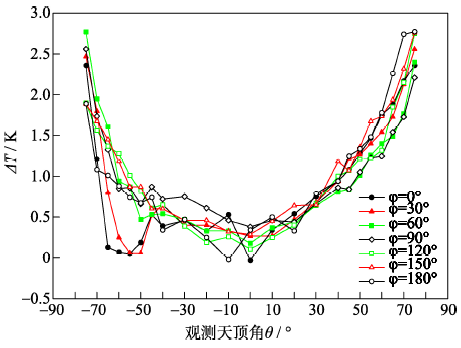
Fig. 10 ΔT of grassy lawn for different viewing zenith angles图10 不同观测天顶角下草地的亮度温度差值曲线 |
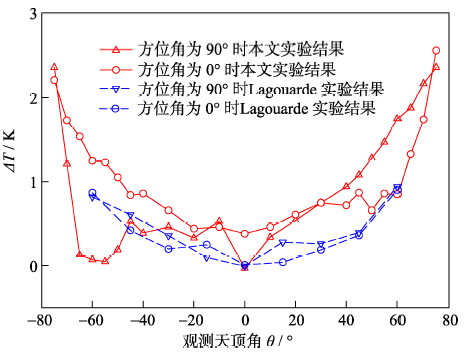
Fig. 11 Comparison of ΔT between the results of Lagouarde et al. and this paper at 0° and 90° viewing azimuth angles图11 方位角0°和方位角90°时倾斜测量的亮度温度与垂直测量的亮度温度差值随观测天顶角的变化曲线 |
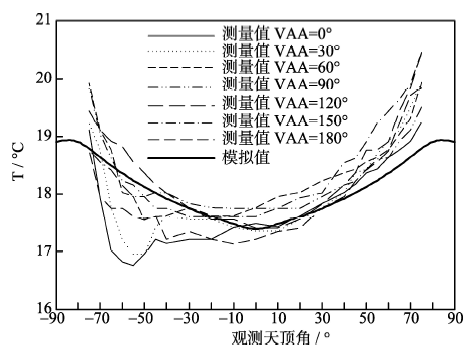
Fig. 12 Comparison between the simulated directional radiative temperature and the measured radiative temperature图12 针对草地模拟的方向性辐射温度与测量的方向性辐射温度比较 |
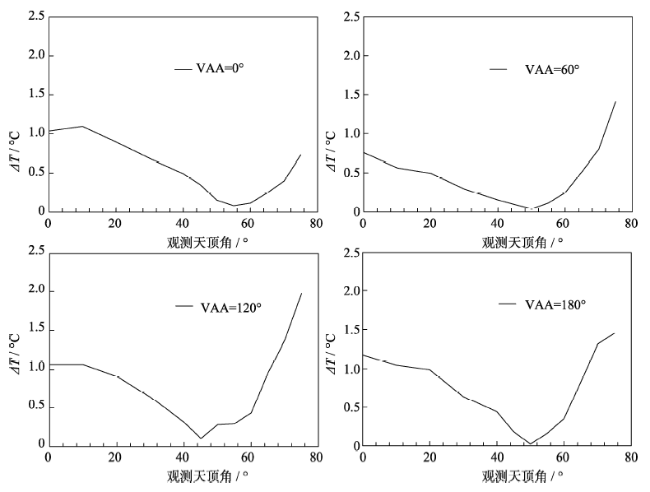
Fig. 13 Measured differences profiles between the directional radiative temperature and the hemispherical radiative temperature under 4 viewing azimuth angles图13 不同观测方位角条件下方向性辐射温度与半球辐射温度差值曲线 |
The authors have declared that no competing interests exist.
| [1] |
|
| [2] |
|
| [3] |
|
| [4] |
|
| [5] |
|
| [6] |
|
| [7] |
|
| [8] |
|
| [9] |
|
| [10] |
|
| [11] |
|
| [12] |
|
| [13] |
|
| [14] |
|
| [15] |
|
| [16] |
|
| [17] |
|
| [18] |
|
/
| 〈 |
|
〉 |