遥感科学与应用技术

基于NDSI和NDISI指数的SPOT-5影像裸土信息提取

  • 李霞 ,
  • 徐涵秋 , * ,
  • 李晶 ,
  • 郭燕滨
展开
  • 福州大学环境与资源学院,福州大学遥感信息工程研究所,福建省水土流失遥感监测评估与灾害防治重点实验室,福州 350108
*通讯作者:徐涵秋(1955-),男,博士,教授,主要从事环境与资源遥感研究。E-mail:

作者简介:李霞(1990-),女,硕士生,主要从事环境与资源遥感研究。E-mail:

收稿日期: 2015-01-08

  要求修回日期: 2015-02-09

  网络出版日期: 2016-01-10

基金资助

国家科技支撑计划课题“南方红壤水土流失治理技术研究与示范”(2013BAC08B01-05)

福建省教育厅项目“南方典型红壤水土流失区遥感动态监测与生态环境评价——以长汀县为例”(JA3030)

Extraction of Bare Soil Features from SPOT-5 Imagery Based on NDSI and NDISI

  • LI Xia ,
  • XU Hanqiu , * ,
  • LI Jing ,
  • GUO Yanbin
Expand
  • College of Environment and Resources, Institute of Remote Sensing Information Engineering, Fujian Provincial Key Laboratory of Remote Sensing of Soil Erosion and Disaster Protection, Fuzhou University, Fuzhou 350108, China
*Corresponding author: XU Hanqiu, E-mail:

Received date: 2015-01-08

  Request revised date: 2015-02-09

  Online published: 2016-01-10

Copyright

《地球信息科学学报》编辑部 所有

摘要

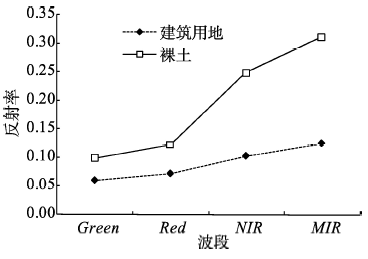
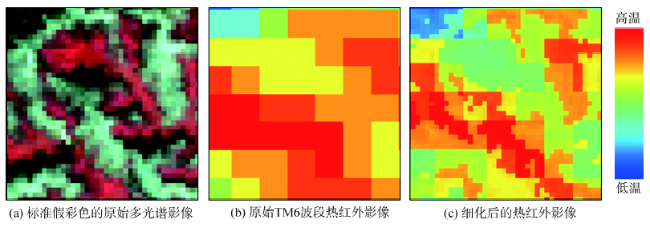
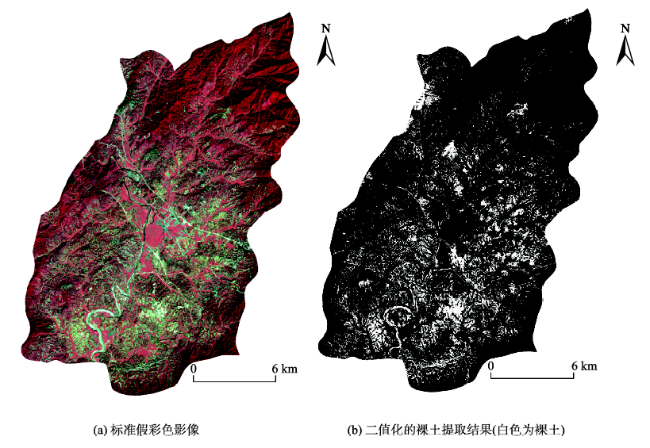
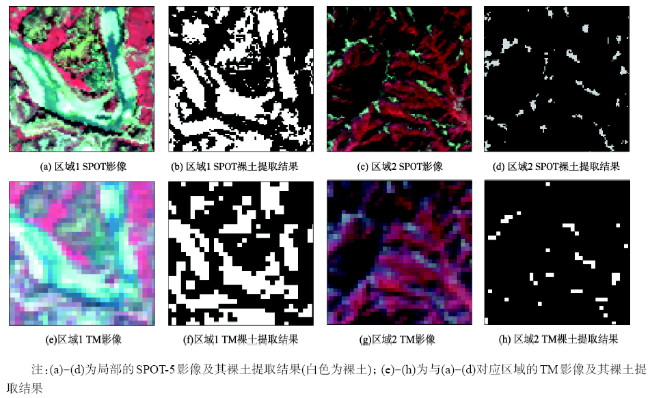
遥感裸土识别制图为水土流失治理工作提供了科学依据。本文以SPOT-5影像为实验数据,提出一种以土壤指数NDSI和不透水面指数NDISI提取裸土的方法。通过热红外波段的亚像元分解技术,将同期120 m分辨率的TM 6波段细化为10 m分辨率的地表温度影像,为SPOT-5影像计算NDISI不透水面指数增加了必要的热红外波段。在此基础上,构建双重指数模型,获得10 m分辨率的裸土数据。研究表明,双重指数模型可较好地解决裸土提取中建筑用地与裸土相混淆的问题,提取裸土的总精度可达95.4%。通过比较10 m的SPOT-5和30 m的TM影像的裸土提取结果,发现影像分辨率的提升可使裸土信息提取结果更加准确、精细。因此,本文为更高分辨率裸土识别制图,提供了一种有效的方法。

本文引用格式

李霞 , 徐涵秋 , 李晶 , 郭燕滨 . 基于NDSI和NDISI指数的SPOT-5影像裸土信息提取[J]. 地球信息科学学报, 2016 , 18(1) : 117 -123 . DOI: 10.3724/SP.J.1047.2016.00117

Abstract

The accurate mapping of bare soil land is of vital significance to soil erosion treatment. Satellite remote sensing has become a popular technology used in bare soil mapping, owing to the capability of monitoring bare soil dynamics in a cost-effective manner. Nowadays, Landsat imagery with a spatial resolution of 30 m has been widely used in previous work for bare soil extraction. Nevertheless, due to the limitation of its spatial resolution, the Landsat image can hardly meet the requirement of fine-scale bare soil mapping. Thus, a method for higher resolution bare soil mapping was proposed in this paper using SPOT-5 imagery as the main data. The Normalized Difference Soil Index (NDSI) was firstly utilized to enhance the bare soil features from the SPOT-5multispectral 10 m image. However, the enhanced soil information was mixed with the built-up land features due to the confusion between the two categories. To solve this problem, the Normalized Difference Impervious Surface Index (NDISI) was further introduced to separate the built-up features from the bare soils. Due to the lack of a thermal band in SPOT-5 imagery, which is required in computing NDISI, a near synchronous Landsat TM thermal band 6 was fine-sharpened to 10 m resolution, and afterwards, it was added to the SPOT-5 bands to calculate NDISI. Accordingly, a model was used in mapping the bare soil, based on the NDSI and NDISI. Finally, the extraction results of bare soil at 10 m resolution were obtained through the model, which achieved an overall accuracy of 95.4%. It suggests that the two-index based method can effectively eli- minate the confusion between bare soil land and built-up land, and can extract the bare soil features with a higher accuracy. In addition, the bare soil features extracted from SPOT imagery and TM imagery respectively, were further compared. It is found that a higher spatial resolution can lead to a more accurate extraction result. Therefore, the 10 m resolution SPOT-5 image is considered to be more adaptive and useful in bare soil mapping for soil erosion treatment.

1 引言

水土流失是当今世界面临的一个严峻的生态环境问题。裸土是水土流失区的主要地表景观,该数据对于水土流失的监测和治理有着极其重要的作用。
遥感信息技术是目前裸土提取的主要应用手段。裸土信息的提取方法包括传统的监督/非监督分类[1-2]、神经网络分类法[3]、线性光谱分解法[4-5]、决策树分层分类法[6-7]、指数提取法等。指数法是根据地物的波谱特性建立遥感指数,通过阈值选择快速实现裸土的提取,是目前广泛应用的裸土提取方法。Kearney等利用土壤在中红外谱段反射率最高,且在该谱段与植被和水体的最易区分等特征,在中红外和近红外谱段构建归一化土壤指数NDSI(Normalized Difference Soil Index),用于裸土信息的提取[8]。Riki maru在计算森林郁闭度模型FCD model(Forest Canopy Density model)时,提出裸土指数BSI(Bare Soil Index)来区分裸土地类[9]。Zhao等在使用Landsat TM/ETM+影像提取黄河三角洲地带的裸土时,利用热红外和中红外5波段创建了归一化裸土指数NDBaI(Normalized Difference Bareness Index)[10]。由于裸土和建筑用地光谱特征的相似性,因此,这些指数无法解决建筑用地和裸土的混淆问题,裸土提取的精度受到影响。为了解决这一混淆问题,As-syakur等研究城市区域建筑用地和裸土识别制图时,针对Landsat ETM+影像,提出了以近红外、中红外和热红外波段构建的增强的建筑用地和裸土指数EBBI(Enhanced Built-Up and Bareness Index)。通过双阈值可同时提取建筑用地和裸土,但其提取裸土的精度仍低于NDBaI[11],仅能实现建筑用地与裸土的部分分离。徐涵秋在研究南方红壤水土流失区时,运用NDSI和NDISI双重指数,有效解决了Landsat影像裸土提取中裸土和建筑用地的混淆问题[12],为Landsat影像裸土提取提供了可靠的技术手段。但30 m空间分辨率的Landsat影像难以满足大比例尺精细裸土识别制图的要求,而更高空间分辨率的影像,往往又具有较低的光谱分辨率,缺少构建指数所需的一些关键波段。因此,更高分辨率裸土识别制图仍是当前亟待解决的难题。
针对这一问题,本文以福建省水土流失严重的长汀县为例,在现有的双重指数法的基础上,以SPOT-5影像为实验数据,提出了一种基于NDSI和NDISI指数的更高分辨率裸土信息提取方法。

2 研究数据与方法

本文选择典型的南方红壤水土流失区福建省长汀县的河田镇、三洲镇作为研究区。该区位于河田盆地中,是长汀县水土流失的重点治理区;属典型的亚热带季风气候,雨量充沛,年均降雨量在1500~1700 mm;境内四面环山,海拔在200~600 m,地矿资源丰富,土壤类型以可侵蚀性较高的红壤为主。由于诸多自然和人为因素的影响,区域内裸土大量分布,因此,可较好地验证裸土提取算法的可靠性。
(1)本文选用2004年10月5日的SPOT-5多光谱影像进行裸土提取研究。SPOT-5多光谱影像包含绿、红、近红外及短波红外4个波段,空间分辨率为10 m和20 m(短波红外波段),比Landsat空间分辨率高。
采用SPOT官方手册的模型[13-14]和引入COST算法的日照大气综合校正模型(IACM)将影像的灰度值(DN)转换为传感器处的反射率[15],从而完成影像的辐射校正。具体计算公式如式(1)所示。
ρ λ = π ( D N λ - h λ ) d 2 ESU N λ Gai n λ cos θ s (1)
式中:λ为波段号;ρλ为像元传感器处的反射率;DNλhλ为经量化标定的原始影像波段λ的像元值及其最暗像元值;d为天文单位的日地距离,见参考文献[16];ESUNλGainλ和θs分别为大气顶端的平均太阳辐照度、增益值及太阳天顶角,这3个参数均可从影像头文件中获得。
(2)针对裸土信息提取的指数有Kearney等提出的归一化土壤指数NDSI[8]、Rikimaru提出的裸土指数BSI[9]及Zhao等提出的归一化裸土指数ND BaI[10]。经本文实验对比,NDSI较适合研究区的裸土提取。该指数主要利用了裸土在中红外波段反射率最高这一特性,将中红外和近红外波段组合来构建归一化指数,对裸土信息进行增强。其公式如式(2)所示。
NDSI = MIR - NIR MIR + NIR (2)
式中:MIRNIR分别为中红外和近红外波段的反射率,分别对应SPOT-5影像的4和3波段。
在研究区内选择大量的建筑用地和裸土样本,并根据样本的统计结果绘制2种类型的波谱曲线(图1)。由2种类型的波谱曲线可看出,建筑用地与裸土的中红外波段值均大于近红外波段,因此,NDSI在增强裸土的同时,也增强了建筑用地,造成裸土信息与建筑用地信息混淆。为此,徐涵秋引入代表建筑用地的不透水面指数(NDISI)[17]来剔除裸土中的建筑用地信息[12]。因此,本文综合使用裸土指数NDSI和不透水面指数NDISI来提取研究区的裸土。NDISI不透水面指数的公式如式(3)所示。
NDISI = TIR - ( Green + NIR + MIR ) 3 TIR + ( Green + NIR + MIR ) 3 (3)
式中:TIR为热红外波段的辐射率;Green为绿光波段的反射率,对应SPOT-5影像的1波段。
Fig. 1 Spectral signatures of bare soil and built-up land in the study area

图1 实验区裸土与建筑用地的波谱曲线

根据以上2个指数构建阈值模型,可滤去裸土中的建筑用地信息。其构建模型为:
若“NDSI>a和NDISI< b”,则为裸土,否则为非裸土。其中,a、b为阈值。通过对NDSI和NDISI指数影像的统计,获得其直方图和统计参数,并在直方图上通过目视判读和人工调试,获得a、b的最佳阈值。

3 基于NDSI和NDISI指数的裸土影像识别分析

3.1 热红外亚像元分解算法

由式(3)可知,NDISI的构建需要热红外波段的参与,而SPOT-5影像并不具备热红外波段。因此,本研究采用日期相近的Landsat TM影像(2004年10月12日)的热红外波段来代替。由于TM影像热红外波段的分辨率(120 m)较低,虽通过式(3)与SPOT-5影像(10 m)进行的波段运算可起到一定融合作用,提高其分辨率,但终因分辨率差距较大,效果不佳。为此,本文利用亚像元分解技术将TM影像的热红外波段先细化成10 m,然后加入到式(3)中与SPOT-5影像的相关波段一起计算NDISI。
热红外亚像元分解是将热红外影像由低空间分辨率转换为高空间分辨率的过程。目前,比较成熟的亚像元分解技术包括:Pixel Block Intensity Modulation法(简称PBIM法)[18]、TsHARP法[19]和E-missivity Modulation法[20](简称EM法)。由于EM法运算简单易行,对数据的要求相对较低,且有较高的精度,因此本次研究采用EM法。EM法通过运用高分辨率的比辐射率影像对低分辨率的热红外影像进行细化,以提高后者的空间分辨率,具体过程如下:
(1)首先,将TM影像第 6波段的DN值反演为亮温[16]
L 6 = Gain × DN + Bias (4)
T b = K 2 / ln ( K 1 / L 6 + 1 ) (5)
式中:L6为TM影像第6波段的像元在传感器处的光谱辐射值;GainBias分别为第6波段的增益值和偏置值,可从影像头文件中获取;Tb为亮温;K1和K2分别为定标参数,K1=607.76 W/( m2·sr·μ m),K2=1260.56 K。
(2)其次,利用SPOT-5影像求取10 m分辨率的地表比辐射率影像。Sobrino等假定地表由植被和裸土构成,像元的比辐射率可根据其NDVI来获取[21]
当NDVI<T1时,视为纯裸土像元,其比辐射率与影像红光波段的反射率有关,计算公式如式(6)所示。
ε = 0.979 - 0.035 ρ Re d (6)
当NDVI>T2时,视为纯植被像元,将其比辐射率赋值为0.99;
当T1≤NDVI ≤T2时,则视为裸土和植被组成的混合像元,计算公式如式(7)所示。
ε = 0.986 + 0.004 ( NDVI - T 1 ) ( T 2 - T 1 ) 2 (7)
式中:ρRedNDVI分别为SPOT-5影像的红光波段反射率及归一化植被指数;ε为比辐射率;T1和T2为常量,可根据具体情况进行设置。结合标准假彩色影像,通过人工目视判读,获得纯裸土的NDVI最大值(T1)和纯植被像元的NDVI最小值(T2)。
(3)最后,对亮温进行比辐射率校正[22-23],计算如式(8)所示。
T = T b / 1 + ( λ 6 T b / ρ ) lnε (8)
式中:T为经比辐射率校正后的亮温,单位K;λ6为TM影像第6波段的中心波长(11.4 μm),ρ=1.432×10⁻² mk。
通过上述方法,即先将120 m分辨率的TM热红外波段影像细化为10 m,然后代入式(3)计算NDISI。

3.2 裸土识别分类结果与分析

将研究区细化后的地表温度影像及原B6影像均拉伸到0-255之间,并统计其各自的特征值。经细化后,影像的标准方差由24.8增至26.5,提升了7%。这说明,细化后的影像增加了影像的细节,丰富了影像的信息量。
图2进一步比较了细化前后影像的差异。原始影像(图2(a))中,红色的植被与灰白色的裸土间杂分布。在细化前的影像(图2(b))中,狭长的植被和斑块细小的裸土被忽略,高温区域的分布与原始影像中裸土的分布相似。在细化后的影像(图2(c))中,影像分辨率明显提高,细小、高温的黄红色裸土斑块和低温的蓝绿色植被斑块得以显示,植被与裸土的分界清楚,高温区域的分布与原始影像中裸土的分布基本一致。这说明,经细化后,不但影像空间分辨率得到提高,而且原影像中热特性也得到较好的保持。
Fig. 2 Result of thermal image sharpening

图2 热红外影像亚像元分解的效果

综上,热红外影像的亚像元分解,不仅明显提高了影像的空间分辨率,丰富了影像的热信息细节,还较好地保持了原影像的热特性,取得了很好的细化效果。
使用10 m的细化的温度影像和SPOT-5相关波段构建NDISI,并结合NDSI影像,进行裸土的提取(图3)。原始影像(图3(a))中的白色或浅灰色裸土与提取的结果影像中裸土(图3(b))的分布一致。裸土得到较好的提取,植被、水体完全被剔除,建筑用地也基本被剔除(图4(b)、(d))。
Fig. 3 Standard false color image and soil extraction result of the study area

图3 研究区的裸土提取结果

Fig. 4 Results of local bare soil extraction

图4 局部的裸土提取结果

为了定量评价该方法的提取效果,对提取结果使用更高分辨率的影像进行验证。通过Pansharp[24]的方法,将SPOT-5多光谱影像与同期的5 m全色影像进行融合,得到5 m分辨率的多光谱影像。使用随机抽样的方法,选取500个像元,以融合影像为参照,通过目视判读进行验证,总精度达95.4%,生产者精度和使用者精度均大于90%(表1)。这说明本次经过热红外影像细化处理的双重指数法取得了较高的裸土提取精度。
Tab. 1 Accuracy validation results

表1 精度验证结果

参照数据 行总像元数 使用者精度(%) 总精度(%) Kappa系数
裸土 非裸土
SPOT 裸土 336 8 344 97.6 95.4 0.849
非裸土 15 141 156 90.4
列总像元数 351 149
生产者精度(%) 95.7 94.6
TM 裸土 320 17 337 95.0 90.4 0.777
非裸土 31 132 163 81.0
列总像元数 351 149
生产者精度(%) 91.2 88.6
为对比10 m分辨率的SPOT影像与30 m TM影像的裸土提取效果,同样在热红外影像亚像元分解的基础上,使用双重指数模型对2004年10月12日的实验区TM影像进行裸土提取。采用与SPOT-5影像相同的参照数据和验证像元,对TM影像的裸土提取结果进行精度验证,获得TM影像裸土提取的总精度为90.4%(表1),比SPOT-5影像裸土提取精度低5%。经统计,TM影像提取的研究区裸土总面积为49.56 km2,SPOT-5影像提取的裸土总面积为66.78 km2,TM影像提取结果比SPOT影像少17.22 km2。通过对二者提取结果的比较可发现:TM影像中地物边界模糊,狭窄的河流和细碎的裸土多被忽略,导致了裸土的误提和漏提(图4(e)-(h)),影响了提取精度;而SPOT-5影像中地物的边界更加清晰,沟壑中的裸土更加明显,因而提取的裸土也更加准确和精细(图4(a)-(d))。这主要是因为当空间分辨率由30 m(TM)提高到10 m (SPOT),每个30 m像元被细分为9个10 m像元,混合像元大量减少,其中,地物得到更好的识别,有助于裸土的提取。因而,2种影像提取的裸土面积有较大的差异。由此可看出,由于分辨率限制,30 m的TM影像的裸土提取远不及10 m的SPOT-5准确、精细,这也进一步说明了更高分辨率裸土识别制图的必要性及本文研究的意义。

4 结论与讨论

以SPOT-5影像进行更高分辨率裸土制图,借助热红外亚像元分解技术,构建了基于NDSI和NDISI指数的裸土信息提取模型。实验表明,该模型可有效地解决裸土与建筑用地混淆的问题,快速准确地实现10 m分辨率的裸土信息提取。通过该模型提取出的研究区裸土总面积为66.78 km2,提取总精度达95.4%。
实验表明,影像分辨率的提高使得裸土信息提取更加准确和精细,说明更高分辨率裸土制图是有效可行的。
本方法需要先获得时相相近的热红外影像。目前,USGS上免费提供丰富的Landsat卫星影像的热红外波段,可为本方法的实际应用提供有利条件。但是,由于NDSI和NDISI的构成,采用了中红外波段,因而本方法不适用于无中红外波段的传感器影像,如IKONOS,QuickBird和RapidEye等。由于本方法是基于SPOT-5影像提出的,其对SPOT-6及WorldView 3等相应波段的卫星影像适用性仍待进一步验证。

The authors have declared that no competing interests exist.

[1]
林娜,徐涵秋,何慧.南方红壤水土流失区土地利用动态变化——以长汀河田盆地区为例[J].生态学报,2013,33(10):2983-2991.福建省长汀县曾是我国南方红壤地区水土流失最严重的县份之一,经过20多年的艰辛努力,长汀已成为中国水土流失治理的典范。采用遥感技术和景观格局分析技术,基于1988、1998、2004、2009和2011年的遥感影像,对长汀县水土流失最为严重的河田盆地区进行土地利用动态变化检测与景观格局变化分析。结果表明,研究区在这23a间的土地利用发生了很大变化,其中最主要的特征就是以针叶林为主的林地面积的快速增长和地表裸土面积的大幅下降。景观分析表明,水土流失治理新增的小块林地正逐渐形成连片分布,而裸土面积在大幅减少的同时,其斑块也趋于破碎。总的看来,这23a间的水土流失治理已使得研究区的生态明显趋于好转。

DOI

[ Lin N, Xu H Q, He H.Land use changes in a reddish soil erosion region of southern China: Hetian basin, county changting. Acta Ecologica Sinica, 2013,33(10):2983-2991. ]

[2]
亢庆,张增祥,赵晓丽.基于遥感技术的干旱区土壤分类研究[J].遥感学报,2008,12(1):159-166.以新疆艾比湖地区为研究区域,以ASTER和SPOT卫星数据为基础,探讨了干旱环境下基于土壤与景观关系的土壤遥感自动分类方法.首先,研究以实地调查资料和第二次全国土壤普查数据库为基础,结合遥感图像信息分析了试验区土壤类型与景观的关系.然后,基于遥感图像和地形数据提取了分类特征,并采用Jeffries-Matusita 距离分析建立了适用遥感分类的土壤分类系统和分类特征集.最后,采用最大似然法进行了自动分类.研究证明,基于遥感信息和地形数据提取的分类特征,可有效地区分试验区9类土壤和地表覆被,主要包括:盐碱化土壤、荒漠化土壤等,总体分类精度达到了90%左右.

DOI

[ Kang Q, Zhang Z X, Zhao X L.A study of soil classification based on remote sensing in arid area[J]. Journal of Remote Sensing, 2008,12(1):159-166. ]

[3]
乔平林,张继贤,林宗坚.基于神经网络的土地荒漠化信息提取方法研究[J].测绘学报,2004,33(1):58-62.土地荒漠化是当今全球面临的重大环境问题之一,它的发生、发展及其逆转是气候、环境和人类社 会经济活动综合作用的结果。区域荒漠化信息的提取技术研究是荒漠化研究进一步深入的关键,根据土地荒漠化的遥感探测机理,应用神经网络技术,利用了TM卫 星遥感数据中的可见光、热红外和植被指数(NDVI)数据,建立了相应的BP神经网络的土地荒漠化信息的自动提取模型。实验应用表明,基于人工神经网络方 法提取土地荒漠化发生的地点和范围等信息,其精度可达到84%。因此,应用人工神经网络方法提取土地荒漠化信息是切实可行,并具有可推广价值。

DOI

[ Qiao P L, Zhang J X, Lin Z J.An Artificial neural network method for the information of desertification extraction[J]. Acta Geodaetica ET Cartographic Sinica, 2004,33(1):58-62. ]

[4]
Ridd M K.Exploring a V-I-S (vegetation-impervious surface-soil) model for urban ecosystem analysis through remote sensing: Comparative anatomy for cities[J]. International Journal of Remote Sensing, 1995,16(12):2165-2185.ABSTRACT Growing interest in urban systems as ecological entities calls for some standards in parameterizing biophysical composition of urban environments. A vegetation-impervious surface-soil ( V-I-S) model is presented as a possible basis for standardization. The V-I-S model may serve as a foundation for characterizing urban/near-urban environments universally, and for comparison of urban morphology within and between cities. Inasmuch as the model may be driven by satellite digital data, it may serve as a global model of urban ecosystem analysis and comparison world-wide. The V-I-S model may prove useful for urban change detection and growth modelling, for environmental impact analysis from urbanization, for energy- and water-related investigations, and for certain dimensions of human ecosystem analysis of the city as well.

DOI

[5]
Wu C S, Murray A T.Estimating impervious surface distribution by spectral mixture analysis[J]. Remote Sensing of Environment, 2003,84(4):493-505.Estimating the distribution of impervious surface, a major component of the vegetation–impervious surface–soil (V–I–S) model, is important in monitoring urban areas and understanding human activities. Besides its applications in physical geography, such as run-off models and urban change studies, maps showing impervious surface distribution are essential for estimating socio-economic factors, such as population density and social conditions. In this paper, impervious surface distribution, together with vegetation and soil cover, is estimated through a fully constrained linear spectral mixture model using Landsat Enhanced Thematic Mapper Plus (ETM+) data within the metropolitan area of Columbus, OH in the United States. Four endmembers, low albedo, high albedo, vegetation, and soil were selected to model heterogeneous urban land cover. Impervious surface fraction was estimated by analyzing low and high albedo endmembers. The estimation accuracy for impervious surface was assessed using Digital Orthophoto Quarterquadrangle (DOQQ) images. The overall root mean square (RMS) error was 10.6%, which is comparable to the digitizing errors of DOQQ images. Results indicate that impervious surface distribution can be derived from remotely sensed imagery with promising accuracy.

DOI

[6]
买买提沙吾提,塔西甫拉提·特依拜,丁建丽,等.基于决策树分类法的塔克拉玛干南缘沙漠化信息提取方法研究[J].环境科学研究,2008,21(2):109-114.选择策勒绿洲作为典型的绿洲-荒漠交错带,采用Landsat ETM+影像,分析了沙漠化土地的光谱特征及其波段间的相互运算,用分层分离的方法,提取了沙漠化土地信息.结果表明:利用修改型土壤调整植被指数 (MSAVI),归一化差异水体指数(NDWI)和遥感图像缨帽变换后的亮度(Brightness)、绿度(Greenness)、湿度 (Wetness)等复合识别指标,在决策树的各节点设计不同的分类器,可以划分沙漠化等级;决策树分类法可以有效地排除和避免提取地物时受多余信息的干 扰及影响,其总体提取效果较好,是快速自动提取沙漠化土地信息的有效手段.

[ Mamatsawut, Tashpolat T, Ding J L, et al. Decision tree classification for extracting information on sandy desertification land in the southern Taklamakan[J]. Research of Environmental Sciences, 2008,21(2):109-114. ]

[7]
田静,王卷乐,李一凡,等.基于决策树方法的蒙古高原土地覆盖遥感分类——以蒙古国中央省为例[J].地球信息科学学报,2014,16(3):460-469.<p>蒙古高原包括蒙古全部、俄罗斯南部和中国北部部分地区。蒙古高原的土地利用/覆盖格局与变化,对揭示该区域乃至整个东北亚地区的资源、环境和生态特征,促进该区域可持续发展具有重要的现实和科学意义。本文以在蒙古国中央省及其所含首都乌兰巴托市为研究区,利用空间分辨率为30m的TM影像,采取QUEST(Quick Unbiased and Efficient Statistical Tree)决策树方法,通过图像目视解译,获取了研究区2010年土地覆盖分类数据。结果显示,草地占据研究区总面积的70.88%,其次是森林占14.83%、裸地占10.73%、农田占2.98%、水体占0.31%、建筑用地占0.27%、湿地占0.02%。通过野外实地采集的139个GPS验证点进行精度评价发现,一级土地覆盖类型的总体精度可达72.66%。针对草地的二级分类的总体精度有较明显下降,其主要是由于中蒙科学家对于草地类型分类体系的差异所造成的典型草地和荒漠草地的混分。</p>

DOI

[ Tian J, Wang J L, Li Y F, et al.Land cover classification in mongolian plateau based on decision tree method: a case study in Tov Province, Mongolia[J]. Journal of Geo-information Science, 2014,16(3):460-469. ]

[8]
Kearney M S, Rogers A S, Townshend J R G, et al. Developing a model for determining coastal marsh “health”[C]. Third Thematic Conference on Remote Sensing for Marine and Coastal Environments, Seattle, Washington, 1995:527-537.

[9]
Rikimaru A.Landsat TM data processing guide for forest canopy density mapping and monitoring model[C]. ITTO workshop on utilization of remote sensing in site assessment and planning for rehabilitation of logged-over forest, Bangkok, Thailand, 1996,8:1-8.

[10]
Zhao H, Chen X.Use of normalized difference bareness index in quickly mapping bare areas from TM/ETM+[C]. Proceedings of IEEE International Geoscience and Remote Sensing Symposium, IEEE, 2005,3:1666-1668.

[11]
As-syakur A R, Adnyana I W S, Arthana I W, et al. Enhanced Built-Up and Bareness Index (EBBI) for mapping built-up and bare land in an urban area[J]. Remote Sensing, 2012,4(10):2957-2970.Remotely sensed imagery is a type of data that is compatible with the monitoring and mapping of changes in built-up and bare land within urban areas as the impacts of population growth and urbanisation increase. The application of currently available remote sensing indices, however, has some limitations with respect to distinguishing built-up and bare land in urban areas. In this study, a new index for transforming remote sensing data for mapping built-up and bare land areas is proposed. The Enhanced Built-Up and Bareness Index (EBBI) is able to map built-up and bare land areas using a single calculation. The EBBI is the first built-up and bare land index that applies near infrared (NIR), short wave infrared (SWIR), and thermal infrared (TIR) channels simultaneously. This new index was applied to distinguish built-up and bare land areas in Denpasar (Bali, Indonesia) and had a high accuracy level when compared to existing indices. The EBBI was more effective at discriminating built-up and bare land areas and at increasing the accuracy of the built-up density percentage than five other indices.

DOI

[12]
徐涵秋. 福建省长汀县河田盆地区近35年来地表裸土变化的遥感时空分析[J].生态学报,2013,33(10):2946-2953.福建省长汀县河田盆地区是中国南方最典型的红壤水土流失区之一,当地人民和各级政府一直为治理该区的水土流失进行着不懈的努力。利用遥感技术对该区1976年以来地表裸土分布的时空变化进行了分析,基于所提出的双重遥感指数法对该区的裸土信息进行提取,查明了该区地表裸土分布的时空变化情况。研究表明,该区近35年的治理已大大减轻了地表的裸露程度,地表裸土面积从1976年的159.17 km<sup>2</sup>锐减到2010年的51.98 km<sup>2</sup>。在3个不同的观察时间段里,裸土面积的变化呈现逐次减少、减速加快的趋势,客观地反映了该区水土流失治理的3个重要历史时期和政策所产生的效应。

DOI

[ Xu H Q.Spatiotemporal dynamics of the bare soil cover in the hetian basinal area of county Changting, China, during the past 35 years. Acta Ecologica Sinica, 2013,33(10):2946-2953. ]

[13]
Spot Image. From Count to Irradiance[EB/OL]. , 2005.

[14]
CNES. SPOT Image Quality Performance[EB/OL]. , 2013.

[15]
徐涵秋. 基于影像的Landsat TM/ETM+数据正规化技术[J].武汉大学学报(信息科学版),2007,32(1):62-66.阐述了基于影像的Landsat TM/ETM+的数据正规化技术及其发展。该技术通过将Landsat影像的亮度值转换成传感器处的辐射值和反射率来对影像进行辐射校正。实例表明,使用正规化技术处理后的影像可以明显削弱日照和大气的影响,去除它们产生的噪声;其所求的传感器处的反射率与地面实测反射率的RMS值非常小。

[ Xu H Q.Image- based normalization technique used for Landsat TM/ETM+ imagery[J]. Geomatics and Information Science of Wuhan University, 2007,32(1):62-66. ]

[16]
Chander G, Markham B L, Helder D L.Summary of current radiometric calibration coefficients for Landsat MSS, TM, ETM+, and EO-1 ALI sensors[J]. Remote Sensing of Environment, 2009,113(5):893-903.

[17]
Xu H Q.Analysis of impervious surface and its impact on urban heat environment using the Normalized Difference Impervious Surface Index (NDISI)[J]. Photogrammetric engineering and remote sensing, 2010,76(5):557-565.The fast urban expansion has led to replacement of natural vegetation-dominated land surfaces by various impervious materials. This has a significant impact on the environment due to modification of heat energy balance. Timely understanding of spatiotemporal information of impervious surface has become more urgent as conventional methods for estimating impervious surface are very limited. In response to this need, this paper proposes a new index, normalized difference impervious surface index (NDISI), for estimating impervious surface. The application of the index to the Landsat ETM+ image of Fuzhou City and the ASTER image of Xiamen City in China has shown that the new index can efficiently enhance and extract impervious surfaces from satellite imagery, and the normalized NDISI can represent the real percentage of impervious surface. The index was further used as an indicator to investigate the impact of impervious surface on urban heat environment by examination of its quantitative relationship with land surface temperature (LST), vegetation, and water using multivariate statistical analysis. The result reveals that impervious surface has a positive exponential relationship with LST rather than a simple linear one. This suggests that the areas with high percent impervious surface will accelerate LST rise and urban heat island development. 2010 American Society for Photogrammetry and Remote Sensing.

DOI

[18]
Stathopoulou M, Cartalis C.Downscaling AVHRR land surface temperatures for improved surface urban heat island intensity estimation[J]. Remote Sensing of Environment, 2009,113(12):2592-2605.Surface urban heat island (SUHI) is a phenomenon of both high spatial and temporal variability. In this context, studying and monitoring the SUHIs of urban areas through the satellite remote sensing technology, requires land surface temperature (LST) image data from satellite-borne thermal sensors of high spatial resolution as well as temporal resolution. However, due to technical constrains, satellite-borne thermal sensors yield a trade-off between their spatial and temporal resolution; a high spatial resolution is associated with a low temporal resolution and vice versa. To resolve this drawback, we applied in this study four downscaling techniques using different scaling factors to downscale 1-km LST image data provided by the Advanced Very High Resolution Radiometer (AVHRR) sensor, given that AVHRR can offer the highest temporal resolution currently available. The city of Athens in Greece was used as the application site. Downscaled 120-m AVHRR LSTs simulated by the downscaling techniques, were then used for SUHI intensity estimation based on LST differences observed between the main urban land covers of Athens and the city's rural background. For the needs of the study, land cover information for Athens was obtained from the Corine Land Cover (CLC) 2000 database for Greece. Validation of the downscaled 120-m AVHRR LSTs as well of the retrieved SUHI intensities was performed by comparative analysis with time-coincident observations of 120-m LST and SUHI intensities generated from the band 6 of the Thermal Mapper (TM) sensor onboard the Landsat 5 platform. The spatial pattern of the downscaled AVHRR LST was found to be visually improved when compared to that of the original AVHRR LST and to resemble more that of TM6 LST. Statistical results indicated that, when compared to 120-m TM6 LST, the root mean square error (RMSE) in 120-m AVHRR LST generated by the downscaling techniques ranged from 4.9 to 5.3°C. However, the accuracy in SUHI intensity was found to have significantly improved, with a RMSE value decreasing from 2.4°C when the original AVHRR LST was utilized, down to 0.94°C in case that downscaling was applied.

DOI

[19]
Agam N, Kustas W P, Anderson M C, et al.A vegetation index based technique for spatial sharpening of thermal imagery[J]. Remote Sensing of Environment, 2007,107(4):545-558.High spatial resolution (6502100m) thermal infrared band imagery has utility in a variety of applications in environmental monitoring. However, currently such data have limited availability and only at low temporal resolution, while coarser resolution thermal data (65021000m) are routinely available, but not as useful for identifying environmental features for many landscapes. An algorithm for sharpening thermal imagery (TsHARP) to higher resolutions typically associated with the shorter wavebands (visible and near-infrared) used to compute vegetation indices is examined over an extensive corn/soybean production area in central Iowa during a period of rapid crop growth. This algorithm is based on the assumption that a unique relationship between radiometric surface temperature ( T R ) relationship and vegetation index (VI) exists at multiple resolutions. Four different methods for defining a VI026102 T R basis function for sharpening were examined, and an optimal form involving a transformation to fractional vegetation cover was identified. The accuracy of the high-resolution temperature retrieval was evaluated using aircraft and Landsat thermal imagery, aggregated to simulate native and target resolutions associated with Landsat, MODIS, and GOES short- and longwave datasets. Applying TsHARP to simulated MODIS thermal maps at 1-km resolution and sharpening down to 6502250m (MODIS VI resolution) yielded root-mean-square errors (RMSE) of 0.67–1.35°C compared to the ‘observed’ temperature fields, directly aggregated to 250m. Sharpening simulated Landsat thermal maps (60 and 120m) to Landsat VI resolution (30m) yielded errors of 1.8–2.4°C, while sharpening simulated GOES thermal maps from 5km to 1km and 250m yielded RMSEs of 0.98 and 1.97, respectively. These results demonstrate the potential for improving the spatial resolution of thermal-band satellite imagery over this type of rainfed agricultural region. By combining GOES thermal data with shortwave VI data from polar orbiters, thermal imagery with 250-m spatial resolution and 15-min temporal resolution can be generated with reasonable accuracy. Further research is required to examine the performance of TsHARP over regions with different climatic and land-use characteristics at local and regional scales.

DOI

[20]
Nichol J E.An emissivity modulation method for spatial enhancement of thermal satellite images in urban heat island analysis[J]. Photogrammetric Engineering and Remote Sensing, 2009,75(5):1-10.This study examines and validates a technique for spatial enhancement of thermal satellite images for urban heat island analysis, using a nighttime ASTER satellite image. The technique, termed Emissivity Modulation, enhances the spatial resolution while simultaneously correcting the image derived temperatures for emissivity differences of earth surface materials. A classified image derived from a higher resolution visible wavelength sensor is combined with a lower resolution thermal image in the emissivity correction equation in a procedure derived from the Stephan Bolzmann law. This has the effect of simultaneously correcting the image-derived "Brightness, Temperature" (Tb) to the true Kinetic Temperature (Ts), while enhancing the spatial resolution of the thermal data. Although the method has been used for studies of the urban heat island, it has not been validated by comparison with "in situ" derived surface or air temperatures, and researchers may be discouraged from its use due to the fact that it creates sharp boundaries in the image. The emissivity modulated image with 10 m pixel size was found to be highly correlated with 18 in situ surface and air temperature measurements and a low Mean Absolute Difference of 1 K was observed between image and in situ surface temperatures. Lower accuracies were obtained for the Ts and Tb images at 90 m resolution. The study demonstrates that the emissivity modulation method can increase accuracy in the computation of kinetic temperature, improve the relationship between image values and air temperature, and enable the observation of microscale temperature patterns.

DOI

[21]
Sobrino J A, Jiménez-Munoz J C, Paolini L. Land surface temperature retrieval from LANDSAT TM 5[J]. Remote Sensing of Environment, 2004,90(4):434-440.<h2 class="secHeading" id="section_abstract">Abstract</h2><p id="">In this paper, three methods to retrieve the land surface temperature (LST) from thermal infrared data supplied by band 6 of the Thematic Mapper (TM) sensor onboard the Landsat 5 satellite are compared. The first of them lies on the estimation of the land surface temperature from the radiative transfer equation using in situ radiosounding data. The others two are the mono-window algorithm developed by Qin et al. [International Journal of Remote Sensing 22 (2001) 3719] and the single-channel algorithm developed by Jim&eacute;nez-Mu&ntilde;oz and Sobrino [Journal of Geophysical Research 108 (2003)]. The land surface emissivity (LSE) values needed in order to apply these methods have been estimated from a methodology that uses the visible and near infrared bands. Finally, we present a comparison between the LST measured in situ and the retrieved by the algorithms over an agricultural region of Spain (La Plana de Requena-Utiel). The results show a root mean square deviation (rmsd) of 0.009 for emissivity and lower than 1 K for land surface temperature when the Jim&eacute;nez-Mu&ntilde;oz algorithm is used.</p>

DOI

[22]
Chen Y H, Li X B, Shi PJ, et al.Study on spatial pattern of urban heat environment in Shanghai City[J]. Scientia Geographica Sinica, 2002,22(3):317-323.The spatial heat environment is a thermal phenomena of whole spatial environment of a city. The research of urban spatial heat environment will find the change of urban spatial structure and urban scale and lead to sustainable urban development and improve the quality of human habitation environment. Urban heat environment synthetical phenomina reflecting urban environment and spatial thermal environment have full impacts on microclimate and urban zoology. The aim for this paper is to seek an effective method to analysis spatial pattern of thermal environment. Supporting with the remote sensing technology and GIS, the authors studied the estimate system of heat environment spatial pattern and dynamic evolvement. The main results are as fellows: (1) A method to analysis spatial pattern of urban heat environment was pointed out with GIS and remote sensing technology supporting in this paper. Using the viewpoint of landscape ecosystem for reference, the authors generated the idea of "thermal landscape", analyzed the mechanism of "thermal landscape" and developed estimate systems of spatial pattern of thermal landscape and dynamic variety. (2) Through research on Shanghai City by viewpoint of "thermal landscape", it was proved that "thermal landscape" in this city is felling to pieces and increase consumption of heat energy and expend the area of greenbelt and water is an effective way to weaken heat affect. (3) Supporting with GIS, the authors studied dynamic evolvement of "thermal landscape" and its change process according to the change of multi temporal "thermal landscape" in Shanghai in 1990,1995,1998 based on remotely sensing data. The change intension trend of dominance degree of thermal landscape from 1990 to 1998 in Shanghai City were pointed out. The method to study spatial structure and thermal landscape pattern of urban heat environment promoted the development in the field into quantitative segment. In the present study, this model seems to be a viable method for city programming in the metropolis.

DOI

[23]
Hardin P J, Jensen R R.The effect of urban leaf area on summertime urban surface kinetic temperatures: A Terre Haute case study[J]. Urban Forestry and Urban Greening, 2007,6(2):63-72.<h2 class="secHeading" id="section_abstract">Abstract</h2><p id="">The urban heat island effect (UHIE) has been documented in many temperate region cities. One cause of the UHIE is the replacement of green spaces with impervious materials as urbanization commences and the city builds up and fills in. During the summer, elevated urban temperatures result in increased electricity usage, higher pollution levels, and greater resident discomfort. Through evapotranspiration and the interception of solar radiation, increasing urban tree canopy cover can help mitigate the UHIE. While this is universally accepted, the exact statistical relationship between urban leaf area (as measured by leaf area index, LAI) and urban temperatures has not been extensively studied. In a case study conducted in urban/suburban Terre Haute, Indiana, USA, simple linear regression was employed to quantify the relationship between <em>in situ</em> ceptometer LAI measurements and surface kinetic temperatures (SKTs) measured using thermal satellite imagery acquired at 1100 local time. For the 143 sample sites located in the study area, LAI accounted for 62% of the variation in surface temperature. For every unit increase in LAI, surface temperature decreased by 1.2&#xA0;&deg;C.</p>

DOI

[24]
Tan Y S, Shen Z Q, Jia C Y, et al.The study on image fusion for medium and high spatial resolution remote sensing images[J]. Remote Sensing Technology and Application, 2007,22(4):536-542.<p>With the principles of image fusion methods, this paper focused on finding a proper method for fusing the panchromatic and multi-spectral images of QuickBird, SPOT5 and Landsat ETM+. Brovey,SVR, PCA, Pansharp and Gram-schmidt were used in this paper. The results showed that within these<br />methods,①the optimum method for QuickBird image was Gram-schmidt transform.②Pansharp transform was the optimum for SPOT5 image.③For ETM+ image, the Gram-schmidt transform was the best method from the view of preserving spectral information of multi-spectral image; Brovey transform presented the best spatial information for band 2 and band 3, SVR transform obtained the better spatial effects than other transforms for band 1, 5, 7, and Pansharp transform was the best method for band 2.</p>

文章导航

/