遥感科学与应用技术

基于投影寻踪学习网络算法的植物群落高分遥感分类研究

  • 杜欣 , 1 ,
  • 黄晓霞 , 1, * ,
  • 李红旮 1 ,
  • 沈利强 2
展开
  • 1. 中国科学院遥感与数字地球研究所,北京 100101
  • 2. 深圳规划国土发展研究中心,深圳 518040
*通讯作者:黄晓霞(1970-),女,博士,研究员,研究方向为非再生资源遥感应用。E-mail:

作者简介:杜欣(1989-),女,硕士生,研究方向为生态遥感应用。E-mail:

收稿日期: 2015-01-16

  要求修回日期: 2015-03-06

  网络出版日期: 2016-01-10

基金资助

深圳市基本生态控制线专项调查

深圳市2012年测绘地籍工程计划项目([2012]0365)

Research on Classification of Plant Community Using Projection Pursuit Learning Network Algorithm on High Resolution Remote Sensing Images

  • DU Xin , 1 ,
  • HUANG Xiaoxia , 1, * ,
  • LI Hongga 1 ,
  • SHEN Liqiang 2
Expand
  • 1. Institute of Remote Sensing and Digital Earth of Chinese Academy of Sciences, Beijing 100101, China
  • 2. Planning and Land Development Research Center of Shenzhen Shenzhen 518040, China
*Corresponding author: HUANG Xiaoxia, E-mail:

Received date: 2015-01-16

  Request revised date: 2015-03-06

  Online published: 2016-01-10

Copyright

《地球信息科学学报》编辑部 所有

摘要

传统的植物群落调查方法主要是野外样地调查和抽样统计,其对于地形复杂的区域难以做到对数据的全面调查;将遥感技术应用于植物群落调查,可实现数据的全面获取,以及对植物群落的快速分类。在深圳市植物群落野外样地调查的基础上,本文应用高分辨率Pléiades影像,结合光谱、地形及纹理信息,采用投影寻踪学习网络的方法,实现了深圳市东部地区植物分类。在实验中,选取人工林和次生林中典型群落样本,将投影寻踪与学习网络算法结合应用于植被分类,通过分类结果与经典监督分类方法比较表明,该算法应用于植物群落分类是可行的;并且该算法分类精度高,更新速度快,能满足深圳市重点项目基本生态控制线专项调查的要求。

本文引用格式

杜欣 , 黄晓霞 , 李红旮 , 沈利强 . 基于投影寻踪学习网络算法的植物群落高分遥感分类研究[J]. 地球信息科学学报, 2016 , 18(1) : 124 -132 . DOI: 10.3724/SP.J.1047.2016.00124

Abstract

Plant community is a significant content in the ecosystem. Traditional investigation method for plant community is mainly based on statistical sampling, which is limited by the data acquisition from complex terrain areas. In contrast, high-resolution remote sensing technique provides a convenient way to quickly access data in a large area. To overcome the shortcomings derived from the high dimensional features, which is caused by related data increasing, we choose the algorithm of projection pursuit learning network (PPLN) along with field samples of typical plant communities to realize a fast classification on the vegetation in the east of Shenzhen. Then,in the experiment, the spectral and texture information extracted from Pléiades images, and the terrain interpolated from topographic map are selected and used to build high dimensional features, which is crucial to the vegetation classification using remote sensing images. The learning network for projection pursuit is applied to discriminating the typical communities in both plantation and natural secondary forest in the study area. Compared with Maximum-likelihood classification (MLC) and Support Vector Machine (SVM), PPLN can achieve more accurate results for plant community classification. As a conclusion, the plant community classification with PPLN meets the requirements of the investigation project, achieves the quick updating of some basic information related to forest resources, and looks forward to involve in some other ecological research as well.

1 引言

植物群落(Plant Community)在特定空间和时间范围内,有一定的植物种类组成、外貌及结构与环境形成的相互关系,并具有特定功能的植物集合体。传统的植物群落调查方法是对野外样地和抽样统计,进行大规模树种分类和量测,这种以个体来推断总体的传统方式已很难满足野外全面调查精度要求。高空间分辨率遥感影像地物几何结构和纹理信息明显,便于认知地物目标的属性特征[1],在提取地面信息、植被信息等方面,具有较强的识别能力,可提供更多有效的空间数据信息[2],实现高空间分辨率遥感影像植物群落的识别研究。
目前高分辨率遥感影像主要应用于植物覆被变化、群落构成及生态因子的估测[3-8],以及不同种类植被的信息提取或分类研究[9-16]。国内外相关研究主要集中在传统图像特定群系群落识别分类方面,在分类算法上需有效整合光谱、纹理,以及地理背景信息的综合分析。
2005年,深圳市率先划定了基本生态控制线,为生态资源的保护,城市格局的优化,起到了关键作用。深圳市以亚热带植被覆被为主,森林类型复杂,受城市发展的影响,破碎度高,导致实地调查工作量加大。建市以来通过野外调查,完成梧桐山、银湖山、凤凰山等森林公园中部分区域群系群落调查制图,由于群落调查复杂,大部分区域还是空白。本文利用高分辨率遥感影像,结合野外样地进行生态线内典型植物群落分类,解决基本生态控制线分级、分类管理的基础生态数据不完善等问题。
投影寻踪是融合统计学、应用数学和计算机技术的新算法[17]。该方法可将高维数据投影到低维子空间上,寻找反映原高维数据的结构或特征的投影,进而达到研究和分析高维数据的目的。近年来,许多学者[18-22]在研究中广泛使用高分辨率影像,而投影寻踪理论算法给海量遥感影像数据处理带来新的革命。自20世纪90年代以来,投影寻踪方法实现了光谱分析[23]、地物分类[24-25]、特征提取[26-27]、目标检测[28]、相关生态因子提取[29-30]等多方面应用,取得较好的研究成果。本文以群落野外样地调查数据及高空间分辨率遥感影像为基础,运用投影寻踪学习网络算法,进行深圳市东部地区典型植物群落分类研究,实现了生态数据的快速更新,为森林资源、城市规划和生态安全评价提供决策。

2 研究区与数据

本文以深圳市东部地区生态控制线内作为主要研究区域,东部片区主要包括罗湖区、盐田区、龙岗区(坪山新区、大鹏新区)等区域。深圳市陆域位于东经113°46′~114°37′,北纬22°27′~22°52′。该地区地带性原生植被以南亚热带季风常绿阔叶林和热带季雨林为主,林地包括人工林地和天然林地2大类型。人工林主要为深圳早期林业发展过程中,残留下来的多个人工经济林(桉树林、相思林,以及更早期的马尾松林、杉木林),在得到保护后,经过自然演替而形成的植被,简单分为相思类群落、桉树类群落、马尾松类群落、杉木类群落,以及少量混杂生长在一起的组合类群落。此外,还有部分荷木类群落组成的防火林地。天然林地主要为天然的次生南亚热带常绿阔叶林,集中在东部区域的局部山地保存有较为完好的原生植被。其包括7个亚型:沟谷常绿阔叶林地、低地常绿阔叶林地、低山常绿阔叶林地、山地常绿阔叶林地、山顶常绿灌木林地、红树林地和次生灌草丛地。园地分为果园地、茶园地和其他组合。其中,果园地基本生态控制线内主要以荔枝林为主,兼有少量的龙眼林、柑橘林等。
(1) 数据来源
采用法国Astrium GEO-Information Services经营的2个星座型双子星Pléiades 1A/1B遥感数据作为主要信息源,包含全色和多光谱(B、G、R、NIR)模式,波段信息如表1所示,其中,数据的全色影像 分辨率为0.5 m,多光谱影像分辨率为2 m,幅宽为20 km,卫星重访周期1-3 d。实验中影像获取时间为2012年11月7日,覆盖深圳全境(图1)。
Tab. 1 Bands information of Pléiades data

表1 Pléiades数据波段信息

光谱类型 波段范围(nm) 分辨率(m)
全色(Pan) 480 ~ 830 0.5
蓝(B) 430 ~ 550 2
绿(G) 490 ~ 610 2
红(R) 600 ~ 720 2
近红外(NIR) 750 ~ 950 2
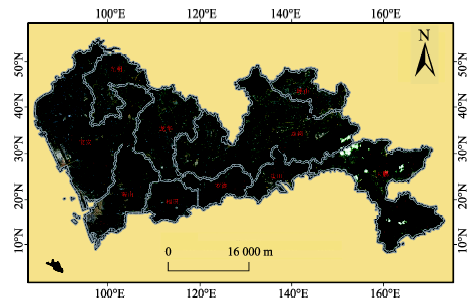
Fig. 1 Distribution of collected sample points in the field

图1 野外采集样本点分布图

(2) 数据预处理
对原始影像做辐射定标、几何纠正、影像融合等处理,转换为深圳市独立坐标系,便于样本特征的选取及判读。其中,辐射定标处理是依据卫星数据参数做了辐射值的增益及偏移计算,几何纠正则采用深圳二等平面控制点完成处理,精纠正和影像匹配精度均优于0.2 m。
(3) 群落野外样方调查
野外样地调查数据信息见表2。实测样方共98个,参考“生态环境状况评价技术规范(试行)”(HJ/T 192-2006)要求,植被生态信息调查的基本单元为小班林地,小班林地在亚热带区域样方面积在800~1000 m2,本实验采用800 m2样方,分布如图1所示。
Tab. 2 Example list of the sample species information

表2 样方物种信息示例表

序号 群落名称 生态系统类型 种名 多度 频度 相对多度(%) 相对频度(%) 显著度(%) 重要值
64 台湾相思 人工林 台湾相思 481 9 83.8 25 91.6 200.4
野牡丹 55 7 9.58 19.44 3.9 32.92
鸭脚木 7 5 1.22 13.89 2.32 17.42
桃金娘 6 4 1.05 11.11 0.21 12.37
银柴 12 3 2.09 8.33 1.19 11.62
梅叶冬青 3 3 0.52 8.33 0.2 9.05
栀子 4 2 0.7 5.56 0.11 6.36
变叶榕 3 2 0.52 5.56 0.14 6.22

3 投影寻踪学习网络算法的植物群落分类

投影寻踪的基本思想源于人们对低维空间几何图形的直观理解。它包含2方面的含义:(1)投影(Projection),将高维空间中的数据投影到低维空间;(2)寻踪(Pursuit),利用低维空间投影数据的几何分布形态,发现人们感兴趣的数据内在特征和相应的投影方向。按照具体问题的要求,需要事先确定一种能衡量投影是否有意义的指标,称为投影指标。投影寻踪算法能满足非正态高维数据分析的需求,较好地排除与结构无关变量或噪声的影响,具有较好的稳健性。
投影寻踪学习网络(PPLN)是投影寻踪回归方法和人工神经网络相结合构成的一种新型网络,它实质上是一类径向基函数网络。1992年,Jones[31]首次提出投影寻踪学习网络的概念,1994年Hwang等[32]将投影寻踪学习网络应用于非线性函数的逼近和函数的平滑。
投影寻踪学习网络(图2)可视为一般化的具有一个隐藏层的sigmoid非线性函数的前馈神经网络,一种更广泛意义上的网络回归模型。非参数PPLN应用时有一定的局限性,因此,参数神经元函数为主的PPLN模型依然是主要发展方向。
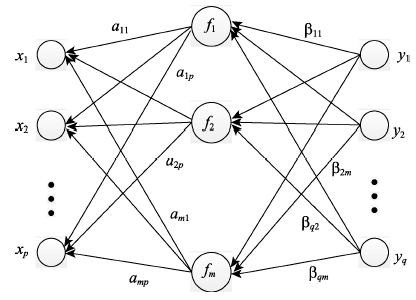
Fig. 2 Sketch map of the project pursuit learning network

图2 投影寻踪学习网络示意图

PPLN的前馈近似公式表示为式(1):
y ^ i = k = 1 m β ik f k j = 1 p α kj x j = k = 1 m β ik f k α k T X (1)
式中: β ik 为投影权重; f k 为一个特定形式的未知光滑激活函数(如Hermit多项式); α kj 为投影方向。这3组参数通过训练网络使均方误差损耗函数达到最小来确定。
L 2 = i = 1 q ω i E y i - y ^ i 2 (2)
式中: ω i 表示每个输出均方误差对总损耗的相应贡献。
PPLN中传统训练算法每次训练一个隐含层单元,而BP神经网络一次训练所有的隐含层神经元。相应于第k隐含层神经元的算法描述如下:
(1)对 α k f k β ik 赋初值;
(2)用高斯牛顿优化算法来估计 α ^ k = α k + ,其中, 通过式(3)计算;
i = 1 q ω i E 2 u i α k 2 T u i + u i α k T u i α k = - i = 1 q ω i E u i α k T u i (3)
其中, u i α k = - β ik f k α k T X X 2 u i α k 2 = - β ik X T f k α k T X X
R i k = y i - β ik g l ( α l T X ) 则, u i = R i k - β ik g k ( α k T X )
(3)已知 α k ,依据平滑曲线最佳匹配散点图 z kl , f ^ k z kl 估计 f k ,其中 z kl = α k T X l ;
f ^ k α k T X l = i = 1 q ω i β ik R li ( k ) i = 1 q ω i β ik 2 (4)
本文用标准正交化Hermit多项式逼近隐层激活函数 f k ,使其能更快更准确地求导计算,并在计算回归函数值时获得更平滑的插值。
(4)重复(2)、(3)步进行几次迭代;
(5)利用最新的 f k α k 估计 β ik ;
β ^ ik = E R i ( k ) f k ( α k T X ) E f k ( α k T X ) 2 i = 1,2 , , q (5)
(6)考虑到 β ik , α k f k 结合第k神经元,重复(2)-(5)步直到误差 L 2 ( ne w - L 2 ( ol d L 2 ( ol d 小于给定阈值。
本文采用线性最小二乘法(Linear LS)估计输出权重,一维数据平滑函数估计中间层非线性激活函数,高斯牛顿(Gauss-Newton)非线性最小二乘法估计输入层权重,步骤如下:
(1)训练样本各维度的归一化处理。设定各维度的样本集为 x ij i = 1,2 , , N ; j = 1,2 , , p ,其中, x ij 为第 i 个样本的第 j 维对应的特征值,N p 分别代表了训练样本个数和特征值数目。为了较好地统一各特征值的变化范围,采用(6)式进行归一化处理:
x ij * = Var x j * × x ij (6)
式中:Var为模型初始设定的值,本文中设定为0.5。
x j * = i = 1 N x ij - x j ¯ 2 N (7)
式中: x j ¯ 为所有样本每一类特征值的平均值;
(2)构造投影指标函数。利用生长函数训练每一层隐层神经元的多个节点进行计算,寻找到每一层的 β i ,本文经过多次试验,得到节点数为8,分类效果较好,设置最小节点数为6,最大节点数为12;
(3)优化投影指标函数。采用递归迭代方法寻求最佳投影,将初始方向设定为 x j * ,然后利用Hermit七次多项式进行计算,获得残差最小的方向,即认为是最佳投影方向;
(4)由步骤(3)求得的最佳投影方向 α 代入投影指标函数中,计算各样本的投影值。
维度号1-4分别对应了Pléiades多光谱波段的辐射率数据,由于数据的光谱波段数有限,在研究中单纯依靠光谱数据较难实现光谱特征相似的植物群落分类,因此,根据式(8)将样本点作像元比值运算,得到不同波段辐射率之间的比值(维度号5-10),进而增强地物波谱特征间的微小差异,抑制亮度差异、地形或大气选择性吸收的影响,突出不同植物群落间的波谱差异。
R i = B K B L K < L K L = 1,2 , 3,4 (8)
式中: B K , B L 代表遥感影像对应的波段; R i 代表不同的波段比值参数。
归一化植被指数(Normalized Difference Vegetation Index,NDVI)是目前在植被相关研究中被广泛应用的植被指数,计算简单且可反映出植物冠层的背景影响,因此,本文用公式 ( NDVI = B NIR - B R B NIR + B R ) 获得NDVI影像图,其中, B R B NIR 分别代表高分辨率影像辐射定标后的红波段和近红外波段辐射值。将NDVI(维度号11)作为输入特征,反映出不同植被覆被之间的差异性。
不同高程范围存在的植物群落有差异,坡度、坡向决定了植被的受光照强度,对于植物群落的分布有一定的影响。研究区以丘陵地为主,加入高程、坡度(维度号12-13)作为特征变量。
纹理反映了影像的灰度统计信息、地物本身的结构特征和地物空间排列的关系。高空间分辨率遥感影像的纹理较清晰,可反映更多的地表信息。不同植物群落以不同的纹理特征呈现,在分类过程中加入一定的纹理特征有助于提高影像的分类精度。
灰度共生矩阵(GLCM)是一种常用的纹理特征提取方法,能较好地反映纹理灰度级相关性的规律,以及图像灰度关于方向、相邻间隔、变化幅度的综合信息,是分析图像局部模式结构及排列规则的基础,辅助遥感影像纹理分类。本文利用GLCM方法生成区域范围内的纹理图像,利用多个纹理量从多个侧面描述不同植物群落的纹理特征,对比各波段纹理特征,最终挑选了植被纹理信息相对丰富的部分波段的均值、相关性及熵等信息(维度号14-18)。
利用PPLN算法,分别利用不同维度的输入变量,在深圳市不同位置选取样区进行实验,结果表明,仅利用原始影像多光谱4个波段,植物群落分类总体精度低于60.0%;加入波段比值变量后,总体分类精度可达60.0%,但有部分植物群落(如浙江润楠)分类精度,仍仅有40.0%,加入NDVI及地形信息变量,总体分类精度达65.5%~70.0%,增加纹理信息变量后,总体精度优于70.0%,因此,本文将包含光谱、地形及纹理等18维信息(表3),作为算法中投影的不同特征,即输入变量、输出变量为类别值。其中,多光谱波段变量利用深圳二等平面控制点进行坐标精校正、辐射校正等预处理后,生成分辨率为2.0 m的蓝、绿、红和近红外4个波段反射率数据;波段比值、NDVI及纹理信息均由此数据 派生;以深圳市规划发展中心提供的1:10 000地形数据为基础,插值生成2.0 m分辨率的高程及坡度数据。
Tab. 3 List of input variables

表3 输入变量列表

维度序号 输入变量 表达信息 维度序号 输入变量 表达信息
1 B1 蓝波段 10 R6 B3/B4
2 B2 绿波段 11 NDVI 植被指数
3 B3 红波段 12 Elevation 高程
4 B4 近红外波段 13 Slope 坡度
5 R1 B1/B2 14 Mean(B3) 红波段均值
6 R2 B1/B3 15 Correlation(B3) 红波段相关性
7 R3 B1/B4 16 Mean(B4) 近红外波段均值
8 R4 B2/B3 17 Correlation(B4) 近红外波段相关性
9 R5 B2/B4 18 Entropy(B4) 近红外波段熵

4 植物群落高分遥感分类结果及分析

分类结果表明,在试验区内人工林、自然林各占一半,面积分别为268 km2和258 km2。人工林以相思类群落和桉树类群落,以及二者混合类群落为主,比例分别为36%、18%及44%。自然林以浙江润楠类群落(比例为47%)为主,其次是鸭脚木类群落(比例为25%)、藜蒴类群落、降真香类等。
为了验证算法的精度,本文选择有代表性的浙江润楠-鸭脚木群落(Comm.Machiluschekiangensis-Scheffleraoctophylla)和相思林群落(Comm. Acacia)样本点各100个作为算法的验证样本,分别采用最大似然法、支持向量机(Support Vector Machine,SVM)算法及PPLN算法对样本点进行分类,对比几种算法的分类精度。
利用样本点进行植物群落实验区分类总体精度见表4
Tab. 4 Comparison of classification accuracies amongseveral methods

表4 各方法分类结果精度对比表

分类方法 类别
相思群落 分类精度(%) 浙江润楠-鸭脚木群落 分类精度(%)
最大似然法 91 91 70 70
SVM算法 90 90 70 70
PPLN算法 93 93 73 73
从样本点分类的整体精度上看,将投影寻踪学习网络算法,应用于深圳市东部地区典型植物群落分类具有可行性,2种典型群落的分类精度投影寻踪算法,均高于其他2种较为经典的分类方法,且总体精度基本达到分类算法所需精度,特别是相思群落的分类精度PPLN算法,高于其他2种分类方法,且达到了93%的水平。其中,相思群落的分类精度明显高于浙江润楠-鸭脚木群落,分析其原因:(1)相思群落较浙江润楠-鸭脚木群落,群落组成较为单一,相思群落中的马占相思、台湾相思从影像上表现出的光谱、纹理信息等相对一致,在人工选择训练样本和测试样本时受干扰因素较小;(2)浙江润楠-鸭脚木群落作为自然生长的群落,纹理比较复杂多样,且分布上较为零散,同时,自然生长的林地下部容易受到其他灌木、草木等因素的影响。
在深圳市东部地区的东南部大鹏湾地区(A测试区,图3(a))和北部清林泾地区(B测试区,图3(b))分别选取2块包含有不同群落类型的区域进行算法验证。以实测数据点的信息为检验样本,A区域包含人工林—相思林群落(Comm. Acacia)、天然林—浙江润楠群落(Comm. Machiluschekiangensis)和鸭脚木群落(Comm. Scheffleraoctophylla),B区域包含桉树林群落(Comm. Eucalyptus)、相思林群落(Comm. Acacia)及荔枝林,A、B区域实地调查分类结果如图4(a)、图5(a)所示,A、B区域运用3种方法进行分类,结果分别如图4(b)-(d)、图5(b)-(d)所示,精度评价如表5、6所示。
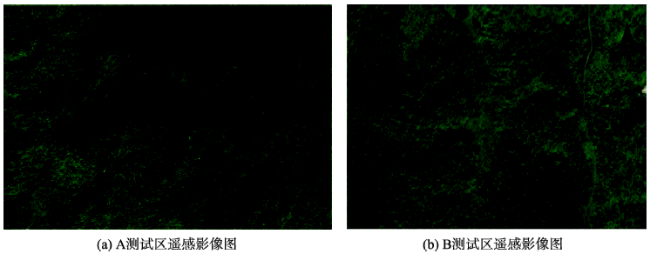
Fig. 3 Remote sensing images of two test regions

图3 2个测试区遥感影像图

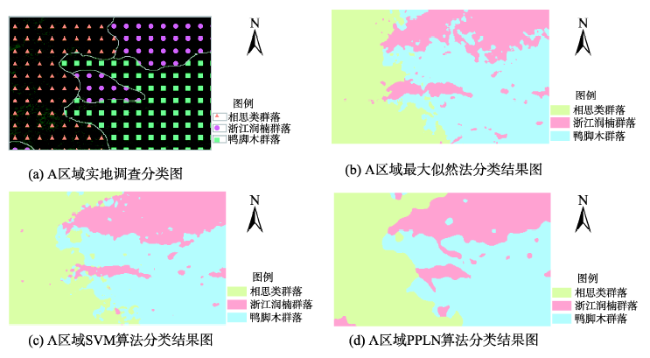
Fig. 4 Investigation classification map and classification result with three methods for region A

图4 A区域实地调查分类图及3种方法分类结果

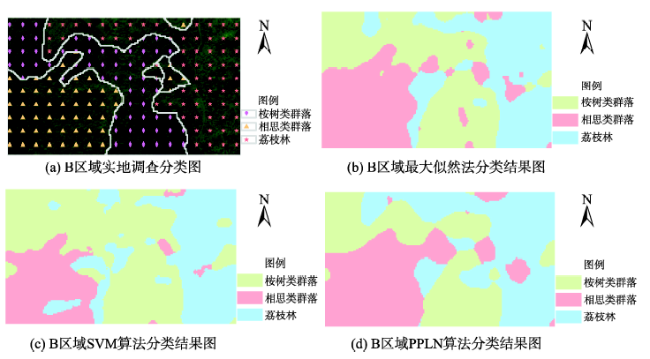
Fig. 5 Investigation classification map and classification result with three methods for region B

图5 B区域实地调查分类图及3种方法分类结果

Tab. 5 Assessment list of region A′s classification accuracy

表5 A区域分类精度评价表

分类方法 类别 生产者精度(%) 用户精度(%) 总体精度(%) Kappa系数
最大似然法 相思林群落 76.01 89.30 70.0 0.64
浙江润楠群落 63.89 59.83
鸭脚木群落 80.66 76.40
SVM算法 相思林群落 80.04 84.37 78.0 0.68
浙江润楠群落 67.15 73.22
鸭脚木群落 83.01 75.42
PPLN算法 相思林群落 80.01 87.49 80.6 0.70
浙江润楠群落 75.24 68.15
鸭脚木群落 82.83 82.06
Tab. 6 Assessment list of region B′s classification accuracy

表6 B区域分类精度评价表

分类方法 类别 生产者精度(%) 用户精度(%) 总体精度(%) Kappa系数
最大似然法 桉树林群落 78.87 65.62 72.0 0.61
相思林群落 76.98 75.24
荔枝林 67.12 82.30
SVM算法 桉树林群落 62.41 91.03 73.7 0.60
相思林群落 83.41 62.72
荔枝林 77.43 67.92
PPLN算法 桉树林群落 80.05 80.64 80.7 0.71
相思林群落 83.31 74.95
荔枝林 79.16 86.14
从分类精度评价表中看出,试验区利用PPLN算法分类的整体精度均在75.0%以上,较最大似然方法,在单独的类别精度和总体精度上都更高,与SVM算法比较,在大部分群落分类精度都更好;从各种算法的kappa系数观察,PPLN算法的精度较好且结果更优。
在分类过程中某些类别精度不太高,原因包括:(1)试验区中同一群落区域中树种分布和稀疏程度不同,以及有碎块式的裸露地表存在,造成光谱和纹理差异,在一定程度上影响了最终的分类精度;(2)很多群落的优势建群种不明显,树种组成出现逐渐过渡现象,难于区分群落边界;(3)检测时依照的是实地调查分类结果,以小区域为基础进行群落划分,而利用算法进行影像分类时,以像元为基础进行划分,导致精度验证时有一定的误差出现。
分类的结果图及验证的精度说明,利用投影寻踪算法能有效区分深圳主要群落类型,精度高于70.0%,优于最大似然法和SVM分类,能满足深圳市生态控制线内生态调查典型群落划分需求。

5 结论

在深圳市生态控制线内生态调查项目支持下,本文提出的基于投影寻踪学习网络算法的植物群落分类方法,对投影寻踪算法优化,加快投影指标的选择,实现投影的全局优化,提高部分群落的分类精度,并使其在细节上具有更好的提取效果。通过实地调查数据与遥感影像数据的结合,验证了算法的可行性,实现了高分辨率遥感影像典型植物群落的快速分类。算法在群落分类中得到验证,扩展了投影寻踪算法的应用范围。该方法已应用于深圳市基本生态控制线专项调查项目中,实现了深圳市的人工林和天然林典型群落样本的分类。由于受影像噪声,及植被稀疏分布的影响,分类中细碎图斑过多,在未来研究中,可考虑将投影寻踪算法扩展、优化,与面向对象分割相结合,自动去除小于群落最小面积细碎图斑,提高群落分类效率,优化群落分类效果。

The authors have declared that no competing interests exist.

[1]
陈君颖,田庆久.高分辨率遥感植被分类研究[J].遥感学报,2007,11(2):221-227.以南京市区的植被覆盖为研究对象,基于IKONOS遥感影像,采用决策树分类算法,根据各种植被光谱特征建立知识库,提出基于光谱信息的植被分类方法,继而结合高分辨率影像特有的纹理特征引进局部一致性指数对该方法进行改进,提出结合纹理信息的高分辨率遥感植被分类方法,分类总体精度从仅利用光谱信息的83.16%显著提高到91.89%,Kappa系数达到0.8886。采用Quickbird遥感影像对该方法进行验证,分类总体精度为91.94%,Kappa系数为0.8783,表明该植被分类方法能有效地对植被进行分类与识别,精度较高,且对于不同数据源的植被分类具有一定的普适性,为实现植被的自动化提取提供了理论依据和有效的方法途径。

DOI

[ Chen J Y, TianQ J. Vegetation classification based on high—resolution satellite image[J]. Journal of Remote Sensing, 2007,11(2):221-227. ]

[2]
陈志勇. 基于高分辨率遥感影像的城市土地覆被变化分析研究[D].兰州:兰州交通大学,2013.

[ Chen Z Y.City land cover change analysis with high resolution remote sensing images[D]. Lanzhou: Lanzhou Jiaotong University, 2013. ]

[3]
Dabrowska-Zielinska K, Gruszczynska M, Lewinski S, et al.Application of remote and in situ information to the management of wetlands in Poland[J]. Journal of Environmental Management, 2009,90(7):2261-2269.<h2 class="secHeading" id="section_abstract">Abstract</h2><p id="">The protection and regeneration of wetlands has been of crucial importance as a goal in ecological research and in nature conservation for some time and is more important than ever now. Knowledge about the biophysical properties of wetlands' vegetation retrieved from satellite images enables us to improve the monitoring of these unique areas, which are otherwise very often impenetrable and therefore difficult to examine, analyze and assess by means of site visits. The Biebrza Wetlands are situated in the North-East part of Poland and are one of the largest areas made up of marshes and swamps in the entire EU. This is still one of the wildest areas and one of the least destroyed, damaged or changed by human impact. However, in the recent decades there have been attempts made to intensify and overexploit the natural resources of the region and implement new agriculture practices in the area. In this period, drainage canals have been built, and a good deal of the area has been drained. The area of this precious ecosystem covers 25?494&#xA0;ha. This valuable area of peat with unique vegetation species and with very special birds is one of the most valuable areas in Europe and in 1995 was added to the list of Ramsar sites.</p><p id="">The investigation of wetlands in the Biebrza River Valley has been carried out at ground level by taking measurements of soil moisture, evapotranspiration, Leaf Area Index, wet and dry biomass and the levels of ground water and meteorological parameters. Also examined were radiative temperature, detailed vegetation mapping, and APAR. For some years the deterioration of peat lands has been noticed due to the drying out of the area and the frequent outbreak of fires. The consequence is the succession of new vegetation and the appearance of new ecosystems. The Remote Sensing Centre in the Institute of Geodesy and Cartography has undertaken the investigation by applying ERS-2.SAR and ENVISAT ASAR of IS2 and IS4 and VV, HH, HV polarization for the purpose of modeling soil moisture and humidity changes of the area under investigation. The investigation also aimed at finding the best biophysical properties of wetlands' vegetation to characterize marshland habitats and its changes. At the same time as registering the microwave data, the optical data from Landsat ETM+, SPOT VEGETATION, ERS-2.ATSR, ENVISAT MERIS, and NOAA/AVHRR have been registered and information about the biomass and heat fluxes as sensible and latent heat has also been calculated. The vegetation indices are calculated from EO satellite data taking into account jointly the features of vegetation responsible for reflection in various bands and combining this information from several spectral bands. Also, the changes in the humidity of the area have been examined by extracting the backscattering coefficients from two SAR images that were taken at a similar period of the year but with a gap of 5 years. The information about soil moisture as retention, soil moisture changes, heat fluxes and evapotranspiration are all very important for estimates of CO<sub>2</sub> sequestration. The ENVISAT images have been obtained for the ESA AO-ID122 project. Also the SMOS and ALOS data will be applied for the Biebrza Wetlands in the future.</p>

DOI

[4]
刘瑜,韩震,柴勋.基于遥感的九段沙湿地植被群落动态变化分析[J].生态科学,2009,28(4):324-328.<p>九段沙是长江口重要的新生湿地.作为主要地物类型之一的植被群落,是反映潮滩湿地生态环境变化重要而又敏感的指标因子.本文通过1987~2008年六景Landsat卫星遥感数据对九段沙植被群落进行了分类提取,并利用ArcGIS软件分析了长江口九段沙植被群落20年来的时空动态变化.结果显示1987~1997年间,九段沙湿地植被以先锋植被海三棱藨草为主,植被面积随潮滩不断淤涨而增长;1997年人工促淤种植了芦苇和互花米草,至2008年,芦苇、互花米草和海三棱藨草三种植被群落所占植被总面积百分比分别为31.47%、39.35%和29.17%,其中外来物种互花米草优势明显,当地植被海三棱藨草所占面积比例显著下降.</p>

[ Liu Y, Han Z, Chai X.The dynamic changes analysis of the vegetation community in Jiuduansha tidal flat by using remote sensing[J]. Ecological Science, 2009,28(4):324-328. ]

[5]
王莹. 基于遥感的武汉市城市绿地群落三维绿量测算[D].武汉:华中农业大学,2010.

[ Wang Y.Three-dimensional green measure and calculate of Wuhan City green community based on RS[D]. Wuhan: Huazhong Agricultural University, 2010. ]

[6]
Pan X J, Mannino A, Marshall H G, et al.Remote sensing of phytoplankton community composition along the northeast coast of the United States[J]. Remote Sensing of Environment, 2011,115(12):3731-3747.

[7]
Eckert S, Engesser M.Assessing vegetation cover and biomass in restored erosion areas in Iceland using SPOT satellite data[J]. Applied Geography, 2013,40:179-190.Due to highly erodible volcanic soils and a harsh climate, livestock grazing in Iceland has led to serious soil erosion on about 40% of the country's surface. Over the last 100 years, various revegetation and restoration measures were taken on large areas distributed all over Iceland in an attempt to counteract this problem. The present research aimed to develop models for estimating percent vegetation cover (VC) and aboveground biomass (AGB) based on satellite data, as this would make it possible to assess and monitor the effectiveness of restoration measures over large areas at a fairly low cost. Models were developed based on 203 vegetation cover samples and 114 aboveground biomass samples distributed over five SPOT satellite datasets. All satellite datasets were atmospherically corrected, and digital numbers were converted into ground reflectance. Then a selection of vegetation indices (VIs) was calculated, followed by simple and multiple linear regression analysis of the relations between the field data and the calculated VIs.<br/>Best results were achieved using multiple linear regression models for both %VC and AGB. The model calibration and validation results showed that R-2 and RMSE values for most VIs do not vary very much. For percent VC, R-2 values range between 0.789 and 0.822, leading to RMSEs ranging between 15.89% and 16.72%. For AGB, R-2 values for low-biomass areas (AGB < 800 g/m(2)) range between 0.607 and 0.650, leading to RMSEs ranging between 126.08 g/m(2) and 136.38 g/m(2). The AGB model developed for all areas, including those with high biomass coverage (AGB > 800 g/m(2)), achieved R-2 values between 0.487 and 0.510, resulting in RMSEs ranging from 234 g/m(2) to 259.20 g/m(2). The models predicting percent VC generally overestimate observed low percent VC and slightly underestimate observed high percent VC. The estimation models for AGB behave in a similar way, but over- and underestimation are much more pronounced.<br/>These results show that it is possible to estimate percent VC with high accuracy based on various VIs derived from SPOT satellite data. AGB of restoration areas with low-biomass values of up to 800 g/m(2) can likewise be estimated with high accuracy based on various VIs derived from SPOT satellite data, whereas in the case of high biomass coverage, estimation accuracy decreases with increasing biomass values. Accordingly, percent VC can be estimated with high accuracy anywhere in Iceland, whereas AGB is much more difficult to estimate, particularly for areas with high-AGB variability. (C) 2013 Elsevier Ltd. All rights reserved.

DOI

[8]
刘晓双,黄建文,鞠洪波.高空间分辨率遥感森林参数提取探讨[J].林业资源管理,2009(2):111-117.介绍了高空间分辨率遥感在森林参数提取方面的研究和应用情况,并结合国内外学者在此方面所做出的研究成果,对不同森林参数的提取分别做了阐述,包括单木树冠轮廓信息、胸径、森林生物量、树种识别和分类、叶面积指数、森林郁闲度、木材结构和性质。最后分析了高空间分辨率遥感在森林参数提取方面存在的问题,并对该领域的应用前景作了展望。

DOI

[ Liu X S, Huang J W, Ju H B.Study on extraction of forest parameters by high spatial resolution remote sensing[J]. Forest Resources Management, 2009,2:111-117. ]

[9]
Cheng Q, Lin B, Ma T.The application of very high resolution satellite image in urban vegetation cover investigation: A case study of Xiamen City[J]. Journal of Geographical Sciences, 2003,13(3):265-270.<a name="Abs1"></a>With the technological improvements of satellite sensors, we will acquire more information about the earth so that we have reached a new application epoch of observation on earth environmental change and cartography. But with the enhancement of spatial resolution, some questions have arisen in the application of using traditional image processing and classification methods. Aiming for such questions, we studied the application of IKONOS very high resolution image (1 m) in Xiamen City on Urban Vegetation Cover Investigation and discussed the difference between the very high resolution image and traditional low spatial resolution image at classification, information abstraction etc. It is an advantageous test for the large-scale application of very high resolution data in the future.

DOI

[10]
肖海燕,曾辉,昝启杰,等.基于高光谱数据和专家决策法提取红树林群落类型信息[J].遥感学报,2007,11(4):531-537.高光谱遥感是进行地表植被观测的强有力工具,研究并验证有效的算法和数据支撑技术,对于合理利用高光谱数据进行地表植被监测与分析至关重要。在光谱特征分析和地面调查的基础上,基于决策树方法和高光谱分析方法的组合,以深圳市福田国家级自然保护区为例,利用高光谱数据进行红树林群落信息提取的实证研究。结果证实了Hymap数据对于红树林群落类型信息提取的数据支撑能力,以及相关方法用于红树林分类研究方面的有效性。

DOI

[ Xiao H Y, Zeng H, Zan Q J, et al.Decision tree model in extraction of mangrove community information using hyperspectral image data[J]. Journal of Remote Sensing, 2007,11(4):531-537. ]

[11]
程晋昕,余凌翔,鲁韦坤.基于高分辨率遥感影像的滇池湖滨湿地植被类型监测[J].云南地理环境研究,2013,25(6):1-7.利用多源高分辨率遥感影像,结合图像分割与人机交互判实技术,分 建设前(2007~2008年)、建设中(2011年)、建设后(2013年)3个时期对滇池湖滨湿地进行植被分布信息提取与面积统计,进而对其演变规律 进行分析.结果表明:随着“滇池湖滨生态带工程”的推进,环湖带乔木与灌木、沉浮水植物、草本植物3类湿地群落面积的总和从建设前的120.39 hm2提高至建设中的1747.54 hm2,再到建设后的1868.91 hm2,占总面积的比例分别为5.49%、79.61%和85.14%,湖滨湿地面积显著提升;建设前主要植被类型为作物植被,占总面积的51.98%, 建设后缩减至3.87%,逐步演化为自然植被,主要种类为中山杉(Ascendens mucronatum)、芦苇(Phragmites australis)等,群落多样性与景观格局也有了较大改观.

DOI

[ Cheng J X, Yu L X, Lu W K.Vegetation Types Monitoring of Dianchi Lakeside Wetland Based on High-spatial Resolution Remote Sensing Imagery[J]. Yunnan Geographic Environment Reasearch, 2013,25(6):1-7. ]

[12]
邹扬庆. 基于3S技术的中梁山植被演替识别与演替规律研究[D].重庆:西南大学,2014.

[ Zou Y Q.The research of vegetation succession recognition and succession law based on 3S technology in Zhongliang Mount[D]. Chongqing: Southwest University, 2014. ]

[13]
康峻,侯学会,牛铮,等.基于拟合物候参数的植被遥感决策树分类[J].农业工程学报,2014,30(9):148-156.针对目前遥感分类较少利用植被物候特征参数的现状,该研究以内蒙古自治区额尔古纳、根河两市作为试验区,基于2012年根河土地覆盖数据,采用双Logistic 函数拟合的方法对跨度范围为2011年7月下旬至2013年7月下旬的时间序列MODIS EVI 数据进行植被物候参数的分析与提取,并依据物候参数特征构建决策树对试验区土地覆盖进行分类。研究表明,不同植被的物候有较明显的特征,森林、草原与作物的生长季开始时间依次滞后,作物的生长季最短,森林与草原生长季基本持平;利用植被物候特征参数进行决策树分类,作物和森林2种植被类型取得较好分类效果,分类的总体精度达到73.67%,优于该区域MODIS土地覆盖产品的总体精度(66.08%)。该研究可为呼伦贝尔地区生态环境评价和农、牧、林业生产活动提供一定的参考。

[ Kang J, Hou X H, Niu Z, et al.Decision tree classification based on fitted phenology parameters from remotely sensed vegetation data[J]. Transactions of the Chinese Society of Agricultural Engineering, 2014,30(9):148-156. ]

[14]
李俊祥,达良俊,王玉洁,等.基于NOAA-AVHRR数据的中国东部地区植被遥感分类研究[J].植物生态学报,2005(3):336-343.该文采用19幅(时间跨8个 月)时间序列的NOAA_AVHRR的归一化植被指数(NDVI)最大值合成影像遥感数据,经过主分量分析 (Principlecomponentanalysis,PCA)处理后,用非监督分类方法的ISODATA算法,对中国东部地区的(五省一市)植被进 行分类,结果可以分出2 8种土地覆盖类型,除了两种类型为水体和城市或裸地外,其余2 6种类型均为植被类型,根据中国植被分类系统,这2 6类可以归并为6大植被类型:1)常绿阔叶林;2 )针叶林;3)竹林;4 )灌草丛;5 )水生植被;6 )农业植被。用1∶10 0 0 0 0 0数字化《中国植被图集》的植被类型检验遥感分类结果表明,针叶林、灌草丛、常绿阔叶林和农业植被的分类具有较高的位置精度和面积精度,位置精度分别为 79.2 %、91.3%、6 8.2 %和95 .9% ,面积精度分别达到92 .1%、95 .9%、6 3.8%和90 .5 %。这6大植被类型在地理空间上的分布规律与中国东部常绿阔叶林区植被的地带性分布基本一致。

[ Li J X, Da L J, Wang Y J, et al. Vegetation Classification of East China Using Multi—temporal NOAA—AVHRR Data[J]. Acta Phytoecologica Sinica, 2005(3):336-343. ]

[15]
李芝喜,李红旮.热带雨林保护的数字信息技术[M].昆明:云南大学出版社,2003.

[ Li Z X, Li H G.Digital Information Technology of Tropical Rain Forest Protection[M]. Kunming: Yunnan University Publishing, 2003. ]

[16]
郭航,张晓丽.基于遥感技术的植被分类研究现状与发展趋势[J].世界林业研究,2007,20(3):14-19.综述了国内外基于遥感技术进行 植被分类的研究现状,并提出植被分类的发展趋势:(1)从单时相、单源遥感分类向多时相、多源信息融合发展;(2)从单一分类方法向复合分类方法发展; (3)从“硬”分类向“软”分类方向发展;(4)从基于像元分类向混合像元分解分类和面向对象分类方向发展;(5)从传统分类向智能分类方向发展。

DOI

[ Guo H, Zhang X L.Current status and developing trend in vegetation Classification Based on RS Technology[J]. World Forestry Research, 2007,20(3):14-19. ]

[17]
付强,赵小勇.投影寻踪模型原理及其应用[M].北京:科学出版社,2006.

[ Fu Q, Zhao X Y.Principles and applications of projection pursuit model[M]. Beijing: Science Press, 2006. ]

[18]
付强,付红,王立坤.基于加速遗传算法的投影寻踪模型在水质评价中的应用研究[J].地理科学,2003,23(2):236-239.提出将改进的实码加速遗传算法(RAGA)与投影寻踪评价模型(PPE)相结合,同时优化多维参数(投影方向),建立了多元数据分类与评价模型.对长春南湖水的营养状态做出了评价,取得满意效果,为水质分析与评价提供一种新的方法与思路.

DOI

[ Fu Q, Fu H, Wang L K.Study on the PPE model based on RAGA to evaluating the water quality[J]. Scientia Geographica Sinica, 2003,23(2):236-239. ]

[19]
倪长健,王顺久,崔鹏.投影寻踪动态聚类模型及其在天然草地分类中的应用[J].安全与环境学报,2006(5):68-71.投影寻踪聚类模型在多因素聚类 分析中被广泛应用并取得了满意的效果,然而,该模型还存在如密度窗宽参数取值由经验确定等不足,有待改进提高。本文针对投影寻踪聚类模型的不足,首次把投 影寻踪的思想和动态聚类方法结合起来,构造投影指标,提出了投影寻踪动态聚类新模型。新模型在整个运算过程中不需人为给定参数,聚类结果客观、明确,而且 它还具有稳定性好、操作简便等特点。天然草地分类的实际应用表明,投影寻踪动态聚类模型切实可行,取得了很好的效果,在多因素聚类分析领域具有广阔的应用 前景。

DOI

[ Ni C J, Wang S J, Cui P. New model for projection pursuit dynamic cluster and its application to classifying natural grasslands[J]. Journal of Safety and Environment, 2006(5):68-71. ]

[20]
秦伟伟,王卓琳,任文隆.投影寻踪法在生态城市评价中的应用[J].安徽农业科学,2008,36(24):10317-10318.将一种在在水质评价中得到广泛 应用的评价方法——投影寻踪评价法引入生态城市评价领域中。采用基于实数遗传算法的投影寻踪评价法,以生态城市课题组建立的指标体系(指标涉及资源,经 济,社会,环境,体制等各方面因素)为基础,利用MATLAB软件对石家庄市2000~2007年的生态城市建设进行了评价。

DOI

[ Qin W W, Wang Z L, Ren W L.Application of the Projection Pursuit Method in the Evaluation of Ecological City[J]. Journal of Anhui Agricultural Science 2008,36(24):10317-10318. ]

[21]
梁煜峰,付建.投影寻踪法和遗传算法在洪水预报中的应用[J].东北水利水电,2010,28(4):37-40.文中将投影寻踪法和遗传算法两种方法有效的结合起来,利用投影寻踪建模的同时,利用遗传算法寻优,充分发挥两者优势,将这两种方法的结合运用于洪水预报,建立流域流量的多因子预报模型.

DOI

[ Liang Y F, Fu J.Application of Projection Pursuit and Genetic Algorithm in Flood Forecasting[J]. Water Resources & Hydropower of Northeast China, 2010,28(4):37-40. ]

[22]
刘海娟. 遗传投影寻踪模型在生态评价中的应用[D].兰州:兰州大学,2013.

[Liu H J.An application of genetic projection pursuit method on ecological evaluation[D]. Lanzhou: Lanzhou University, 2013.]

[23]
Jimenez, L O, Landgrebe D A. Hyperspectral data analysis and supervised feature reduction via projection pursuit[J]. IEEE Transactions on Geoscience and Remote Sensing, 1999,37(6):2653-2667.As the number of spectral bands of high-spectral resolution data increases, the ability to detect more detailed classes should also increase, and the classification accuracy should increase as well. Often the number of labelled samples used for supervised classification techniques is limited, thus limiting the precision with which class characteristics can be estimated. As the number of spectral bands becomes large, the limitation on performance imposed by the limited number of training samples can become severe. A number of techniques for case-specific feature extraction have been developed to reduce dimensionality without loss of class separability. Most of these techniques require the estimation of statistics at full dimensionality in order to extract relevant features for classification. If the number of training samples is not adequately large, the estimation of parameters in high-dimensional data will not be accurate enough. As a result, the estimated features may not be as effective as they could be. This suggests the need for reducing the dimensionality via a preprocessing method that takes into consideration high-dimensional feature-space properties. Such reduction should enable the estimation of feature-extraction parameters to be more accurate. Using a technique referred to as projection pursuit (PP), such an algorithm has been developed. This technique is able to bypass many of the problems of the limitation of small numbers of training samples by making the computations in a lower-dimensional space, and optimizing a function called the projection index. A current limitation of this method is that, as the number of dimensions increases, it is likely that a local maximum of the projection index will be found that does not enable one to fully exploit hyperspectral-data capabilities

DOI

[24]
田铮,林伟.投影寻踪方法与应用[M].西安:西北工业大学出版社,2007.

[ Tian Z, Lin W.Methods and Applications of Projection Pursuit[M]. Xi'an: Northwestern Polytechnical University Press, 2007. ]

[25]
严勇,李清泉,孙久运.投影寻踪学习网络的遥感影像分类[J].武汉大学学报(信息科学版),2007,32(10):876-879.采用投影寻踪(projection pursuit,PP)学习网络方法建立了一种新的遥感影像分类模型。该方法结合了统计学中投影寻踪算法节点函数灵活的非参数估计特点和人工神经网络的自学习功能,具有简捷的网络结构和良好的鲁棒性能。利用苏州市TM影像进行了分类实验,将分类结果与BP神经网络和最大似然法的分类结果相比较,投影寻踪学习网络的分类精度较高,具有一定的实用性。

[ Yan Y, Li Q Q, Sun J Y.Classification of RS image using projection pursuit learning network[J]. Geomatics and Information Science of Wuhan University, 2007,32(10):876-879. ]

[26]
Lin W, Tian Z, Wen X B, et al.Unsupervised segmentation of the POL-SAR image using similarity parameters in sequential projection pursuit model[C]. 2004 7th International Conference on Signal Processing Proceedings, Vols 1-3, 2004:769-772.

[27]
张连蓬,柳钦火,刘国林,等.多方向投影寻踪与高光谱遥感图像特征提取[J].煤炭学报,2007,32(2):155-158.<p>介绍了投影寻踪算法的基本原理,构造了面向易混分类别的高光谱遥感数据投影寻踪指标,在单方向投影寻踪算法的基础上,提出了序贯多方向投影寻踪算法.在该算法提取出的特征方向上,易混分地物类别的分类精度提高6%左右,但存在压制其他地物的矛盾.</p>

[ Zhang L P, Liu Q H, Liu G L, et al.The Multi—directional projection pursuit and the feature extraction of hyperspectral remote sensing image[J]. Journal of China Coal Society, 2007,32(2):155-158. ]

[28]
寻丽娜,方勇华.基于投影寻踪的高光谱图像目标检测算法[J].光子学报,2006,35(10):1584-1588.针对高光谱图像中小目标检测问题,提出了一种投影寻踪结合遗传算法的目标检测方法.该方法采用对异常分布敏感的偏度和峰度作为投影指标,实数编码的加速遗传算法搜索最佳投影方向.利用高光谱数据对所提出的方法进行了实验研究.结果表明,该方法能够快速、可靠的检测出小目标.

[ Xun L N, Fang Y H.Target Detection in Hyperspectral Images Using Projection Pursuit[J]. Acta Photonica Sinica,2006,35(10):1584-1588. ]

[29]
高杨,黄华梅,吴志峰.基于投影寻踪的珠江三角洲景观生态安全评价[J].生态学报,2010,30(21):5894-5903.区域景观生态安全是生态安全的重要组成部分,对于国家安全和社会可持续发展具有重要影响。以1990年和2005年珠江三角洲Landsat 5 TM和Landsat 7 ETM+遥感数据为基本数据源,选取聚集度、景观破碎度、景观形状指数、Shannon多样性指数,并构建了景观脆弱度指数和景观安全邻接指数,对研究区景观空间格局变化进行对比分析。在此基础上,利用基于遗传算法的投影寻踪方法,计算景观生态安全指数,评价研究区的景观生态安全状况。结果表明:(1)从1990年到2005年,珠江三角洲9市的聚集度、破碎度、景观形状指数和Shannon多样性指数变化不大,而景观脆弱度和景观安全邻接指数变化显著,9市的景观脆弱度都呈现减少趋势,而9市景观安全邻接指数都呈增加趋势。(2)从1990年到2005年,珠海和惠州两市景观生态安全状况一直保持良好,而东莞和中山两市的景观生态安全值一直较低;除佛山和广州两市景观生态安全状况略有提高外,其它7市景观生态安全值都有一定程度的减小,其中以肇庆市降低最多。珠江三角洲地区经济高速发展,人为活动剧烈,利用投影寻踪方法构建景观生态安全指数,评价高强度发展区域的景观生态安全状况是有效、可行的。

[ Gao Y, Huang H M, Wu Z F.Landscape Ecological Security Assessment Based on Projection Pursuit: A case study of nine cities in the Pearl River Delta[J]. Acta Ecologica Sinica, 2010,30(21):5894-5903. ]

[30]
Gao Y, Wu Z F, Lou Q S, et al.Landscape ecological security assessment based on projection pursuit in Pearl River Delta[J]. Environmental Monitoring and Assessment, 2012,184(4):2307-2319.Abstract<br/>Regional landscape ecological security is an important issue for ecological security, and has a great influence on national security and social sustainable development. The Pearl River Delta (PRD) in southern China has experienced rapid economic development and intensive human activities in recent years. This study, based on landscape analysis, provides a method to discover the alteration of character among different landscape types and to understand the landscape ecological security status. Based on remotely sensed products of the Landsat 5 TM images in 1990 and the Landsat 7 ETM+ images in 2005, landscape classification maps of nine cities in the PRD were compiled by implementing Remote Sensing and Geographic Information System technology. Several indices, including aggregation, crush index, landscape shape index, Shannon’s diversity index, landscape fragile index, and landscape security adjacent index, were applied to analyze spatial–temporal characteristics of landscape patterns in the PRD. A landscape ecological security index based on these outcomes was calculated by projection pursuit using genetic algorithm. The landscape ecological security of nine cities in the PRD was thus evaluated. The main results of this research are listed as follows: (1) from 1990 to 2005, the aggregation index, crush index, landscape shape index, and Shannon’s diversity index of nine cities changed little in the PRD, while the landscape fragile index and landscape security adjacent index changed obviously. The landscape fragile index of nine cities showed a decreasing trend; however, the landscape security adjacent index has been increasing; (2) from 1990 to 2005, landscape ecology of the cities of Zhuhai and Huizhou maintained a good security situation. However, there was a relatively low value of ecological security in the cities of Dongguan and Foshan. Except for Foshan and Guangzhou, whose landscape ecological security situation were slightly improved, the cities had reduced values in landscape ecological security, with the most decreased number 0.52 in Zhaoqing. Results of this study offer important information for regional eco-construction and natural resource exploitation.<br/>

DOI

[31]
Jones L K.A Simple lemma on greedy approximation in Hilbert space and convergence rates for projection pursuit regression and neural network training[J]. The Annals of Statistics, 1992,20(1):608-613.ABSTRACT A general convergence criterion for certain iterative sequences in Hilbert space is presented. For an important subclass of these sequences, estimates of the rate of convergence are given. Under very mild assumptions these results establish an $O(1/ \sqrt n)$ nonsampling convergence rate for projection pursuit regression and neural network training; where $n$ represents the number of ridge functions, neurons or coefficients in a greedy basis expansion.

DOI

[32]
Hwang J N, Lay S R, Maechler M, et al. Regression modeling in back-propagation and projection pursuit learning[J]. IEEE Transacrionr on Netiral Networh, 1994(5):342-353.We study and compare two types of connectionist learning methods for model-free regression problems: 1) the backpropagation learning (BPL); and 2) the projection pursuit learning (PPL) emerged in recent years in the statistical estimation literature. Both the BPL and the PPL are based on projections of the data in directions determined from interconnection weights. However, unlike the use of fixed nonlinear activations (usually sigmoidal) for the hidden neurons in BPL, the PPL systematically approximates the unknown nonlinear activations. Moreover, the BPL estimates all the weights simultaneously at each iteration, while the PPL estimates the weights cyclically (neuron-by-neuron and layer-by-layer) at each iteration. Although the BPL and the PPL have comparable training speed when based on a Gauss-Newton optimization algorithm, the PPL proves more parsimonious in that the PPL requires a fewer hidden neurons to approximate the true function. To further improve the statistical performance of the PPL, an orthogonal polynomial approximation is used in place of the supersmoother method originally proposed for nonlinear activation approximation in the PPL

DOI PMID

文章导航

/