
近32年来南京城市扩展与土地利用演变研究
作者简介:乔伟峰(1975-),男,江苏徐州人,博士后,副教授,主要从事土地资源管理和GIS应用研究。E-mail: qiaoweifeng@njnu.edu.cn
收稿日期: 2015-08-19
要求修回日期: 2015-09-16
网络出版日期: 2016-02-04
基金资助
基金项目:国家自然科学基金项目(41371172、41271135)
中国博士后科学基金面上项目与重点资助项目(2014M561040、2015T80127)
江苏高校优势学科建设工程资助项目(164320H101)
Research on Urban Expansion and Land Use Change in Nanjing over the Past 32 Years
Received date: 2015-08-19
Request revised date: 2015-09-16
Online published: 2016-02-04
Copyright
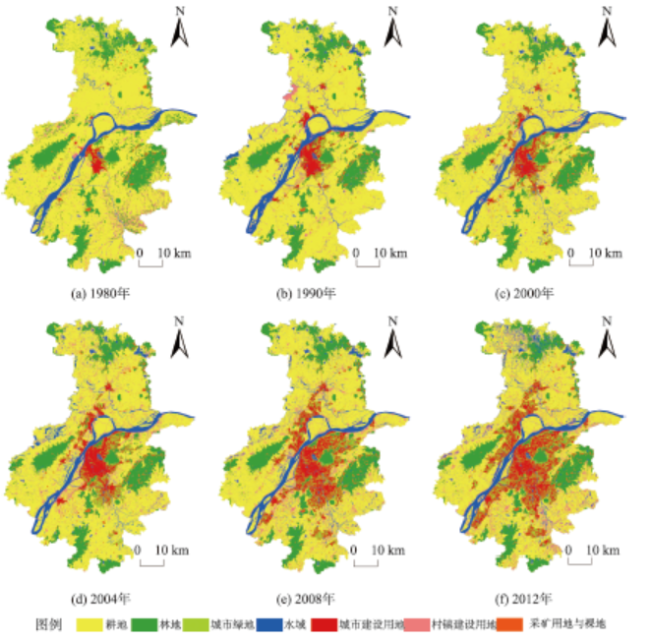
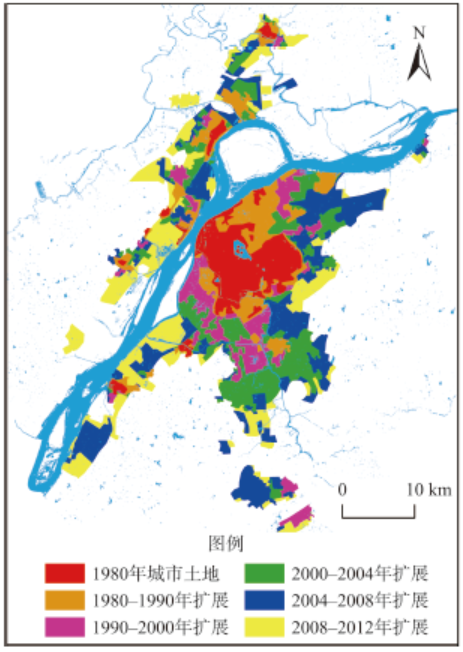
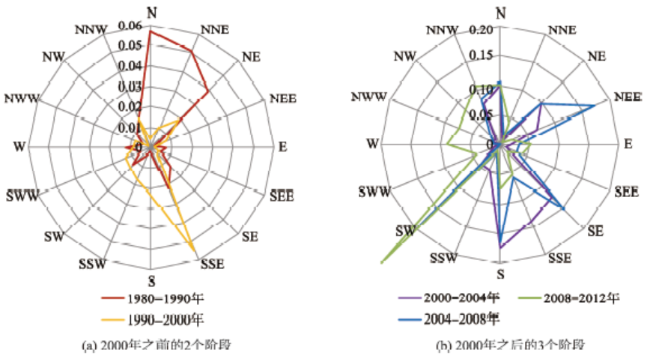
基于1980-2012年6个时相的遥感影像分类成果,运用扩展强度的等扇分析和土地利用转移矩阵对南京市城市扩展区由城市扩展引起的土地利用布局、结构演化进行了长周期、多时段的研究。结果表明:32年间5个阶段城市扩展的方向极不均匀,城市经历了东北-东南-西南的扩展演化过程,2000年之后的扩展强度显著扩大;在总变化量的构成中,耕地净变化量和交换变化量所占的比重较为接近,在面积净减少的同时,空间位置的转移也较为突出;城市建设用地、城市绿地、采矿用地与裸地以净变化为主,水面、村镇建设用地以交换变化为主;2000年后,各时段耕地和城市建设用地年均总变化量远高于2000年之前,以2004-2008年的值最高,2008-2012年有所回落;32年间各单项类型动态度均较高,城市绿地、村镇建设用地和城市建设用地均达90%以上;综合动态度的结果揭示32年来南京城市的扩展历经了加速演变-变化趋缓-剧烈演变-整合重构4个主要阶段。
乔伟峰 , 毛广雄 , 王亚华 , 陈月娇 . 近32年来南京城市扩展与土地利用演变研究[J]. 地球信息科学学报, 2016 , 18(2) : 200 -209 . DOI: 10.3724/SP.J.1047.2016.00200
Based on the highly accurate classification results of 6 years extracted from the remote sensing images from 1980-2012, a detailed research of the long cycled and multi-period of the land use layout and structure evolution caused by urban expansion in the expansion areas of Nanjing was implemented. The expansion intensity equal fan analysis method and transfer matrix data mining method were applied in this paper. During the application of the transfer matrix, the meaning of land use net change, swap change and total change was analyzed, the calculation method was summarized, and the calculation model of land use dynamic degree was improved to better depict the dynamic change of land use. The results show that the direction of the urban expansion was extremely uneven among the 5 periods in the 32 years. The main direction of expansion had shifted from northeast to southeast and then to southwest, and the expansion intensity had expanded considerably after the year of 2000. In the constitution of the total changes, the proportion of the net change in the arable land was close to the proportion of the swap change, and the arable land area was under a net reduction. In the meantime, the transfer of its spatial position was also significant. The net change played a main role in the urban construction land, urban green land, mining land and bare land, while the scope of water and rural construction land was mainly represented by the swap change. After the year of 2000, the average annual total change in the arable land and urban construction land of each period is significantly higher than before, and reached its highest value in 2004-2008 while dropped afterwards in 2008-2012. The land use dynamic degree in each kind of land use is relatively high over the past 32 years, and the dynamic degree values of the urban green land, rural construction land and urban construction land were higher than 90%. Studies of the total land use dynamic degree reflect that the urban expansion in Nanjing over the past 32 years has experienced four main stages: the accelerated evolution, the gradually slow in changing, the rapid evolution, and the integration and reconstruction.
Key words: transfer matrix; urban expansion area; land use change; Nanjing
Fig. 1 The scope of study图1 研究范围 |
Tab. 1 Instruction of the remote sensing data表1 遥感数据说明 |
| 数据采集时间 | 传感器 | 分辨率/m | |
|---|---|---|---|
| 多光谱 | 全色 | ||
| 1980-09-10 | MSS | 80 | |
| 1990-08-31 | TM | 30 | |
| 2000-09-16 | TM | 30 | |
| 2004-04-04 | ETM+ | 30 | 15 |
| 2008-08-19 | ETM+ | 30 | 15 |
| 2012-05-28 | ETM+ | 30 | 15 |
Fig. 2 Land use classification maps of Nanjing from 1980-2012图2 南京市土地利用分类图(1980-2012年) |
Tab. 2 The transfer matrix among the land use types表2 土地利用转移矩阵 |
| 期初类型 | 期末类型 | 期初 面积 | 期内 减少面积 | ||||
|---|---|---|---|---|---|---|---|
| 耕地 | 林地 | …… | 采矿用地与裸地 | ||||
| 耕地 | S11 | S12 | …… | S1n | |||
| 园地 | S21 | S22 | …… | S2n | |||
| …… | …… | …… | …… | …… | …… | …… | |
| 采矿用地与裸地 | Sn1 | Sn2 | …… | Snn | |||
| 期末面积 | …… | - | |||||
| 期内增加 | …… | - | - | ||||
Fig. 3 Map of built-up area expansion in Nanjing图3 1980-2012年南京建成区扩展变化图 |
Fig. 4 Rose diagram of the urban expansion intensity in different periods in Nanjing图4 南京市不同时段城市空间扩展强度玫瑰图 |
Tab. 3 The transfer matrix of land use in 1980-2012 /hm2表3 1980-2012年土地利用转移矩阵/hm2 |
| 耕地 | 林地 | 城市绿地 | 水面 | 城市建设用地 | 村镇建设用地 | 采矿用地与裸地 | 合计 | |
|---|---|---|---|---|---|---|---|---|
| 耕地 | 187 139 | 3474 | 24 214 | 25 820 | 40 144 | 34 381 | 1118 | 316 290 |
| 林地 | 14 519 | 65 890 | 2045 | 3785 | 4645 | 2735 | 1175 | 94 793 |
| 城市绿地 | 72 | 133 | 874 | 145 | 2817 | 28 | 2 | 4071 |
| 水面 | 10 508 | 501 | 1414 | 8464 | 2751 | 2901 | 75 | 26 614 |
| 城市建设用地 | 133 | 256 | 1163 | 242 | 4058 | 51 | 3 | 5906 |
| 村镇建设用地 | 12 784 | 266 | 1736 | 2203 | 3079 | 2415 | 61 | 22 544 |
| 采矿用地与裸地 | 71 | 54 | 18 | 70 | 23 | 21 | 2864 | 3120 |
| 合计 | 225 225 | 70 573 | 31 465 | 40 729 | 57 517 | 42 531 | 5298 | 473 338 |
Tab. 4 Amount of change for each land type in 1980-2012 /hm2表4 1980-2012年各类的变化量/hm2 |
| 期内减少量 | 期内新增量 | 净增量 | N | S | T | N/T | |
|---|---|---|---|---|---|---|---|
| 耕地 | 129 151 | 38 086 | -91 065 | 91 065 | 76 172 | 167 237 | 54.45 |
| 林地 | 28 903 | 4683 | -24 220 | 24 220 | 9365 | 33 585 | 72.12 |
| 城市绿地 | 3197 | 30 591 | 27 394 | 27 394 | 6393 | 33 787 | 81.08 |
| 水面 | 18 150 | 32 265 | 14 115 | 14 115 | 36 299 | 50 414 | 28.00 |
| 城市建设用地 | 1848 | 53 459 | 51 611 | 51 611 | 3695 | 55 306 | 93.32 |
| 村镇建设用地 | 20 129 | 40 116 | 19 987 | 19 987 | 40 259 | 60 246 | 33.18 |
| 采矿用地与裸地 | 256 | 2434 | 2178 | 2178 | 512 | 2690 | 80.98 |
Tab. 5 Amount of change for the arable land in Nanjing in 1980-2012 /hm2表5 1980-2012年南京市耕地历年变化量/hm2 |
| 时段 | 年均减少量 | 年均新增量 | 年均净增量 | 年均N | 年均S | 年均T |
|---|---|---|---|---|---|---|
| 1980-1990 | 4248.40 | 4047.20 | –201.20 | 201.20 | 8094.40 | 8295.60 |
| 1990-2000 | 2858.00 | 1660.10 | –1197.90 | 1197.90 | 3320.20 | 4518.10 |
| 2000-2004 | 10 718.00 | 4405.25 | –6312.75 | 6312.75 | 8810.50 | 15 123.25 |
| 2004-2008 | 11 672.75 | 5354.50 | –6318.25 | 6318.25 | 10 709.00 | 17 027.25 |
| 2008-2012 | 9826.75 | 3189.25 | –6637.50 | 6637.50 | 6378.50 | 13 016.00 |
Tab. 6 Amount of change for the urban construction land in Nanjing in 1980-2012 /hm2表6 1980-2012年南京市城市建设用地历年变化量/hm2 |
| 时段 | 年均减少量 | 年均新增量 | 年均净增量 | 年均N | 年均S | 年均T |
|---|---|---|---|---|---|---|
| 1980-1990 | 42.00 | 1006.30 | 964.30 | 964.30 | 84.00 | 1048.30 |
| 1990-2000 | 265.10 | 688.20 | 423.10 | 423.10 | 530.20 | 953.30 |
| 2000-2004 | 416.00 | 3224.25 | 2808.25 | 2808.25 | 832.00 | 3640.25 |
| 2004-2008 | 1246.50 | 5102.25 | 3855.75 | 3855.75 | 2493.00 | 6348.75 |
| 2008-2012 | 900.25 | 3670.50 | 2770.25 | 2770.25 | 1800.50 | 4570.75 |
Tab. 7 The land use dynamic degree in 1980-2012 /(%)表7 1980-2012年单项类型动态度/(%) |
| 类型 | 耕地 | 林地 | 城市绿地 | 水面 | 城市建设用地 | 村镇建设用地 | 采矿用地与裸地 |
|---|---|---|---|---|---|---|---|
| D | 47.19 | 33.76 | 97.48 | 85.62 | 93.16 | 96.15 | 48.43 |
Tab. 8 Changes of the total land use dynamic degree in different periods over the past 32 years /(%)表8 32年来各时段南京综合土地利用动态度变化/(%) |
| 时段 | 1980-1990 | 1990-2000 | 2000-2004 | 2004-2008 | 2008-2012 |
|---|---|---|---|---|---|
| 年均DZ | 2.03 | 1.32 | 4.15 | 4.85 | 3.90 |
The authors have declared that no competing interests exist.
| [1] |
|
| [2] |
|
| [3] |
|
| [4] |
|
| [5] |
[
|
| [6] |
[
|
| [7] |
[
|
| [8] |
[
|
| [9] |
[
|
| [10] |
[
|
| [11] |
[
|
| [12] |
[
|
| [13] |
[
|
| [14] |
[
|
| [15] |
[
|
| [16] |
[
|
| [17] |
[
|
| [18] |
[
|
| [19] |
[
|
| [20] |
[
|
| [21] |
[
|
| [22] |
[
|
| [23] |
[
|
| [24] |
[
|
| [25] |
[
|
| [26] |
[
|
| [27] |
[
|
| [28] |
[
|
/
| 〈 |
|
〉 |
