
内蒙古贫困地区生态安全评价及空间格局分析
作者简介:张永利(1989-),男,河南周口人,硕士生,主要从事区域资源开发与利用方面研究.E-mail:1064349622@qq.com
收稿日期: 2015-07-15
要求修回日期: 2015-12-11
网络出版日期: 2016-03-10
基金资助
国家科技支撑计划项目课题"贫困地区资源环境监测评估与生态价值评价技术"(2012BAH33B01)
The Evaluation and Spatial Pattern Characteristics of Ecological Safety in the Poor Areas of Inner Mongolia
Received date: 2015-07-15
Request revised date: 2015-12-11
Online published: 2016-03-10
Copyright
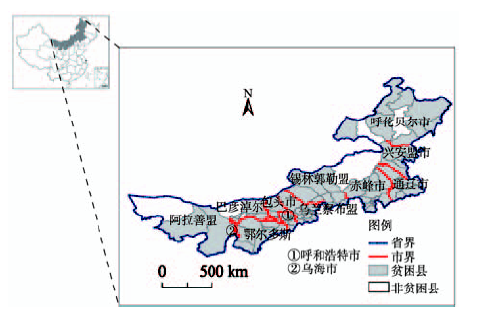
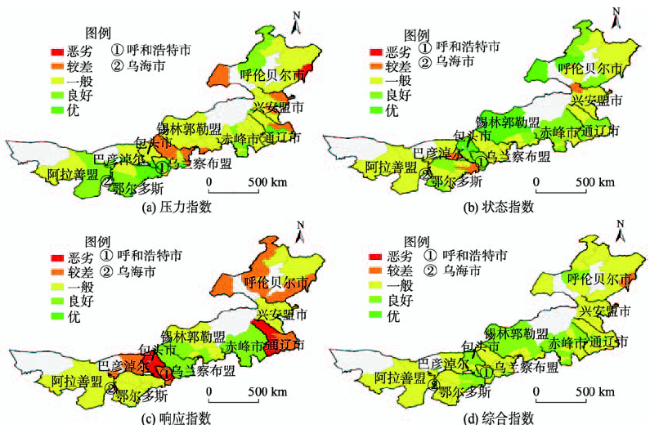
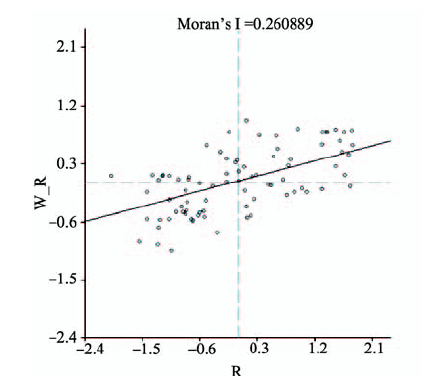
在压力-状态-响应(Pressure-State-Response, PSR)模型确立指标体系的基础上,采用灰色关联度分析和熵值赋权相结合的方法,测算出2012年内蒙古贫困地区生态安全综合,压力,状态和响应指数,对研究区生态安全状况进行综合评价;并利用地理空间分析方法和空间分析软件GeoDA对生态安全综合状况进行空间相关性分析,同时结合研究区自然地理特征和社会经济状况,对其生态安全空间格局特征及成因进行诊断性分析.研究发现:(1) 内蒙古贫困地区生态安全水平整体处于一般状态,等级布局具有大聚集,小分散的特点;(2) 生态安全状况分布并非完全随机性,而是表现出空间相似值之间的空间聚集,具有正相关性;(3) 生态安全等级分布状况呈现出区域分异的特点,总体表现为内蒙古西部和东部贫困地区处于一般状态,而中部贫困地区生态安全水平整体处于良好状态,区域内部生态安全水平具有明显的县域差异;(4) 生态安全水平较好的县域和生态安全处于一般水平的县域,压力,状态,响应指标方面差距明显,且影响因素各异.
张永利 , 吴宜进 , 王小林 , 毛婧瑶 , 张家其 , 陈跃红 . 内蒙古贫困地区生态安全评价及空间格局分析[J]. 地球信息科学学报, 2016 , 18(3) : 325 -333 . DOI: 10.3724/SP.J.1047.2016.00325
On the basis of establishing the index-system using the pressure-state-response model, we combined the gray correlation degree analysis with the entropy weighting method to calculate the ecological safety indices of the comprehensive, pressure, state, and response factors, and made a comprehensive evaluation for the poor areas of Inner Mongolia in 2012. And we used the geographical spatial analysis method and spatial analysis software of GeoDA to analyze the spatial correlation of index on the comprehensive safety for the research area. Meanwhile, by combining the physical geographical characteristics and the socioeconomic status of the research area, we diagnostically analyzed the ecological safety status of the research area. In this research, we made the following conclusions: comprehensively, the ecological safety in the poor areas of Inner Mongolia is in the general state condition, and the ecological safety level distribution has presented characteristics of majorly concentrated, and a few scattered. The distribution of ecological safety status was not completely random, it shows a spatial aggregation pattern within values that have similarity, and indicate a positive correlation. The ecological safety level distribution presents the regional difference, that the west and east poor areas were in the general state condition, and the poor areas of the central Inner Mongolia is in the good state condition overall. The ecological safety level has revealed obvious internal differences among counties. There are obvious contrasts on the ecological safety level between cities in the better state and the general state, which is reflected in the indicators of pressure, state, and response, and the effects are different regarding to different factors.
Fig. 1 The study area图1 研究区 |
Tab. 1 Main data types and sources表1 研究区主要数据类型及来源 |
| 数据类型 | 来源 |
|---|---|
| 社会经济数据 | 2012年《内蒙古自治区国民经济和社会发展统计公报》,2013年各县市《统计年鉴》 |
| 环境状况数据 | 各县市2012年《环境质量状况公报》,《内蒙古自治区水资源公报》,水土保持监测站《遥感调查数据》,《水土保持公报》 |
| 土地类型数据 | 研究区国土局提供的土地利用类型数据 |
| 贫困数据 | 国务院扶贫办提供的贫困指标等数据资料 |
| 类比标准参考数据 | 《国家级生态县,生态市,生态省建设指标》,国家,行业和地方通用分类标准参考值,研究区环境背景值 |
Tab. 2 Ecological safety evaluation index system in the poor areas of Inner Mongolia表2 内蒙古贫困区生态安全评价指标体系 |
| 层次 | 指标代码 | 指标含义 | 类比标准 | 类比标准值 |
|---|---|---|---|---|
| 压力指标 | X1 | 人口密度/(人/km2) | 地方标准① | 200 |
| X2 | 人口自然增长率/(‰) | 国家标准② | 8 | |
| X3 | 人均耕地面积/(hm2/人) | 国际标准③ | 0.08 | |
| X4 | 人均GDP/(万元/人) | 国家标准 | 2.5 | |
| X5 | 经济密度/(万元/km2) | 地方标准 | 430 | |
| X6 | 路网密度/(km/km2) | 地方标准 | 1.41 | |
| X7 | 城市化水平/(%) | 国家标准 | 50 | |
| X8 | 单位面积化肥使用量/(kg/hm2) | 国家标准 | 250 | |
| X9 | 单位面积农药使用量/(kg/hm2) | 国家标准 | 10 | |
| 状态指标 | X10 | 人均粮食产量/(kg/人) | 国家标准 | 400 |
| X11 | 有效灌溉面积占耕地比重/(%) | 国家标准 | 50 | |
| X12 | 空气优良率/(%) | 国家标准 | 90 | |
| X13 | 水质达标率/(%) | 国家标准 | 100 | |
| X14 | 森林覆盖率/(%) | 环境背景值④ | 40 | |
| X15 | 水土流失比重/(%) | 环境背景值 | 30 | |
| X16 | 人均牧草面积/(hm2/人) | 环境背景值 | 27.5 | |
| X17 | 人均居住面积/(m2/人) | 国家标准 | 30 | |
| X18 | 卫生技术人员/(人/万人) | 地方标准 | 43.7 | |
| X19 | 教师数/(人/万人) | 地方标准 | 93 | |
| X20 | 床位数/(张/万人) | 地方标准 | 35.6 | |
| X21 | 荒漠化面积占国土比重/(%) | 环境背景值 | 5.73 | |
| X22 | 恩格尔系数/(%) | 国家标准 | 45 | |
| X23 | 贫困人口比例/(%) | 环境背景值 | 7.6 | |
| 响应指标 | X24 | 固废无害化处理率/(%) | 国际标准 | 100 |
| X25 | 废水处理率/(%) | 国际标准 | 100 | |
| X26 | 工业烟尘排放达标率/(%) | 国际标准 | 100 | |
| X27 | 科教支出占GDP比/(%) | 国家标准 | 6 | |
| X28 | 第三产业比重/(%) | 国家标准 | 45 | |
| X29 | 环保投入占GDP比重/(%) | 国家标准 | 3.5 | |
| X30 | 退耕还林完成率/(%) | 国家标准 | 30 | |
| X31 | 人均造林面积/(hm2/人) | 环境背景值 | 0.045 | |
| X32 | 生活垃圾处理率/(%) | 国家标准 | 100 | |
| X33 | 生活污水处理率/(%) | 国家标准 | 60 |
注:① 地方标准指区域生态文明建设要求及"十二五"规划,国家,区域均值标准等;② 国家标准指国家已发布的环境质量标准,如国家级生态县,生态市,生态省建设指标,水污染,土地污染分类标准等;③ 国际标准指国际上通用的标准值;④ 环境背景基准是以区域生态环境背景值或本底值作为评价基准,如森林覆盖率,水土流失本底值等 |
Tab. 3 Classification standard of ecological safety表3 生态安全分级标准 |
| 分值 | 等级 | 评价 | 特征 |
|---|---|---|---|
| <0.45 | Ⅰ | 恶劣 | 生态环境恶劣,不能满足生存发展需求 |
| 0.45-0.55 | Ⅱ | 较差 | 生态环境较差,勉强满足生存发展需求 |
| 0.55-0.65 | Ⅲ | 一般 | 生态环境一般,能够满足生存发展需要 |
| 0.65-0.75 | Ⅳ | 良好 | 生态环境良好,适合人类生存发展 |
| >0.75 | Ⅴ | 优 | 生态环境较好,适宜人类生存发展 |
Fig. 2 The ecological safety status in the study area图2 研究区生态安全状况 |
Tab. 4 Distribution of the ecological safety level表4 生态安全等级分布 |
| Ⅴ级(优) | Ⅳ级(良好) | Ⅲ级(一般) | Ⅱ级(较差) | Ⅰ级(恶劣) | 总和 | |
|---|---|---|---|---|---|---|
| 县域数/个 | 0 | 34 | 50 | 1 | 0 | 85 |
| 比例/(%) | 0 | 40.00 | 58.82 | 1.18 | 0 | |
| 面积/万km2 | 0 | 24.23 | 68.60 | 1.04 | 0 | 93.87 |
| 比例/(%) | 0 | 25.81 | 73.08 | 1.11 | 0 |
Fig. 3 Scatter diagram of Moran s I图3 Moran s I散点图 |
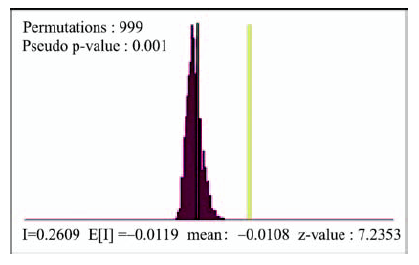
Fig. 4 Significance test of Moran s I图4 Moran s I指数显著性检验 |
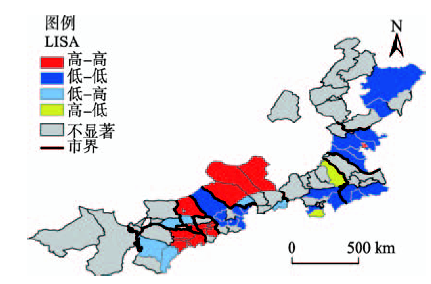
Fig. 5 LISA aggregation map图5 LISA空间集聚图 |
The authors have declared that no competing interests exist.
| [1] |
[
|
| [2] |
[
|
| [3] |
[
|
| [4] |
[
|
| [5] |
[
|
| [6] |
[
|
| [7] |
[
|
| [8] |
[
|
| [9] |
[
|
| [10] |
[
|
| [11] |
[
|
| [12] |
[
|
| [13] |
[
|
| [14] |
|
| [15] |
[
|
| [16] |
[
|
| [17] |
[
|
| [18] |
[
|
| [19] |
[
|
| [20] |
[
|
| [21] |
[
|
| [22] |
[
|
| [23] |
[
|
| [24] |
[
|
| [25] |
[
|
| [26] |
[
|
| [27] |
[
|
| [28] |
[
|
| [29] |
[
|
| [30] |
[
|
| [31] |
|
/
| 〈 |
|
〉 |