地球信息科学理论与方法

面向地形特征的DEM与影像纹理差异分析

  • 刘凯 ,
  • 汤国安 , * ,
  • 黄骁力 ,
  • 蒋圣
展开
  • 1. 南京师范大学 虚拟地理环境教育部重点实验室,南京 210023;2. 江苏省地理信息资源开发与利用协同创新中心,南京 210023
*通讯作者:汤国安(1961-),男,浙江宁波人,博士生导师,教授,研究方向为地理信息系统,DEM与数字地形分析及GIS空间分析.E-mail:

作者简介:刘 凯(1989-),江苏镇江人,博士生,主要从事DEM与数字地形分析研究.E-mail:

收稿日期: 2015-05-25

  要求修回日期: 2015-07-16

  网络出版日期: 2016-03-10

基金资助

江苏高校优势学科建设工程资助项目

国家自然科学基金项目(41171320,41271438,41401440)

Research on the Difference between Textures Derived from DEM and Remote-sensing Image for Topographic Analysis

  • LIU Kai ,
  • TANG Guo'an , * ,
  • HUANG Xiaoli ,
  • JIANG Sheng
Expand
  • 1. Key Laboratory of Virtual Geographic Environment (Nanjing Normal University), Ministry of Education, Nanjing 210023, China;2. Jiangsu Center for Collaborative Innovation in Geographical Information Resource Development and Application, Nanjing, 210023, China;
*Corresponding author: TANG Guo'an, E-mail:

Received date: 2015-05-25

  Request revised date: 2015-07-16

  Online published: 2016-03-10

Copyright

《地球信息科学学报》编辑部 所有

摘要

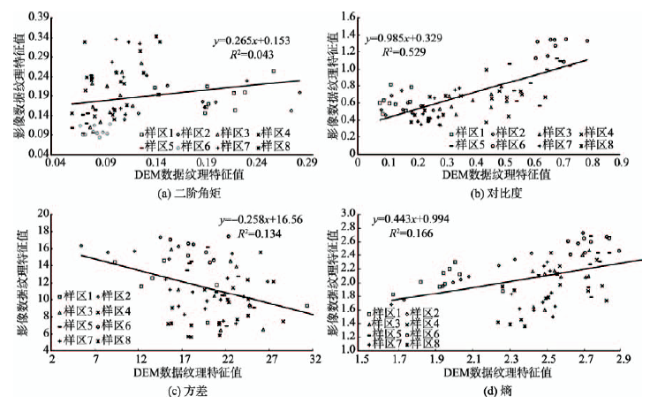
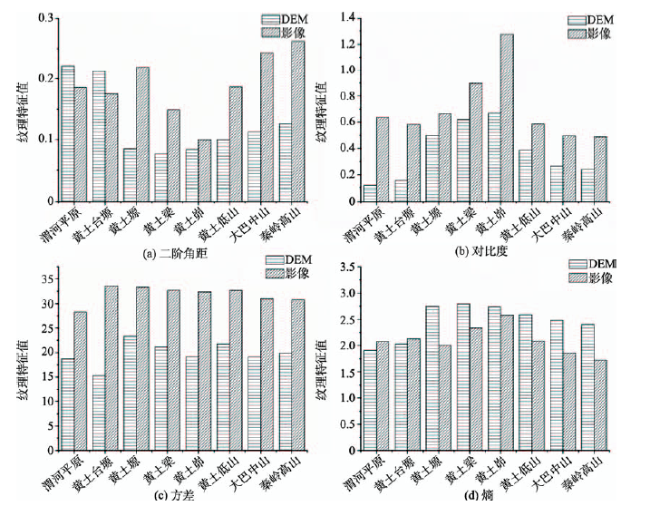
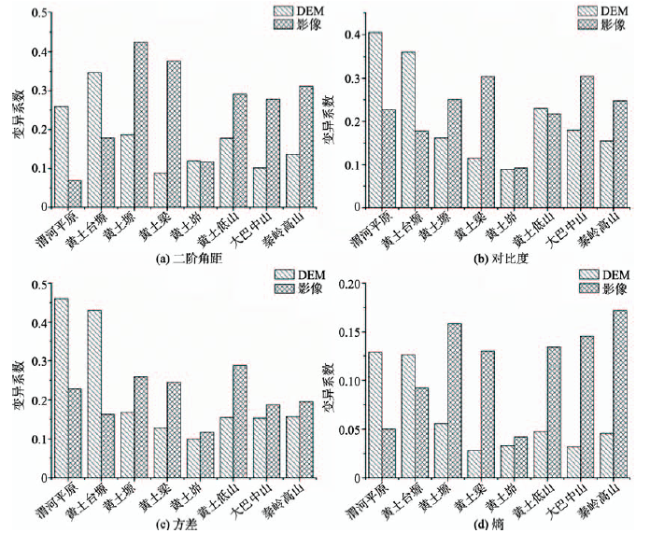
纹理分析方法在宏观地形特征分析方面具有较大的优势与潜力,但当前缺少对DEM与影像数据纹理特征差异的系统分析研究.本文采用灰度共生矩阵为纹理量化模型,选取了8个不同地貌单元的样本数据,对DEM和遥感影像2类数据的纹理进行了特征值对比分析,纹理特征稳定性分析,纹理特征组间差异性分析.实验结果表明,在所测试的二阶角矩,对比度,方差,熵4个纹理指标中,DEM和影像的对比度特征值间具有显著的相关性;通过不同地貌样区纹理特征值对比分析发现,DEM数据在地形起伏较大区域纹理特征更为明显,遥感影像数据则受地表覆盖物影响较大;从地形特征的稳定性角度分析,DEM数据在丘陵和山地分析有优势,影像数据则在平原和台地分析表现更好;从地形特征差异性角度分析,DEM数据要优于影像数据.进一步采用光照模拟和坡度数据以增加DEM纹理信息,研究结果表明,DEM派生的2类数据在地形量化差异性方面改进明显,并大大优于影像数据.

本文引用格式

刘凯 , 汤国安 , 黄骁力 , 蒋圣 . 面向地形特征的DEM与影像纹理差异分析[J]. 地球信息科学学报, 2016 , 18(3) : 386 -395 . DOI: 10.3724/SP.J.1047.2016.00386

Abstract

The textural analysis methods have advantage and potential in macro topographic analysis. Currently, based on the texture features of DEM and remote sensing image, some researches are conducted, including quantitative analysis of terrain features, landform classification and the pattern recognition of physiographic units. However, little literatures focus on the difference evaluation of texture features between DEM and image data, which making the theory and methodology scarce for data selection, data fusion and results evolution. In this paper, Gray Level Co-occurrence Matrix (GLCM) model is used for texture analysis in eight sample areas representing different landform types. Second angular moment, contrast, variance and entropy are selected as the quantitative indices. Based on the texture features derived from two different data types, a series of experiments are conducted, including the contrastive analysis of texture features, the stability analysis within same sample area and the divergence analysis among different sample areas. Coefficient of variation is used to evaluate the discrete degree. The results suggest a strong correlation between DEM based contrast and image based contrast. It also proves that the texture features derived from DEM are more evident in high-relief landform, while the image data takes advantage in small-relief area, however, could be affected by the land surface. Considering the stability of topographic analysis, DEM data are more suitable for hill and mountain areas, while the image data achieves better results in the plain area and tableland area. Considering the divergence of topographic analysis, the texture features derived from DEM data vary more obvious among different test areas, with the second angular moment, contrast and entropy getting higher values. These phenomena indicate that the texture features derived from DEM data have stronger discrimination ability. Hillshade data and slope data are employed to enhance the texture information in further analysis, which proves that such two land surface parameters can improve the discrimination ability among different landforms, giving a greater superiority compared with image data.

1 引言

地形特征反映了地球表面某一区域内地势的高低起伏及地形要素的组合关系,从本质上说,地形特征来源于地球内外力对地壳的综合作用[1-2].作为地表过程的重要下垫面因素,地形特征对水分,热量,土壤,植被等地理要素的宏观地域分异具有重要影响[3].当前,数字高程模型(Digital Elevation Model,DEM)数据是地形分析的主要数据源,而影像数据则起到了一定的辅助作用.
DEM数据通过二维矩阵记录高程信息实现对地形起伏的模拟表达[4],相比于影像数据对地表的直接表达,DEM数据的优势在于可"过滤"地表的覆盖物信息而只表达地形自身信息;同时,DEM数据便于派生出一系列的地形因子,这些地形因子丰富了对地形特征的表达能力.然而,基于DEM数据的数字地形分析方法局限于窗口分析的思路[5-6],在宏观尺度上的量化能力较为薄弱[7-8],而遥感影像数据的优势在于数据源丰富,可快速获取大区域 多尺度的影像数据.目前,学者们主要实现了地形特征判别,地貌单元划分,灾害后地形变化检测 等[9-11],影像数据已成为地形分析的重要辅助数据.然而,影像数据表达的是实际地表的光谱信息,导致光谱差异的不仅是地形变化,还包含了地表覆盖物的信息.特别在城市,森林,农田等人工痕迹较为明显区域,基于影像数据的地形特征分析受到较大的干扰[12].针对遥感影像数据和DEM数据的各自特点,有学者探讨了影像数据和DEM数据融合的地形特征分析方法,并在滑坡对象提取分析[13],沟壑信息建模[14-15]等方面取得了重要进展.虽然从数据采集方式和表达内容角度分析,DEM数据被视为地形分析的主要数据源,影像数据则起到一定的辅助作用,但该论述仅限于理论层面,相关定量研究较为缺乏,DEM数据的优势具体体现及影像数据在哪些方面可起到辅助作用等问题需进一步理清.
纹理是图像的重要属性特征,也是对图像图形要素进行解译的重要基础[16].DEM数据本身没有纹理特征,然而当采用一定的可视化方法后,DEM数据即可转换为一幅纹理特征显著的灰度图像.学者对DEM纹理特征的概念模型,量化方法以及应用等做了初步研究[17-20],表明DEM纹理特征可用于宏观尺度的地形特征分析与判别,是现有数字地形分析方法的重要补充.相比之下,现有遥感影像纹理特征的应用主要提高了影像的分类精度[21-22].
本文采用DEM数据和遥感影像数据,以纹理特征分析方法论证了DEM数据在地形分析的优势,揭示了DEM和影像数据的纹理特征的差异性,进而为以地形特征分析为基础的数字地貌,土壤侵蚀,水文建模等研究提供理论支撑.

2 研究区与实验数据

本文考虑多种地形单元及其典型性,选择陕西省为研究样区.根据周成虎等制定的中国陆地数字地貌分类体系[23],从高程和起伏度考虑,地貌形态可分为平原,台地,丘陵,山地4类,陕西省包含了上述4种地形单元.本文共选取8个研究样区.其中,样区1渭河平原隶属于平原,样区2黄土台塬隶属于台地,样区3黄土塬,样区4黄土梁,样区5黄土峁隶属于丘陵;样区6黄土低山,样区7大巴中山,样区8秦岭高山隶属于山地.
实验数据包含2类:DEM数据采用国家基础地理信息中心生产的1:5万高程数据,水平分辨率25 m;影像数据采用Google Earth的公开数据,包含了3个波段.为便于DEM数据对比分析,实验的影像数据分辨率重采样为25 m.样区的选取参考了陕西省地貌分区图,以确保样区内的地貌类型符合实验要求.在确定样区的基础上,每个样区裁切并挑选出10个样本数据,每个样本大小为512像元×512像元,筛选时主要考虑:(1)地貌特征典型性;(2)避开城市等人为影响较大区域(图1).
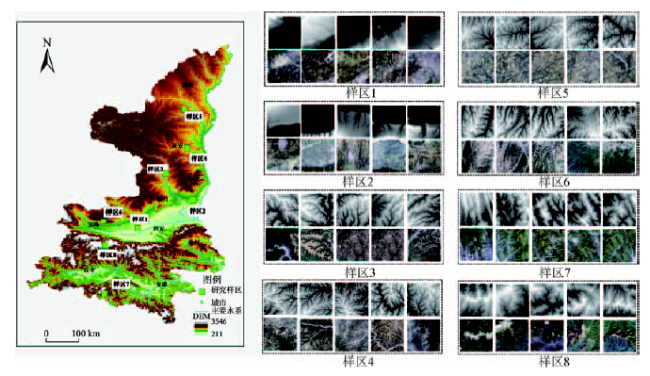
Fig. 1 The distribution map of test areas and some parts of the sample data

图1 实验样区及部分实验样本图

3 实验方法

3.1 纹理特征量化思路

DEM数据和影像数据均有不同于一般图像的特征,因此在量化时要考虑到数据自身的特点.DEM数据本质是由高程信息构建的二维矩阵,故纹理分析的前提是需将高程信息在一定的灰度域映射,这样形成的高程信息的灰度图像是其纹理分析的基础.遥感影像数据中的3波段可合成彩色影像,当前对于彩色图像的纹理信息分析通常有2种思路:(1)纹理信息和色彩信息分别处理[24];(2)在纹理分析时融合色彩信息[25].考虑到本研究主要是DEM和影像纹理量化结果的对比分析,故本文在对影像数据纹理分析时并未加入色彩信息.具体计算时,对每一个波段形成的灰度图像分别计算纹理特征值,并以各波段纹理特征的平均值作为图像整体的特征值.

3.2 纹理分析方法

本文的纹理分析方法采用了灰度共生矩阵模型(Gray level co-occurrence matrix,GLCM)[26],其主要原因有以下2点:(1)DEM数据反映的地形纹理和影像数据反映的地表纹理均属于自然纹理,以灰度共生矩阵为代表的统计型纹理分析方法更适合于自然纹理分析;(2)共生矩阵是一种重要的基础纹理分析方法,以此为基础派生出了一系列的改进方法,因此选择该方法具有更强的代表性.灰度共生矩阵的核心思想在于,通过一定间隔及一定方向的不同组合的栅格点对出现的频率构建共生矩阵,并以此矩阵为基础提取不同的纹理特征.点对组合时共有8个可能方向,考虑到相隔180°点对的共生矩阵具有对称性,因此,通常只计算点对角度为0°,45°,90°,135°的共生矩阵,其具体计算公式如下:
P ( i , j , d , 0 o ) = # k , l , m , n L X × L y | k - m = 0 , l - n = d , G k , l = i , G m , n = j (1)
P ( i , j , d , 45 o ) = # k , l , m , n L X × L y ( k - m = d , l - n = - d ) or ( k - m = - d , l - n = d ) , G k , l = i , G m , n = j (2)
P ( i , j , d , 90 o ) = # k , l , m , n L X × L y | k - m = d , l - n = 0 , G k , l = i , G m , n = j (3)
P ( i , j , d , 135 o ) = # k , l , m , n L X × L y ( k - m = d , l - n = d ) or ( k - m = - d , l - n = - d ) , G k , l = i , G m , n = j (4)
式中:Lx为图像在X轴方向上的空间域;Ly表示图像在Y轴方向上的空间域;G为图像取值函数;(k,l)和(m,n)分别表示符合点对要求的栅格.

3.3 纹理模型参数确定

采用GLCM进行纹理分析时,需根据实验对象及实验要求确定模型的参数,包括量化级数,点对方向和点对步长.图像的量化级数影响灰度共生矩阵的计算效率,本研究全部实验数据的量化级数均设置为8,以提高计算效率.点对距离是灰度共生矩阵的分析尺度,对纹理模型量化结果的适宜性和稳定性有重要影响.研究中采用5个栅格步长,现有研究证明,对于25 m分辨率地形数据,采用5个栅格步长计算时,结果较为稳定[20].点对方向是GLCM的另一个重要参数,然而点对方向的重要作用在于对纹理方向性特征的量化与判读,对其他纹理指标影响不大.考虑本研究不涉及方向性地形特征的提取,因此在量化时采用4个方向的纹理指标求取均值作为最终计算结果.

3.4 差异性评价方法

GLCM共有14个纹理参数,研究中选取了其中最为重要的4个参数,具体纹理指标及其物理意义如表1所示,具体计算公式可参考文献[26].
Tab. 1 Texture features and their physical significances

表1 纹理指标其物理意义

参数名称 物理意义
二阶角矩 反映纹理特征分布的均匀和粗细程度.二阶角矩的值越高,则纹理特征越呈现均匀分布
对比度 反映邻近栅格间的反差,可理解为纹理的明显度或强度
方差 反映纹理变化快慢,周期性大小的物理量.方差值越大,表明纹理周期越强
反映图像信息量,用于度量纹理的随机性特征,表征纹理的复杂程度
本文从3个方面对DEM和影像数据纹理特征进行对比分析.(1) 特征值分析,即对不同地貌样区的2类样本的纹理特征量化结果进行相关性及对比分析,结合其数据特点,量化结果,以及纹理指标的物理意义揭示规律性特征;(2) 组内稳定性分析,即分析采用2类数据时,相同的地貌单元内部不同样本间量化结果的差异性.对于同一个地貌样区而言,其不同样本纹理指标之间的离散程度越小,则表明该纹理指标的稳定性越高.(3) 组间差异性分析,即分析采用2类不同数据时,纹理指标在不同地貌样区间的差异情况.当不同地貌样区纹理指标之间的量化结果差异较大,即可认为该纹理指标区分度较高.本研究引入变异系数CV作为数据离散程度的评价指标,具体公式如下:
CV = σ μ (5)
式中: σ 表示样本数据的标准差; μ 为样本数据的平均数.
根据同一个样区不同样本数据的纹理特征值求取变异系数,可用于纹理特征稳定性评价.当变异系数越小时,表明采用纹理分析方法的稳定性越高.根据同一个纹理指标在不同样区间的变异系数,可用于纹理指标的区分能力的评价.当变异系数越大则表明该纹理指标对不同地貌形态具有较高的区分能力.

4 实验结果

4.1 纹理特征值分析

纹理特征值分析包含2部分:(1)DEM数据和影像数据纹理特征值的相关性;(2)分析2类数据纹理特征值在不同地貌样区量化结果的差异性,并结合纹理特征的物理含义予以解释.首先基于8个不同地貌样区80个样本数据纹理特征值量化结果绘制散点图,对DEM数据和影像数据的纹理特征值的分布规律及相关性分析.图2(a)所示,2类数据二阶角矩量化结果的分布较为杂乱,特征值之间没有显著的相关性(R2=0.0437),表明DEM数据和影像数据的二阶角矩特征值在不同地貌单元的变化规律并不一致.而2类数据的对比度特征值分布较为规则(图2(b)),具有显著的相关性(R2=0.5292),表明DEM数据和影像数据在不同地貌样区的对比度特征值变化规律较为一致.而方差和熵的量化结果表明2类数据间的相关性较低,在这2个纹理指标上的量化结果规律性不明显.
Fig. 2 Scatter diagram of texture features derived from DEM and image

图2 基于 DEM和影像数据纹理特征值散点图

为对比分析2类数据在不同地貌样区的纹理特征值的差异性,采用同一样区的不同样本纹理特征的均值,作为该样区的纹理特征值.如图3所示,DEM和影像数据量化结果具有较为明显的差异性.二阶角矩反映了图像的均匀和粗细程度,除平原区和台地,影像数据的二阶角矩明显高于DEM数据,体现出影像的纹理分布更为均匀.对比度反应了图像的纹理强度,这也是和人眼感知最为密切的纹理特征.从图3可明显看出,影像数据的对比度要明显高于DEM数据,表明影像数据的纹理强度要明显高于DEM数据.另外,不同样区影像数据的对比度特征差异更明显,呈现出丘陵区较高,平原,台地和山地较低的趋势.方差主要表现纹理的周期性特征,方差越大则纹理的周期性信息越强.实验结果表明,影像数据的方差特征值明显高于DEM数据,即影像数据的纹理周期性要强于DEM数据.熵表示了纹理的复杂度信息,由图3可知,除渭河平原和黄土台塬外,DEM的熵值要高于影像数据,即纹理的复杂度较高.
Fig. 3 Quantitative results of texture features derived from DEM and image data

图3 基于 DEM和影像数据纹理特征值

4.2 纹理指标组内稳定性分析

在不同纹理特征值分析的基础上,需进一步研究同一个样区内不同样本的纹理指标的稳定性.图4是计算后的不同样区纹理特征值的组内变异系数.由图4可知,在渭河平原和黄土台塬2个样区,基于DEM计算的4个纹理特征值的组内变异系数均高于影像数据,而其他6个样区影像数据的变异系数更高.这也表明地势起伏较低的地区,DEM数据的纹理特征随机性更强,而在其他6个地形起伏较大样区DEM纹理特征的稳定性要更强.该实验结果表明,从地形数据量化的稳定性角度考虑,DEM数据在起伏较大区域具有优势,而影像数据则在地形平坦区域更优.另一个较为明显的特征是对于丘陵区的3个样区,采用DEM数据时组内变异系数相差不大,而采用影像数据时,黄土塬和黄土梁的组间变异系数,要明显高于黄土峁,其原因在于黄土塬和黄土梁区人为活动对地表的改造较多,如公路,村落,梯田等,这些改造会造成地形特征表达的不确定性,而黄土峁区由于沟壑侵蚀非常严重,地形更为破碎,因此人类活动的改造相对较少,这使得影像数据在该区域能更好地反映地形的特征.
Fig. 4 Variation coefficient within group of texture features derived from DEM and image data

图4 DEM和影像数据纹理指标组内变异系数

4.3 纹理指标组间差异性分析

在纹理特征稳定性分析的基础上,进一步研究纹理特征在不同地貌样区间的差异.本文采用了组间变异系数,对每一个样区各样本的纹理特征值求取均值,在此基础上计算8个样区之间纹理指标的变异系数.如表2所示,组间变异系数统计结果表明DEM数据的二阶角矩,对比度和熵3个纹理指标的组间变异系数要高于影像数据,影像数据的方差则明显高于DEM数据.而从具体数值分析, DEM数据的对比度具有最高的组间变异系数,表明该纹理指标对不同组别的地形样本具有最高的区分度,在地形分析时,该纹理指标的不同地貌样区的量化结果具有最大的差异性.
Tab. 2 Variation coefficient among groups of texture features

表2 纹理指标组间变异系数

DEM 影像
二阶角矩 0.455 0.275
对比度 0.569 0.377
方差 0.121 0.242
0.136 0.126

4.4 基于DEM派生因子改进实验分析

上述分析表明,DEM在地形分析中优势得到论证,而影像数据在起伏较小的渭河平原和黄土台塬样区,则起到了一定辅助作用.考虑DEM可派生出一系列的地形因子,这些地形因子通过灰度域的表达也可反映出一定的纹理特征.因此,本研究增加了光照模拟和坡度2个地形因子,以测试DEM派生因子对原始DEM纹理信息的改进效果.其中,光照模拟是一种常用的地形数据可视化增强方法,而坡度则是最常用的坡面因子,这2个地形因子具有代表性.图5为采用派生数据后,相比较原始DEM数据组内变异系数的变化率,数据为正表明变异系数降低,稳定性增强.由图5可知,DEM派生数据方差的总体表现最好,在8个样区2类数据的组内变异系数均有改善,其中光照模拟数据的改进效果更为明显,在隶属丘陵的3个样区,改进率接近于100%.对比度的改进效果也较为理想,然而,在台地的2类数据改进率均为负值,表明这2类数据的对比度无法提高台地样本的量化稳定性.二阶角矩和熵2个指标的改进后的效果在不同样区差异性较大.对于二阶角矩,在渭河平原,黄土峁和大巴中山3个样区2类派生数据的改进效果较为明显;而对于熵而言,黄土塬,黄土峁和大巴中山3个样区的稳定性有所提高.
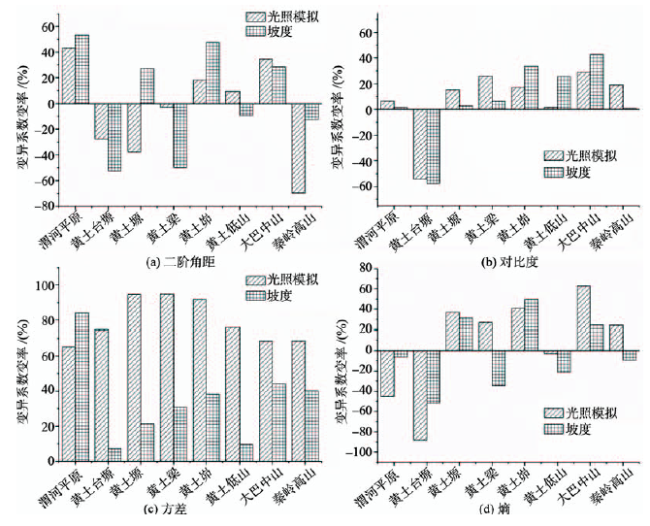
Fig. 5 Improved value of variation coefficient within group of texture features derived from hillshade and slope

图5 光照模拟和坡度数据纹理指标组内改进值

进一步计算可得到改进后的组间变异系数,结合表2统计结果,采用4种不同数据的组间变异系数统计如图6所示.其中,光照模拟和坡度数据的二阶角矩指标的组间变异系数大幅领先于其他指标,分别达到了1.48和1.37.对于其他3个纹理指标,光照模拟数据在对比度和熵2个指标取得最大的组间变异系数,而方差的组间变异系数最大值则属于坡度数据.这进一步证明,虽然原始DEM数据的纹理特征在不同地貌样区的差异分析中的优势并不明显,但其派生的光照模拟和坡度数据可有效提高纹理指标的差异性与区分度.
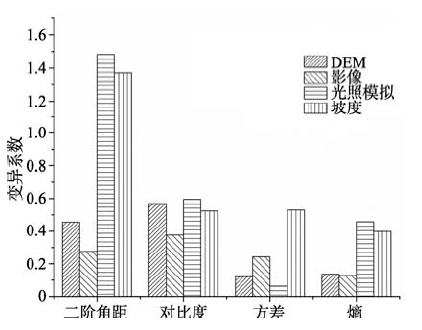
Fig. 6 Variation coefficient among groups of texture features

图6 纹理指标组间变异系数

5 讨论

本文通过8个不同地貌样区的实验,对DEM和影像数据的纹理特征进行对比研究.结合上文分析,以下问题需进一步阐述:
(1)纹理分析的尺度效应:重点分析了尺度和数据尺度[27-28].分析尺度主要指分析方法本身的尺度问题,本文中即点对间距的大小.数据尺度在地形分析中一般指数据的分辨率,本研究中的DEM和影像数据的分辨率均设定为25 m.采用中分辨率数据主要考虑2点原因:(1)在地形分析时,研究对象和研究目标决定了采用什么分辨率的数据.传统地形分析在局部地形特征提取方面已较为成熟,然而在宏观尺度却无法实现对地貌形态的有效量化.纹理的基本特征是局部不规则,宏观有规律,因此采用纹理特征对地形对象分析,旨在挖掘出地形单元的宏观规律性.从这个角度出发,如果数据分辨率过高,地表的细节信息会大量呈现,而这些随机无规律的细节信息对于纹理分析并无帮助,反而会影响纹理宏观规律性的体现.(2)地形特征只有在一定地域范围下才能体现出自身的周期性特征.因此,使用较高分辨率数据,势必需具有较大的栅格行列数地形数据,才能满足地形分析要求,而这又会大大降低纹理分析的效率.因此,虽然高分辨率DEM和影像数据已日趋丰富,然而数据分辨率的提升并不一定带来更优的分析结果,只有当分析方法与数据分辨率相契合,相关地形分析的结果才具有可信度.
(2)纹理指标的地学内涵: DEM数据实现了对地貌形态的模拟表达,反映了地表的真实起伏状态,是地形分析的主要数据源,其优势在本研究中已进一步得到论证;遥感影像数据则反映了地表的特征,虽会受到地形以外要素的影响,但也是地形分析的重要辅助数据.这2种数据的地形特征提取,地形因子计算等都具有明确的地学内涵.纹理分析的过程是在DEM和影像数据的基础上,进一步抽象出其表现的纹理特征,此时纹理指标的定义完全基于图像特征,因而计算结果也很难通过具体的地貌学知识予以解释.虽然对于纹理特征地学内涵的直接解释有较大困难,但考虑地表与地形特征的不同是纹理指标差异的根源,因此,如果能建立纹理指标与地形因子的相关函数,可尝试用其他地形因子对纹理指标进行间接解释.虽然在具体特征值与地学知识对应性上有欠缺,但是纹理分析方法的优势在于能从图像分析角度反映地貌形态的差异,具有更强的通用性和方法扩展性.从本质上分析,纹理分析方法更接近于人类的认知过程.对于有一定地学知识的人,通过一幅遥感影像或DEM灰度图像就可对当地的地貌形态有一个初步的判读,这一过程主要运用的是纹理信息.地形纹理对应的是一定尺度,一定空间范围内宏观上所构成的地形模式,而非微观上具体栅格的高程变异特征.当前有学者采用纹理分析方法定义不同的地貌模式,并在地貌类型划分中得到应用[29-30],这不仅体现了纹理特征与地理对象的对应性,同时也揭示了地形纹理在地貌模式研究中的潜力.

6 结论

(1)DEM数据和影像数据分别反映了地形特征和地表特征:DEM数据在地形起伏较大区域量化结果较好,遥感影像数据量化结果则易受地表覆盖物信息影响.
(2)从相同样区量化结果稳定性角度考虑,DEM数据在丘陵和山地具有绝对优势,影像数据则可在平原和台地改进量化结果的稳定性.从纹理指标对不同地貌样区量化的差异性角度分析, DEM数据相比影像数据具有一定优势,尤其是二阶角矩和对比度2个指标.
(3)光照模拟和坡度数据作为DEM数据的派生因子可丰富纹理分析数据源,2类数据能明显提高不同样区之间量化结果的差异性,但在组内量化结果稳定性方面改善并不明显.
综上所述,在地形分析时需结合数据特点,样区特点,纹理指标特点,研究目的等选择最适宜的研究数据与分析方案,DEM数据在地形特征分析方面具有明显优势,影像数据作为辅助数据在地形起伏较小区域可发挥自身特点.后续研究需进一步考虑影像数据时相的影响及分析结果的尺度效应,以提高相关研究成果的适用性.

The authors have declared that no competing interests exist.

[1]
Evans I S.Geomorphometry and landform mapping: What is a landform?[J]. Geomorphology, 2012,137(1):94-106.

[2]
Hengl T, Reuter H I.Geomorphometry: Concepts, Software, Applications[M]. Developments in Soil Science. Elsevier, 2008.

[3]
丁永建,周成虎,邵明安,等.地表过程研究进展与趋势[J].地球科学进展,2013,28(4):40-419.地表过程复杂多样、涉及广泛。针对当前地表过程研究现状,从地球系统科学和全球变化的视角讨论了与地表过程相关的一些概念及研究内涵。在分析单要素地表过程和多要素地表过程的基础上,从研究内容的综合性、多国合作的国际性、针对区域突出问题的区域性、以过程变化为核心的动态性及研究方法的多样性等方面论述了地表过程研究的特点,总结性地给出了国内外研究的总体趋势。在上述分析基础上,进一步从国际科学发展趋势、国家需要和信息、技术等方面分析了中国地表过程研究所面临的机遇;从多学科交叉、自然与人文过程的定量与有机耦合等方面讨论了地表过程研究所面临的挑战。

DOI

[ Ding Y J, Zhou C H, Shao M A, et al.Studies of Earth surface processes: progress and prospect[J]. Advances in Earth Science, 2013,28(4):40-419. ]

[4]
胡鹏,杨传勇,吴艳兰,等.新数字高程模型理论,方法,标准和应用[M].北京:测绘出版社,2007.

[ Hu P, Yang C Y, Wu Y L, et al.New DEM theories methods standards and application[M]. Beijing: Surveying and Mapping Press,2007. ]

[5]
江岭,汤国安,赵明伟,等.顾及地貌结构特征的黄土沟头提取及分析[J].地理研究,2013,32(11):2153-2162.沟头是黄土地貌中发育最活跃的地貌部位,沟头的个体与群体对黄土沟间地的蚕食,成为监测黄土高原地面侵蚀演化的重要标识。有效获取并分析沟头的空间分布特征,对于系统、深入地研究黄土地貌的空间形态结构具有重要的意义。以陕北黄土高原典型地貌类型区为实验样区,设计并实现了基于5 m分辨率DEM的沟头提取算法,获取了各实验样区的沟头空间信息;运用点格局分析方法,分析了沟头的空间分布特征。实验结果显示,所提出顾及沟沿线的沟头自动提取方法,具有较好的合理性与精确性;同时,从黄土塬区、黄土残塬区到黄土丘陵沟壑区,随着沟壑发育程度的增强,沟头逐步逼近分水线,其空间分布呈现“远分水线聚集—随机—近分水线聚集”的变化格局。

DOI

[ Jiang L, Tang G A, Zhao M W, et al.Extraction and analysis of loess gully heads considering geomorphological structures. Geographical Research, 2013,32(11):2153-2162. ]

[6]
周毅,汤国安,张婷,等.基于格网DEM 线状分析窗口的地形特征线快速提取方法[J]. 测绘通报,2007,10:67-69.提出基于正交条带状分析窗口及DEM数据,实现地形特征线快速提取的方法.通过在黄土丘陵区的实验显示,该方法与现有的方法相比具有提取方法简单、精度高、栅格矢量数据格式间转换较为方便的特点.

[ Zhou Y, Tang G A, Zhang T, et al.A new method for the derivation of terrain skeleton lines based on wire-like analysis window in grid DEMs[J]. Bulletin of Surveying and Mapping, 2007,10: 67-69. ]

[7]
汤国安. 我国数字高程模型与数字地形分析研究进展[J].地理学报,2014,69(9):1305-1325.数字高程模型是最重要的国家基础地理信息数据,基于GIS的数字地形分析的理论、方法与应用,是当今地理学、地貌学界,特别是地理信息科学研究的热点问题.本文从DEM的数据模型、数字地形分析的不确定性、分析方法、尺度效应、高性能计算方法以及地学应用等方面,对我国学者在该领域的研究情况,特别是研究成果进行较全面的梳理与分析.综述显示,我国具有一批从事数字高程模型与数字地形分析的高水平研究力量,研究方向紧跟国际前沿,并取得了丰硕的成果,部分研究内容具有显著创新,年轻一代科学家正加速成长.在黄土高原、青藏高原的区域数字地形分析方面更彰显我国科学家的优势与特色,在国际学术界产生了重要的影响.

DOI

[ Tang G A.Progress of DEM and Digital Terrain Analysis in China[J]. Acta Geographica Sinica, 2014,69(9):1305-1325. ]

[8]
周毅,汤国安,王春,等.基于高分辨率DEM 的黄土地貌正负地形自动分割技术研究[J].地理科学,2010,30(2):261-266.黄土地貌正负地形自动分割是构建地表空间分布式机理-过程模型的基础。在分析黄土高原地区典型地貌坡面形态及汇流过程特征的基础上,提出了基于5m分辨率栅格DEM自动分割黄土正、负地形的技术方案。该方案首先利用坡面上下游栅格点的坡度对比识别沟沿线点,然后利用汇水模型提取沟沿线点约束的上游汇水区域,从而实现正、负地形的自动分割。在黄土塬区及丘陵沟壑区的实验结果表明,该方法的优点是提取精度高,人工干预少,在不同地貌类型区域内有很好的应用适宜性。

[ Zhou Y, Tang G A, Wang C, et al.Automatic segmentation of loess positive and negative terrains based on high resolution grid DEMs[J]. Scientia Geographica Sinica, 2010,30(2):261-266. ]

[9]
Shruthi R, Kerle N, Jetten V.Object-based gully feature extraction using high spatial resolution imagery[J].Geomorphology, 2011,134(3):260-268.Gully erosion is responsible for a substantial amount of soil loss and is generally considered an indicator of desertification. Hence, mapping these gully features provides essential information needed on sediment production, identification of vulnerable areas for gully formation, land degradation, and environmental and socio-economical effects. This paper investigates the use of object-oriented image analysis (OOA) to extract gully erosion features from satellite imagery, using a combination of topographic, spectral, shape (geometric) and contextual information obtained from IKONOS and GEOEYE-1 data. A rule-set was developed and tested for a semi-arid to sub-humid region in Morocco. The percentage of gully system area indicated negligible overestimations between the reference area and the OOA area in two sub-watersheds (0.03% and 1.77%). We also observed that finer gully-related edges within the complex gully systems were better identified semi-automatically than was possible by manual digitization, suggesting higher detection accuracy. OOA-based gully mapping is quicker and more objective than traditional methods, and is thus better suited to provide essential information for land managers to support their decision making processes, and for the erosion research community.

DOI

[10]
Lucian D, Thomas B.Automated classification of landform elements using object-based image analysis[J]. Geomorphology, 2006,81(3):330-344.This paper presents an automated classification system of landform elements based on object-oriented image analysis. First, several data layers are produced from Digital Terrain Models (DTM): elevation, profile curvature, plan curvature and slope gradient. Second, relatively homogenous objects are delineated at several levels through image segmentation. These object primatives are classified as landform elements using a relative classification model, built both on the surface shape and on the altitudinal position of objects. So far, slope aspect was not used in classification. The classification has nine classes: peaks and toe slopes (defined by the altitudinal position or the degree of dominance), steep slopes and flat/gentle slopes (defined by slope gradients), shoulders and negative contacts (defined by profile curvatures), head slopes, side slopes and nose slopes (defined by plan curvatures). Classes are defined using flexible fuzzy membership functions. Results are visually analyzed by draping them over DTMs. Specific fuzzy classification options were used to obtain an assessment of output accuracy. Two implementations of the methodology are compared using (1) Romanian datasets and (2) Berchtesgaden National Park, Germany. The methodology has proven to be reproducible; readily adaptable for diverse landscapes and datasets; and useful in respect to providing additional information for geomorphological and landscape studies. A major advantage of this new methodology is its transferability, given that it uses only relative values and relative positions to neighboring objects. The methodology introduced in this paper can be used for almost any application where relationships between topographic features and other components of landscapes are to be assessed.

DOI

[11]
Ehrlich D, Guo H D, Molch K, et al.Identifying damage caused by the 2008 Wenchuan earthquake from VHR remote sensing data[J]. International Journal of Digital Earth, 2009,2(4):309-326.The paper discusses the potential of very high resolution (VHR) satellite imagery for post-earthquake damage assessment in comparison with the role of aerial photographs. Post-disaster optical and radar satellite data are assessed for their ability to resolve collapsed buildings, destroyed transportation infrastructure, and specific land cover changes. Optical VHR imagery has shown to be effective in quantifying building stock and for assessing damage at the building level. High-resolution synthetic aperture radar (SAR) imagery requires further research to identify optimum information extraction procedures for rapid assessment of affected buildings. Based on current technical and operational capabilities increasing efforts should be devoted to the generation of spatial datasets for disaster preparedness.

DOI

[12]
Tarolli P.High-resolution topography for understanding Earth surface processes: Opportunities and challenges[J]. Geomorphology, 2014,216(1):295-312.In the last decade, a range of new remote-sensing techniques has led to a dramatic increase in terrain information, providing new opportunities for a better understanding of Earth surface processes based on geomorphic signatures. Technologies such as airborne and terrestrial lidar (Light Detection and Ranging) to obtain high-resolution topography have opened avenues for the analysis of landslides, hillslope and channellization processes, river morphology, active tectonics, volcanic landforms and anthropogenic signatures on topography. This review provides an overview of the recent flourishing literature on high-resolution topographic analyses, underlining their opportunities and critical issues such as their limitations. The goal is to provide answers to questions such as what kind of processes can be analyzed through high-resolution topographic data and how to do it. The review focuses on two different environments: natural and engineered landscapes. In both contexts, high-resolution topography offers opportunities to better understand geomorphic processes from topographic signatures. Particular attention is given to engineered landscapes in which the direct anthropic alteration of processes is significant. The last part of the review discusses future challenges.

DOI

[13]
Booth A M, Roering J J, Perron J T.Automated landslide mapping using spectral analysis and high-resolution topographic data: Puget Sound lowlands, Washington, and Portland Hills, Oregon[J]. Geomorphology, 2009,109(3),132-147.Landslide inventory maps are necessary for assessing landslide hazards and addressing the role slope stability plays in landscape evolution over geologic timescales. However, landslide inventory maps produced with traditional methods 鈥 aerial photograph interpretation, topographic map analysis, and field inspection 鈥 are often subjective and incomplete. The increasing availability of high-resolution topographic data acquired via airborne Light Detection and Ranging (LiDAR) over broad swaths of terrain invites new, automated landslide mapping procedures. We present two methods of spectral analysis that utilize LiDAR-derived digital elevation models of the Puget Sound lowlands, Washington, and the Tualatin Mountains, Oregon, to quantify and automatically map the topographic signatures of deep-seated landslides. Power spectra produced using the two-dimensional discrete Fourier transform and the two-dimensional continuous wavelet transform identify the characteristic spatial frequencies of deep-seated landslide morphologic features such as hummocky topography, scarps, and displaced blocks of material. Spatial patterns in the amount of spectral power concentrated in these characteristic frequency bands highlight past slope instabilities and allow the delineation of landslide terrain. When calibrated by comparison with detailed, independently compiled landslide inventory maps, our algorithms correctly classify an average of 82% of the terrain in our five study areas. Spectral analysis also allows the creation of dominant wavelength maps, which prove useful in analyzing meter-scale topographic expressions of landslide mechanics, past landslide activity, and landslide-modifying geomorphic processes. These results suggest that our automated landslide mapping methods can create accurate landslide maps and serve as effective, objective, and efficient tools for digital terrain analysis.

DOI

[14]
Shruthi R, Kerle N, Jetten V, et al.Object-based gully system prediction from medium resolution imagery using Random Forests[J]. Geomorphology, 2014,216(5),283-294.Erosion, in particular gully erosion, is a widespread problem. Its mapping is crucial for erosion monitoring and remediation of degraded areas. In addition, mapping of areas with high potential for future gully erosion can be used to assist prevention strategies. Good relations with topographic variables collected from the field are appropriate for determining areas susceptible to gullying. Image analysis of high resolution remotely sensed imagery (HRI) in combination with field verification has proven to be a good approach, although dependent on expensive imagery. Automatic and semi-automatic methods, such as object-oriented analysis (OOA), are rapid and reproducible. However, HRI data are not always available. We therefore attempted to identify gully systems using statistical modeling of image features from medium resolution imagery, here ASTER. These data were used for determining areas within gully system boundaries (GSB) using a semi-automatic method based on OOA. We assess if the selection of useful object features can be done in an objective and transferable way, using Random Forests (RF) for prediction of gully systems at regional scale, here in the Sehoul region, near Rabat, Morocco. Moderate success was achieved using a semi-automatic object-based RF model (out-of-bag error of 18.8%). Besides compensating for the imbalance between gully and non-gully classes, the procedure followed in this study enabled us to balance the classification error rates. The user's and producer's accuracy of the data with a balanced set of class showed an improved accuracy of the spatial estimates of gully systems, when compared to the data with imbalanced class. The model over-predicted the area within the GSB (13-27%), but its overall performance demonstrated that medium resolution satellite images contain sufficient information to identify gully systems, so that large areas can be mapped with relatively little effort and acceptable accuracy.

DOI

[15]
Shruthi R, Kerle N, Jetten V, et al.Quantifying temporal changes in gully erosion areas with object oriented analysis[J]. Catena, 2015,128(5):262-277.Mapping gully systems and quantifying their changes over time are essential for implementing soil conservation measures. The aim of this study is to analyze the changes in the gully systems in the context of land management. Image analysis of remotely sensed data in combination with field verification has proven to be a good and practical approach for mapping gully features over large areas, given the variability in gully size, shape and occurrence. Recent work has shown object-based image analysis also termed as object oriented analysis (OOA) to be superior to pixel-based methods for the identification and characterization of gullies. This study presents an improved procedure to map gully features, one that has been extended to assess and quantify erosion area dynamics. In addition to the convention of using suitable topographic and spectral thresholds in the method, the use of contrast and edge filter information and process knowledge of erosion by overland flow was incorporated in the rule-set to help recognize potential gullies in Ikonos-2 and GeoEye-1 data. Changes in the area enclosed by the gully system boundary estimated for three different sub-watersheds (SW1, SW2 and SW3), observed over a period of eight years ranged from moderate (11% in SW2 and 21% in SW1) to a very high increase (91% in SW3). However, the changes seen in gully system density were much higher than the changes in the area enclosed by the gully system boundary (81%, 104% and 109% in the respective SWs). The complex gully systems were better identified semi-automatically than was possible by manual digitization; in particular the finer edges of the gully systems, which in turn led to better quantification of changes in the gully systems. The study also determined that the rule-set developed for gully feature extraction is more sensitive to the spatial resolution of the imagery used than the quality or resolution of the digital terrain model and its derivatives. Determining suitable segmentation parameters, selecting appropriate object features for the classification, the thresholds used retain the trial & error aspects in this analysis. This limits its application to a regional scale. The rule-set developed is generic and transferable to other region/imagery with adaptation. The rule-set will be made available on our website ( www.itc.nl/OOA-group ).

DOI

[16]
刘丽,匡纲要.图像纹理特征提取方法综述[J].中国图象图形学报,2009,14(4):622-635.纹理是一种重要的视觉线索,是图像中普遍存在而又难以描述的特征。纹理分类与分割是图像处理领域一个经久不衰的热点研究领域,纹理特征提取作为纹理分类与分割的首要问题,一直是人们关注的焦点,各种纹理特征提取方法层出不穷。在广泛文献调研的基础上,回顾了纹理特征提取方法的发展历程,分析了其研究现状,对纹理特征提取方法进行了较为全面的综述,对其进行分类和比较,最后给出了纹理研究领域的主要发展趋势。

DOI

[ Liu L, Kuang G Y.Overview of image textural feature extraction methods[J]. Journal of Image and Graphics, 2009,14(4):622-635. ]

[17]
陶旸. 基于纹理分析方法的DEM地形特征研究[D].南京:南京师范大学,2011.

[ Tao Y.Textural methods for topographic features analysis based on DEMs[D]. Nanjing: Nanjing Normal University, 2011. ]

[18]
刘凯,汤国安,陶旸,等.基于灰度共生矩阵的DEM地形纹理特征量化研究[J].地球信息科学学报,2012,14(6):751-760.DEM的地形纹理以其表达地形表面的纯粹性与分析数据的可派生性受到越来越多关注。本文选取陕西省10个不同地貌类型区的25m分辨率DEM数据,引入空间灰度共生矩阵(GLCM)对地形表面纹理特征进行定量分析。研究表明,25m分辨率DEM数据的GLCM模型适宜分析间距是大于等于3个栅格大小。各纹理参数中,相关度可用于地形纹理的方向性量化;方差、差的方差、对比度可用于对地形纹理的周期性分析;熵、二阶角矩、逆差矩可用于对地形纹理的复杂性分析。在DEM及其派生数据中,光照模拟数据计算的各纹理参数的平均变异系数最高,表明光照模拟数据最适合于地形纹理特征的量化研究。同时本文提出了一种多参数综合的地形纹理量化方法,通过运用综合周期性和综合复杂性两个指标对不同地形区量化分析,结果表明,这两个指标对不同地形形态响应显著,可用于地形形态分类与识别研究。

DOI

[ Liu K, Tang G A, Tao Y, et al.GLCM based quantitative analysis of terrain texture from DEMs[J]. Journal Of Geo-Information Science, 2012,14(6): 751-760. ]

[19]
Liu K, Tang G A, Jiang S.Research on the classification of terrain texture from DEMs based on BP neural network[C]. Geomorphometry, 2013.

[20]
王琛智,汤国安,袁赛,等.基于DEM纹理特征的月貌自动识别方法探究[J].地球信息科学学报,2015,17(1):45-53.<p>月海和月陆是两种最主要的月貌单元,对于月海及月陆快速准确地识别是进行各项月球研究的重要基础。目前,月海和月陆的识别大多采用DEM结合其派生地形因子建立指标体系的方法。这种方法虽然可在宏观尺度对月海和月陆进行识别和提取,但仍存在2 个问题:(1)可扩展性差,不同地区难以共用同一套地形因子构建指标体系;(2)指标体系中各因子权重设置具有较大的主观性。针对以上问题,本文以&ldquo;嫦娥一号&rdquo;探测器获取的全月球DEM数据,从月表地形纹理特征的角度出发,提出一种以月表DEM数据识别月海、月陆的自动快速的方法。首先,利用灰度共生矩阵模型,以DEM数据为基础,实现对典型月海、月陆地形纹理特征的量化,然后,对量化指标的筛选,构建能有效区分两类月表形貌单元的特征向量。在此基础上,选用离差平方和作为识别器,最终实现对月海和月陆的自动识别。本文识别方法的整体识别率达到85.7%;综上可知,该方法既能克服原有方法中因子权重设置的主观性,又具有较好的通用性。</p>

DOI

[ Wang C Z, Tang G A, Yuan S, et al.A Method for Identifying the Lunar Morphology Based on Texture from DEMs[J]. Journal Of Geo-Information Science, 2015,17(1):45-53. ]

[21]
周成虎,程维明,钱金凯.数字地貌遥感解析与制图[M].北京:科学出版社,2009.

[ Zhou C H, Chen W M, Qian J K.Digital geomorphological interpretation and mapping from remote sensing[M]. Beijing: Science press, 2009. ]

[22]
黄听,张良培,李平湘.融合形状和光谱的高空间分辨率遥感影像分类[J].遥感学报,2007,11(2):193-200.提出了一种像元形状指数及基于形状和光谱特征融合的高(空间)分辨率遥感影像分类方法。形状和光谱是遥感影像纹理的具体表现形式,尤其在高分辨率影像中地物细节得到充分表达,相邻像元的关系及其共同表征的形状特性成为分类的重要因素。本文用像元及其邻域的关系来描述其空间结构,同时为了更全面地利用影像特征,提出了基于支持向量机的形状和光谱融合分类方法。实验证明,该方法计算简便且能有效表达高分辨率影像的地物特征,提高分类精度。

DOI

[ Huang X, Zhang L P, Li P X.Classification of high spatial resolution remotely sensed imagery based on the fusion of spectral and shape features[J]. Journal of Remote Sensing, 2007,11(2):193-200. ]

[23]
周成虎,程维明,钱金凯,等.中国陆地1:100 万数字地貌分类体系研究[J].地球信息科学学报,2009,11(6):707-724.地貌分类体系是地貌图研制的关键之一,本文在总结国内外地貌及分类研究的基础上,借鉴20世纪80年代的中国1∶100万地貌图制图规范,基于遥感影像、数字高程模型和计算机自动制图等技术条件,归纳总结了数字地貌分类过程中应遵循的几大原则,分析了它们之间的相互关系,讨论了数字地貌分类的各种指标:包括形态、成因、物质组成和年龄等,提出了中国陆地1∶100万数字地貌三等六级七层的数值分类方法,扩展了以多边形图斑反映形态成因类型,以点、线、面图斑共同反映形态结构类型的数字地貌数据组织方式,并详细划分了各成因类型的不同层次、不同级别的地貌类型。中国1∶100万数字地貌分类体系的研究,为遥感等多源数据的陆地地貌解析和制图提供了规范,也为《中华人民共和国地貌图集》的编制奠定了基础,同时为全国大、中比例尺地貌图的分类和编制研究提供了借鉴。

DOI

[ Zhou C H, Chen W M, Qian J K, et al.Research on the classification system of digital land geomorphology of 1:1000000 in China[J]. Journal Of Geo-Information Science, 2009,11(6):707-724. ]

[24]
Mäenpää T, Pietikäinen M.Classification with color and texture: jointly or separately?[J]. Pattern recognition, 2004,37(8):1629-1640.<h2 class="secHeading" id="section_abstract">Abstract</h2><p id="">Current approaches to color texture analysis can be roughly divided into two categories: methods that process color and texture information separately, and those that consider color and texture a joint phenomenon. In this paper, both approaches are empirically evaluated with a large set of natural color textures. The classification performance of color indexing methods is compared to gray-scale and color texture methods, and to combined color and texture methods, in static and varying illumination conditions. Based on the results, we argue that color and texture are separate phenomena that can, or even should, be treated individually.</p>

DOI

[25]
Palm C.Color texture classification by integrative Co-occurrence matrices[J]. Pattern recognition, 2004,37(5):965-976.<h2 class="secHeading" id="section_abstract">Abstract</h2><p id="">Integrative Co-occurrence matrices are introduced as novel features for color texture classification. The extended Co-occurrence notation allows the comparison between integrative and parallel color texture concepts. The information profit of the new matrices is shown quantitatively using the Kolmogorov distance and by extensive classification experiments on two datasets. Applying them to the RGB and the LUV color space the combined color and intensity textures are studied and the existence of intensity independent pure color patterns is demonstrated. The results are compared with two baselines: gray-scale texture analysis and color histogram analysis. The novel features improve the classification results up to 20% and 32% for the first and second baseline, respectively.</p>

DOI

[26]
Haralick R M, Shanmugam K, Dinstein I H.Textural features for image classification[J]. IEEE Trans. on SMC, 1973,3(6):610-621.

[27]
秦承志,呼雪梅.栅格数字地形分析中的尺度问题研究方法[J].地理研究,2014,33(2):270-283.栅格数字高程模型(DEM)固有的尺度特征给以栅格DEM为基本输入的数字地形分析带来各种尺度问题。对栅格数字地形分析中涉及的尺度进行梳理,以分辨率和分析窗口为重点,对栅格数字地形分析中的多尺度表达、尺度效应、适宜尺度选择、尺度转换等尺度问题及其相互关系进行阐述;分别介绍各类尺度问题的现有定量研究方法,尤其对尺度效应定量刻画和适宜尺度选择方法,根据不同方法计算定量指标所利用的信息类别进行分类归纳;最后讨论了其中有待进一步开展研究的几方面工作。

DOI

[ Qin C Z, Hu X M.Review on scale-related researches in grid-based digital terrain analysis[J]. Geographical research, 2014,33(2):270-283. ]

[28]
黄骁力,汤国安,刘凯.DEM分辨率对地形纹理特征提取的影响[J].地球信息科学学报,2015,17(7):822-829.地形纹理是区分不同地貌形态的 重要依据,DEM是地形纹理分析的重要数据。然而,DEM分辨率使地形纹理特征提取存在着不确定性问题。本文以具有显著地貌多样性与差异性的陕西省为例, 选择6个不同地貌类型区为研究区,以25 m分辨率DEM数据作为信息源,构建了多尺度的地面坡度、光照模拟和粗糙度数据序列。在此基础上,引入空间灰度共生矩阵(GLCM)对地形表面纹理特征进 行量化分析,以揭示数据分辨率对地形纹理特征提取的影响。研究表明:对于单一样区,在DEM及其3个派生数据中,原始高程数据和粗糙度数据的纹理参数特征 值,对分辨率的变化较为敏感。对于不同的地貌类型区,二阶角矩和对比度这2个纹理参数具有最大的变异系数,表明它们对于区分不同地貌类型的能力最强;二阶 角矩具有较大的尺度依赖性,随着分辨率的降低,其区分能力急剧降低,而对比度对于地貌的区分能力,则随着分辨率的降低而增强,并保持在一个较大的范围内。 DEM数据的对比度对于不同地貌的区分能力,在所选4个参数中最为稳定,而粗糙度数据的二阶角矩区分不同地貌的能力,随着数据分辨率的变化而最不稳定。以 上结果对于根据不同的研究对象选择适宜的DEM分辨率及地形纹理参数具有一定的指导意义。

[ Huang X L, Tang G A, Liu K.Influence of DEM resolution on the extraction of terrain texture feature[J]. Journal of Geo-Information Science, 2015,17(7):822-829. ]

[29]
Jasiewicz J, Stepinski T F.Geomorphons-a pattern recognition approach to classification and mapping of landforms[J]. Geomorphology, 2013,182(1),147-156.We introduce a novel method for classification and mapping of landform elements from a DEM based on the principle of pattern recognition rather than differential geometry. At the core of the method is the concept of geomorphon (geomorphologic phonotypes) — a simple ternary pattern that serves as an archetype of a particular terrain morphology. A finite number of 498 geomorphons constitute a comprehensive and exhaustive set of all possible morphological terrain types including standard elements of landscape, as well as unfamiliar forms rarely found in natural terrestrial surfaces. A single scan of a DEM assigns an appropriate geomorphon to every cell in the raster using a procedure that self-adapts to identify the most suitable spatial scale at each location. As a result, the method classifies landform elements at a range of different spatial scales with unprecedented computational efficiency. A general purpose geomorphometric map — an interpreted map of topography — is obtained by generalizing allgeomorphons to a small number of the most common landform elements. Due to the robustness and high computational efficiency of the method high resolution geomorphometric maps having continental and even global extents can be generated from giga-cell DEMs. Such maps are a valuable new resource for both manual and automated geomorphometric analyses. In order to demonstrate a practical application of this new method, a 30 m cellgeomorphometric map of the entire country of Poland is generated and the features and potential usage of this map are briefly discussed. The computer implementation of the method is outlined. The code is available in the public domain.

DOI

[30]
Jasiewicz J, Netzel P, Stepinski T F.Landscapes similarity, retrieval, and machine mapping of physiographic units[J]. Geomorphology, 2014, 221(9):104-112.

文章导航

/