遥感科学与应用技术

基于决策树的多角度遥感影像分类

  • 杨雪峰 , 1 ,
  • 王雪梅 , 1, 2, *
展开
  • 1. 新疆师范大学地理科学与旅游学院,乌鲁木齐 830054
  • 2. 新疆维吾尔自治区重点实验室"新疆干旱区湖泊环境与资源实验室",乌鲁木齐 830054

作者简介:杨雪峰(1972-),男,乌鲁木齐人,硕士,讲师,研究方向为干旱区资源环境遥感技术应用研究.E-mail:

收稿日期: 2015-08-24

  要求修回日期: 2015-11-15

  网络出版日期: 2016-03-10

基金资助

国家自然科学基金项目"新疆渭干河流域土地利用/土地覆盖生态风险及预警研究"(41261051)

新疆维吾尔自治区重点实验室"新疆干旱区湖泊环境与资源实验室"开放基金项目"艾比湖湿地土壤盐碱化及人文驱动因子分析"(XJDX0909-2010-08)

Classification of MISR Multi-Angle Imagery Based on Decision Tree Classifier

  • YANG Xuefeng , 1 ,
  • WANG Xuemei , 1, 2, *
Expand
  • 1. College of Geography Science and Tourism, Xinjiang Normal University, Urumqi 830054, China
  • 2. Xinjiang Uygur Autonomous Region Key Laboratory "Xinjiang Laboratory of Lake Environment and Resources in Arid Zone", Urumqi 830054, China
*Corresponding author: WANG Xuemei, E-mail:

Received date: 2015-08-24

  Request revised date: 2015-11-15

  Online published: 2016-03-10

Copyright

《地球信息科学学报》编辑部 所有

摘要

快速准确地获取土地利用/覆被信息是遥感领域研究的一个热点课题.本文用5种决策树分类器及MISR多角度数据,对塔里木河下游地区进行土地覆被分类研究.通过对不同波段和观测角数据组合形成的6个数据集进行分类比较发现:(1)无论使用哪种分类器,相比于天底角观测方式,多角度观测都能获得更高的分类精度,特别是能显著提高灌木,林地和草地类型的分类精度,说明多角度观测能有效地反映地物的反射异质性信息,更好地区分地物.(2)与MLC分类法相比,决策树算法的分类精度更高,特别是随机森林和C 5.0方法最为突出,说明决策树的分类能力要优于MLC法.使用多角度数据集时,这种差别更明显,说明决策树能更有效地利用多角度信息.(3)4种决策树算法(J48,Random Forest,LMT,C 5.0)使用近红外波段的分类效果好于使用红光波段的分类效果,说明近红外波段能提供更多的地物反射异质性信息.

本文引用格式

杨雪峰 , 王雪梅 . 基于决策树的多角度遥感影像分类[J]. 地球信息科学学报, 2016 , 18(3) : 416 -422 . DOI: 10.3724/SP.J.1047.2016.00416

Abstract

Accurately obtaining the land use and land cover information has been a hot research focus in the field of remote sensing. It is a feasible way to utilize the new remote sensing data source and the effective classification algorithms. In this study, five decision tree classifiers and the MISR multi-angle data have been implemented to study the land cover classification in the lower Tarim River. Six datasets of different bands and observation angles are classified and compared, and the findings are presented as follows: (1) Compared to the Nadir angle observation, the multi-angle observation can achieve higher classification accuracy and significantly improve the classification accuracy of the shrubs, woodland and grassland in particular. It showed that the multi-angle observation can effectively reveal the anisotropic feature of surface reflectance and get a better classification result. (2) Compared with the MLC method, the classification accuracy of the decision tree algorithms is higher, which is especially evident for the random forest and C5.0 methods, implying that the classification ability of decision tree is better than MLC and is more effective when using multi-angle datasets. (3) The classification effect of near infrared band is better than the red band, which indicates that the near infrared band can provide more information about the anisotropic feature of the surface reflectance.

1 引言

目前遥感技术已成为获取土地利用与覆被信息的主要方式,而改善遥感识别精度的一个手段是研制新型传感器.MISR是美国NASA发射的EOS TERRA卫星上搭载的多角度传感器,全称是"多角度影像光谱仪".虽然在此之前,能提供多角度观测影像的已有欧空局的CHRIS,POLDER等,但是从获取多角度数据的能力以及适用的应用领域来看,MISR无疑是具有开创意义的[1-2].与单一方向的遥感观测相比,多角度的观测富含地表的结构信息,在分类中如果加入反映地表二向性特性的方向信息,即使采用中等分辨率影像,也可以大大地提高分类精度[3-5].本文将使用MISR数据作为遥感分类信息源.
传统的基于参数化密度分布函数判别的最大似然方法(Maximum Likehood Classification,MLC)是遥感影像监督分类最常用的方法之一.它具有清晰的参数解释能力,易于与先验知识融合,算法简单而易于实施等优点.但由于遥感信息本质上分布的复杂性和随机性,当特征空间中特征的密度分布比较离散或当训练样本的选取不够充分,或者不具有代表性等情况下,会导致特征空间中特征分布不一定服从预先假设的参数化密度分布.因此,用简单的最大似然函数参数估计来进行密度函数的确定,就有可能造成与实际分布的偏离,导致分类精度下降[6].相比较而言,决策树(Decision Tree)[7]方法既无需考虑各个类别样本在特征空间中的分布形式和参数,也无需对样本分布的形式和参数进行估计,因此,其在遥感分类技术领域逐渐得到了重视[8-11].
本文使用多种决策树和MLC算法对塔里木河下游的MISR多角度遥感影像进行土地覆盖分类研究,比较不同分类器的分类效能;通过构建多角度观测数据集,对比分析使用不同观测方式对分类结果的影响.

2 研究区和数据源

(1)研究区
塔里木河是中国最长的内陆河流,位于塔克拉玛干沙漠与库鲁克沙漠之间,全长1321 km,自西北流向东南.该区域是典型的大陆型干旱气候,蒸发强烈,降雨稀少,温差大.本研究区位于新疆塔里木河下游.塔里木河下游沿河分布着荒漠河岸植被,局部地段有盐生荒漠植被发育.其中,天然乔木林以胡杨为主,灌木主要为柽柳,盐穗木,黑果枸杞,铃铛刺等,半灌木主要有大叶白麻,骆驼刺,草本植物主要有芦苇,小花棘豆,花花柴等.针对塔里木河下游土地利用覆盖实际情况,并结合前人研究的内容,制定了土地利用/覆被类型体系(表1).由于该研究区"建筑用地"面积较少,故未加入表1的分类体系中.
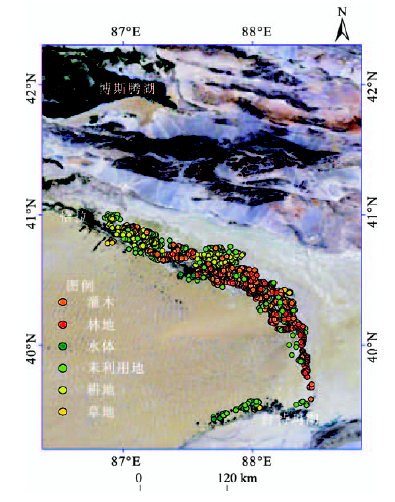
Tab.1 Land-cover and land-use classification system

表1 土地利用/覆被类型体系

土地利用类型 样地数量/个 覆盖度/(%) 描述
灌木 1888 >5 灌木,半灌木植物群落
林地 1148 >5 胡杨林
水体 95 0 水库,天然水体
未利用地 647 <5 沙地,盐碱地
耕地 383 >40 农田
草地 206 >5 盐生草本植物群落
(2) MISR数据
MISR对传统天顶观测的重要突破是提供了9个角度的观测信息.分别是4个前向观测角:AF(26.1°),BF(45.6°),CF(60.0°),DF(70.5°);4个后向观测角:AA(26.1°),BA(45.6°),CA(60.0°),DA(70.5°);一个天底角AN(0.0°).每个传感器都有4个波段:蓝光波段,绿光波段,红光波段和近红外波段[12].对同一个地点,可以同时得到4个波段,9个角度,共36个观测值.MISR中9个相机的影像分辨率如表2所示.
Tab.2 The band definition of MISR's nine cameras at the globe mode

表2 MISR影像全球模式下各角度影像的波段分辨率定义

波段 DF CF BF AF AN AA BA CA DA
NIR 1.1 kmx1.1 km 1.1 kmx1.1 km 1.1 kmx1.1 km 1.1 kmx1.1 km 275 mx275 m 1.1 kmx1.1 km 1.1 kmx1.1 km 1.1 kmx1.1 km 1.1 kmx1.1 km
Red 275 mx275 m 275 mx275 m 275 mx275 m 275 mx275 m 275 mx275 m 275 mx275 m 275 mx275 m 275 mx275 m 275 mx275 m
Blue 1.1 kmx1.1 km 1.1 kmx1.1 km 1.1 kmx1.1 km 1.1 kmx1.1 km 275 mx275 m 1.1 kmx1.1 km 1.1 kmx1.1 km 1.1 kmx1.1 km 1.1 kmx1.1 km
Green 1.1 kmx1.1 km 1.1k mx1.1 km 1.1 kmx1.1 km 1.1 kmx1.1 km 275 mx275 m 1.1 kmx1.1 km 1.1 kmx1.1 km 1.1 kmx1.1 km 1.1 kmx1.1 km
MISR多角度的观测富含地表的反射异质性信息,利于识别地表类型,苏理宏等使用MISR数据对北美地区Chihuahuan荒漠区的19类荒漠植被进行分类实验表明,相比较垂直观测数据,综合MISR和BRDF模型参数的多角度数据使得分类精度有较大的提高[13].但是,目前国内采用MISR多角度数据进行土地利用/覆被的研究还比较少.
(3)采样点
本研究使用了Quickbird,Worldview高分辨率遥感影像作为土地利用类型采集数据源,高分遥感影像数据采集时间为2008-2010年的6-9月.MISR影像作为信息判别数据源,其采集时间为2009年8月11日(轨道号为O051316).
高分辨率影像与MISR影像配准后,选取MISR影像的红光波段像元大小275 m×275 m为样地数据,以高分辨率遥感影像人工判读的方法为主,野外观测的方式辅助,总共确定了4367个样点的位置及其土地利用/覆被属性(图1).
Fig. 1 The distribution of test samples.

图1 样点分布

采样点选取的原则:(1)采样点位置为人工选取,采样点空间分布尽可能遍布在整个研究区,采样点要能代表整个研究区的状况;(2)各类型采样点的比例首先按照实际区域中各种土地利用/覆被类型所占比例多少选取,其次由于植被类型的重要性,提高了灌木和林地类型采样点的数量;(3)灌木和林地类型采样点的选取不仅要考虑到各种不同土壤和植被背景,而且适应不同植被的覆盖度;(4)混合型的样地以占优势的覆被类型来定类.
(4)多角度数据集
本研究中数据集构建的原则:(1)为了探寻MISR不同角度相机对分类结果的影响力,选取代表垂直观测的Nadir(天底角)AN相机数据,分别与A,B,C,D前后向相机进行组合;(2)为了探寻不同波段的影响,选择了对土壤和植被敏感的红光和近红外波段[14].蓝光和绿光波段由于分辨率较低,同时易受大气散射影响,只留取AN相机.
分别提取所有采样点位置的MISR中9个相机的地表反射率数据,即所有相机的红光,近红外波段(1.1 km分辨率的波段插值成275 m),AN相机的蓝光和绿光波段,以及采样点的土地利用/覆被类型.按照不同的组合方式,分成6组数据作为土地利用类型信息判别数据(表3).其中,每组数据中都随机选取2/3(2925个)作为训练数据集,剩余的1/3(1442个)的数据作为测试数据集.
Tab. 3 MISR multi-angle observation dataset

表3 MISR多角度观测数据集

数据集 描述
Nadir AN相机的蓝,绿,红和近红外波段地表反射率数据
Nadir plus ABCD Nir AN相机的4个波段和A,B,C,D前后向相机的8个近红外波段地表反射率数据
Nadir plus ABCD Red AN相机的4个波段和A,B,C,D前后向相机的8个红光波段地表反射率数据
Nadir plus ABCD Red and Nir AN相机的4个波段和A,B,C,D前后向相机的8个红光及8个近红外波段地表反射率数据
Nadir Nir plus ABCD Nir AN相机的近红外波段和A,B,C,D前后向相机的8个近红外波段地表反射率数据
Nadir Red plus ABCD Red AN相机的红光波段和A,B,C,D前后向相机的8个红光波段地表反射率数据

3 多角度遥感影像分类

3.1 分类方法

研究选择基于决策树的分类算法有J48[15],Random Forest [16],LMT(Logistic Model Trees)[17],C 5.0[18]和CART(Classification And Regression Tree)[19].
(1) J48 :是C 4.5算法的一个版本.C 4.5算法是机器学习算法中的一种分类决策树算法,其核心算法是ID3 算法.C 4.5算法采用信息增益率作为选择分支属性的标准,克服了ID3算法中信息增益选择属性时偏向选择取值多的属性这一不足,并能完成对连续属性离散化的处理,还能对不完整数据进行处理.史泽鹏等使用J48和MLC算法对安徽肥东县的ETM数据进行土地覆被分类,3期的结果显示J48的分类总体精度比MLC高6%~9%[20].陈绍杰等使用多分类器和ETM,中巴卫星等不同数据源影像对江苏省徐州市东矿区和西矿区的土地覆被制图发现,J48的总体精度比SVM(支持向量机),径向基函数神经网络和MLC法都低,仅与最小距离法相当[21].
(2) 随机森林(Random Forests,RF):是由Breiman[22]提出的一种基于CART决策树的组合分类器.随机森林是一个包含多个决策树的分类器,并且其输出的类别是由个别树输出的类别的众数而定.它能够处理高维度的数据,并且不用做特征选择.Jay等使用随机森林方法和高光谱影像对入侵植被制图得到了88.37%的总体精度[23];Waske和Braun使用随机森林方法和MLC方法对多时相SAR分别分类,发现随机森林的总体精度比MLC高平均10%[24].
(3) LMT(Logistic Model Trees):其组合了树结构和Logistic回归模型,每个叶子节点是一个Logistic回归模型,能产生更小更精确的树,准确性比单独的决策树和Logistic回归方法要好[17].
(4) C 5.0:是C 4.5后续的版本,增加了Boosting算法以提高分类精度,实际上是依次建立一系列决策树,后建立的决策树重点考虑以前被错分和漏分的数据,最后生成更准确的决策树.齐红超等使用ETM影像,采用C 5.0决策树算法,综合利用地物波谱,NDVI,TC,纹理等信息在武威绿洲的LUCC制图中,总体分类精度为0.8177[9];申文明等以河北唐山为研究区,应用ETM+影像数据和GIS数据,对C 5.0决策树分类技术和MLC进行了比较,研究表明:决策树与传统MLC相比,分类精度提高了18.29%[10].
(5)CART(Classification And Regression Tree):是Breiman于1984年提出的决策树构建算法[25].其基本原理是通过对由测试变量和目标变量构成的训练数据集的循环分析,以二叉树的形式给出预测,结果易于理解,使用和解释,CART算法采用经济学中的基尼系数(Gini Index)作为选择最佳测试变量的准则.张晓娟等对阿坝州若尔盖县使用多时相SPOT4及ETM遥感数据,决策树算法分类精度达到96%,MLC整体分类精度为84%,但是针对乔木亚类MLC的分类精度比决策树算法要高[26].徐军等以TM遥感影像为研究数据源,利用CART决策树算法,结合光谱信息和纹理信息进行林业地类的分类,并与MLC进行比较,结果表明,决策树总分类精度为83.53%,MLC总分类精度为72.42% [11].

3.2 多角度影像分类流程

分类算法使用的软件环境分别是:(1)ENVI[27]软件实现的MLC;(2)See 5[28]软件实现的C 5.0;(3)Weka[29]软件实现的CART,J48,Random Forest和LMT.
分类程序首先使用不同的分类法分别对各个数据集中的训练集进行训练,不同分类法的主要参数的设定原则是使测试集的总体精度最大,然后使用获得的分类规则对测试集数据进行分类,分别计算混淆矩阵,总体精度和kappa系数.

4 基于决策树的遥感影像分类与制图

4.1 测试集分类结果

利用从训练数据集中获取的决策树分类规则,对测试集进行分类,结果如表4-6所示.
Tab.4 The comparison of classification results between the Nadir datasets and multi-angle datasets

表4 天底角观测数据集与多角度观测数据集的分类结果比较

分类算法 Nadir Nadir plus ABCD Red and Nir
总体精度 kappa系数 总体精度 kappa系数
MLC 0.6505 0.5260 0.7046 0.6020
CART 0.6935 0.5556 0.7261 0.6097
J48 0.6845 0.5522 0.7476 0.6426
C 5.0 0.7270 0.6089 0.8160 0.7359
RF 0.7323 0.6151 0.8114 0.7287
LMT 0.7025 0.5729 0.7649 0.6664
Tab. 5 The comparison of classification results between the Nadir plus Nir and the Nadir plus red multi-angle datasets

表5 天顶角观测与多角度观测的红光和近红外组合数据集的分类结果比较

分类算法 Nadir plus ABCD Nir Nadir plus ABCD Red
总体精度 kappa系数 总体精度 kappa系数
MLC 0.6706 0.5566 0.6893 0.5858
CART 0.7323 0.6208 0.6942 0.5623
J48 0.7406 0.6300 0.7011 0.5739
C 5.0 0.8110 0.7301 0.7570 0.6504
RF 0.8336 0.7617 0.7718 0.6695
LMT 0.7469 0.6409 0.7483 0.6420
Tab.6 The comparison of classification results between Nir and red multi-angle datasets

表6 红光和近红外波段多角度数据集的分类比较

分类算法 Nadir Nir plus ABCD Nir Nadir Red plus ABCD Red
总体精度 kappa系数 总体精度 kappa系数
MLC 0.5804 0.4473 0.6144 0.4986
CART 0.7517 0.6487 0.6609 0.5061
J48 0.7469 0.6430 0.6616 0.5206
C 5.0 0.8150 0.7349 0.7290 0.6106
RF 0.8218 0.7452 0.7531 0.6425
LMT 0.6498 0.4961 0.7004 0.5696
据以上数据分析发现:
(1)在6个数据集的分类结果中,分类精度最高的2个分类法是随机森林和C 5.0,分类精度最低的是MLC法.随机森林的最高精度是0.8336,C 5.0的最高精度是0.816,而MLC的的最高总体精度仅是0.7046.
(2)在天底角观测的基础上,无论增加多角度观测的红光还是近红外波段,所有分类器的总体分类精度都在增加.例如,MLC法使用Nadir数据集时精度为0.6505,使用多角度数据集时精度最大为0.7046;随机森林使用Nadir数据集时精度为0.7323,使用多角度数据集时精度最大为0.8336.
(3)与使用红光数据集相比,使用近红外数据集的决策树分类器(除LMT外)能获得更高的分类精度.
(4) 除了随机森林,其他分类器都在使用"Nadir plus ABCD Red and Nir"数据集时获得了最大分类精度.

4.2 混淆矩阵比较

为了分析不同观测角度下土地覆被类型的分类效果,下面列举分类精度最高的随机森林,对比其分别使用天底角(表7)和多角度(表8)数据集分类得到的混淆矩阵.综合分析如下:
Tab.7 Confusion matrix of the random forest classification with Nadir dataset

表7 随机森林使用Nadir数据集分类的混淆矩阵

类型 灌木 林地 水体 未利用地 耕地 草地 总数 用户精度
灌木 505 82 0 27 1 8 623 0.8106
林地 156 208 0 8 0 6 378 0.5503
水体 1 0 34 0 0 0 35 0.9714
未利用地 52 10 0 151 0 4 217 0.6959
耕地 1 0 0 1 129 0 131 0.9847
草地 14 7 0 6 2 29 58 0.5000
总数 729 307 34 193 132 47 1442
生产者精度 0.6927 0.6775 1.0000 0.7824 0.9773 0.6170 0.7323
Tab.8 Confusion matrix of the random forest classification with "Nadir plus ABCD Nir" dataset

表8 随机森林使用"Nadir plus ABCD Nir"数据集分类的混淆矩阵

类型 灌木 林地 水体 未利用地 耕地 草地 总数 用户精度
灌木 550 53 0 17 0 3 623 0.8828
林地 93 280 0 5 0 0 378 0.7407
水体 1 0 34 0 0 0 35 0.9714
未利用地 44 2 0 170 0 1 217 0.7834
耕地 2 0 0 0 129 0 131 0.9847
草地 8 7 0 4 0 39 58 0.6724
总数 698 342 34 196 129 43 1442
生产者
精度
0.7880 0.8187 1.0000 0.8673 1.0000 0.9070 0.8336
(1) 在天底角观测的情况下,灌木,水体和耕地的用户精度较高.林地,未利用地和草地的用户精度较低.
(2) 使用了多角度观测数据集以后,水体和耕地的用户精度前后没有变化.灌木的用户精度从0.8106变为0.8828,提高了8.9%;原来用户精度较低的林地,未利用地和草地类型的用户精度则产生了很大的提升,林地类型从0.5503变为0.7407,提高了34.6%;未利用地类型从0.6959变为0.7834,提高了12.57%;草地类型从0.5变为0.6724,提高了34.48%.

4.3 多角度影像成图

依据从训练集提取的分类规则,分别使用随机森林和C 5.0法对整个研究区进行分类得到的土地利用覆被图(图2).
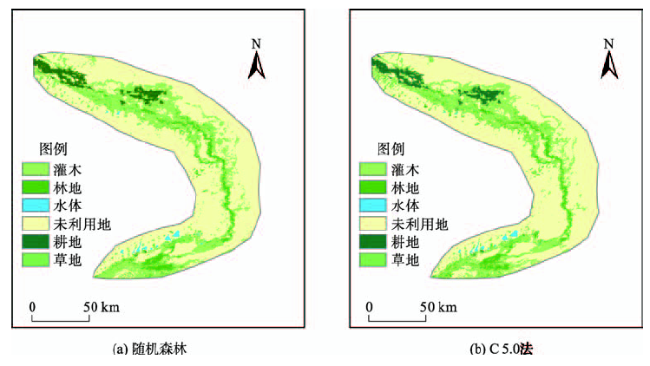
Fig. 2 Classification map obtained by random forest and C 5.0

图2 随机森林和C 5.0法的分类结果

5 结论

(1)在所有的6个数据集分类测试中,决策树的分类效果都显著优于传统的MLC.随机森林在5个数据集的测试中都获得最高的分类精度.C 5.0总体的分类效果略弱于随机森林,其他决策树分类器的分类能力也明显高于MLC,说明近年来兴起的机器学习法拥有巨大潜力.另外,相比天底角垂直观测,当使用多角度数据时,MLC法的总体分类精度最多提高了8.31%,决策树方法则提高更多.随机森林的总体分类精度最多提高了13.83%;C 5.0的总体分类精度最多提高了12.24%.这说明决策树相比MLC能更有效地利用多角度数据,挖掘其中的有效信息.
(2)当使用多角度观测后,灌木,林地,未利用地和草地类型的用户分类精度得到很大的提高.例如,随机森林法使用"Nadir plus ABCD Nir"数据集分类,与仅使用Nadir数据集分类,林地类型用户精度从0.5503变为0.7407,提高了34.6%;未利用地类型从0.6959变为0.7834,提高了12.57%;草地类型从0.5变为0.6724,提高了34.48%.分析原因如下:塔河下游地表覆盖度普遍较低,低覆盖度的草地,林地和灌木在垂直观测时由于受到土壤背景的影响难以区分.当使用多角度观测后,不同覆被类型空间结构的差异性导致的反射差异就变得明显,说明多角度遥感能更有效地反映地物的反射异质性信息.在干旱区地表植被覆盖度低,土壤背景干扰强烈的环境下,对改善地物识别有良好的作用.
(3)4种决策树分类器(CART,J48,C 5.0,RF)对近红外数据集的分类效果,都明显好于红光数据集.考虑到这是在除AN相机外,其他相机近红外波段分辨率远远小于红光波段分辨率的情况下,说明近红外波段比红光波段能提供更多地物的反射异质性信息.
致谢:感谢NASA Langley研究中心大气科学数据中心提供的MISR数据.

The authors have declared that no competing interests exist.

[1]
张增祥. 中国土地覆盖遥感监测[M].北京:星球地图出版社,2010.

[ Zhang Z X.China land cover remote sensing monitoring[M]. Beijing: Star Map Press, 2010. ]

[2]
Diner D J, Beckert J C, Reilly T H, et al.Multi-angle Imaging Spectroradiometer (MISR) instrument description and experiment overview[C]. IEEE Transactions On Geoscience And Remote Sensing, 1998.

[3]
Su L, Chopping M J, Rango A, et al.Differentiation of semi-arid vegetation types based on multi-angular observations from Misr and Modis[J]. International Journal of Remote Sensing, 2007,28:1419-1424.Not Available

DOI

[4]
Xavier A S, Galvão L S.View angle effects on the discrimination of selected Amazonian land cover types from a principal-component analysis of Misr spectra[J]. International Journal of Remote Sensing, 2005,26:3797-3811.Not Available

DOI

[5]
Liesenberg V, Galvão L S, Ponzoni F J.Variations in reflectance with seasonality and viewing geometry: Implications for classification of Brazilian Savanna physiognomies with Misr/Terra data[J]. Remote Sensing of Environment, 2007,107:276-286.Bidirectional Reflectance Factor (BRF) data, collected at nine view angles, four bands and six dates by the Multi-angle Imaging SpectroRadiometer (MISR), were used to characterize the seasonality and viewing geometry effects on the discrimination of five selected physiognomies of a specific Brazilian savanna environment. Spectral–angular profiles for each physiognomy (Seasonal, Dry and Pluvial Forests; Arboreous and Park Savanna) were obtained from nadir-normalized BRF data at each MISR band and date of image acquisition. The maximum likelihood classification technique was applied at each camera and date using a common set of pixels as training samples. A reference map was used as ground truth to obtain the classification accuracy for each physiognomy, view angle and date. Results showed that the surface anisotropy signatures of the savanna physiognomies were not unique and varied with Sun-view geometry and seasonality. Directional effects increased from data collected in the orthogonal plane to those acquired close to the solar principal plane, and with increasing Sun zenith angles. Such effects were also affected by seasonality due to differences in the dynamics of the vegetation response to precipitation, as indicated by the Fraction of Photosynthetically Active Radiation (FPAR) and Leaf Area Index (LAI) values. Dry Forest presented a faster rate of “green-up” in the beginning of the rainy season and more abrupt changes in LAI values earlier in the dry season than the other physiognomies. In relation to the nadir response, the strongest anisotropy was observed in the backward scattering direction and in the red band at large Sun zenith angles. Directional effects were also observed after the Normalized Difference Vegetation Index (NDVI) determination. Classification accuracy of vegetation improved from the rainy to the dry season. The exception was Park Savanna, which was also well discriminated from the other physiognomies in the beginning of the rainy season due to the spectral effects of non-photosynthetic vegetation (dry grass understore) that produced an increase in the red reflectance. In general, classification accuracy of the physiognomies improved also from the forward to the backward scattering direction. The best view angles for classification purposes ranged from 0° (nadir) to 610245.6°, and were associated with viewing directions of maximum backscattering at the different dates. In comparison with single view direction results, the use of Anisotropy Index (ANIX) images produced a general decrease in classification accuracy values. Results indicated that off-nadir viewing can improve discrimination and mapping of major physiognomies in the Brazilian savanna environment.

DOI

[6]
Richards J A, Jia X.Remote sensing digital image analysis: an introduction[M].Berlin: Springer, 1999.

[7]
Quinlan J R.Simplifying decision trees[J]. International Journal of Man-Machine Studies, 1987,27(3):221-234.Many systems have been developed for constructing decision trees from collections of examples. Although the decision trees generated by these methods are accurate and efficient, they often suffer the disadvantage of excessive complexity and are therefore incomprehensible to experts. It is questionable whether opaque structures of this kind can be described as knowledge, no matter how well they function. This paper discusses techniques for simplifying decision trees while retaining their accuracy. Four methods are described, illustrated, and compared on a test-bed of decision trees from a variety of domains.

DOI

[8]
刘勇洪,牛铮,王长耀.基于MODIS 数据的决策树分类方法研究与应用[J].遥感学报,2005,9(4):405-412.介绍了目前国际上流行的两种决策树算法―――CART算法与C4?5算法,并引入了两种机器学习领域里的分类新技术―――boosting和bagging技术,为探究这些决策树分类算法与新技术在遥感影像分类方面的潜力,以中国华北地区MODIS250m分辨率影像进行了土地覆盖决策树分类试验与分析。研究结果表明决策树在满足充分训练样本的条件下,相对于传统方法如最大似然法(MLC)能明显提高分类精度,而在样本量不足下决策树分类表现差于MLC;并发现在单一决策树生成中,分类回归树CART算法表现较C4?5算法具有分类精度和树结构优势,分类精度的提高取决于树结构的合理构建与剪枝处理;另外在决策树CART中引入boosting技术,能明显提高那些较难识别类别的分类准确率18?5%到25?6%。

DOI

[ Liu Y H, Niu Z, Wang C Y.Research and application of the decision tree classification using MODIS data[J]. Journal of Remote Sensing, 2005,9(4):405-412. ]

[9]
齐红超,祁元,徐瑱.基于C5.0决策树算法的西北干旱区土地覆盖分类研究——以甘肃省武威市为例[J].遥感技术与应用,2009,24(5):648-653.<p>西北干旱区面积广阔,由于土地利用类型多样,成因复杂,对环境变化敏感、变化过程快、幅度大、景观差异明显等特点,在影像上表现出的&ldquo;同物异谱&rdquo;现象明显 |利用常规目视解译、监督非监督分类、人工参与的决策树分类等方法在效率或精度等方面各有其缺陷。采用机器学习C5.0决策树算法,综合利用地物波谱、NDVI、TC、纹理等信息,根据样本数据自动挖掘分类规则并对整个研究区进行地物分类。机器学习的决策树可以挖掘出更多的分类规则,C5.0算法对采样数据的分布没有要求,可以处理离散和连续数据,生成的规则易于理解,分类精度高,可以满足西北干旱区大面积的土地利用/覆被变化制图的需要。</p>

[ Qi H C, Qi Y, Xu Z.The study of the northwest arid zone land-cover classification based on C5.0 decision tree algorithm at Wuwei city, Gansu Province[J]. Remote Sensing Technology and Application, 2009,24(5):648-653. ]

[10]
申文明,王文杰,罗江海,等.基于决策树分类技术的遥感影像分类方法研究[J].遥感技术与应用,2007,22(3):333-338.<p>以河北唐山为研究区,应用Landsat ETM+影像数据和GIS数据,对决策树分类技术和传统计算机自动分类方法进行了比较。研究表明:决策树与传统自动分类方法相比,分类精度提高了18.29%,Kappa系数提高0.1878。在地形起伏的山区,应用DEM及其衍生数据等GIS数据作为辅助数据可以提高分类精度19.52%,Kappa系数提高0.281;反射率影像分类效果比原始DN值影像的分类效果好,分类精度提高15.86%;缨帽变换在压缩数据量的同时,分类精度有所降低。</p>

[ Shen W M, Wang W J, Luo J H, et al.Classification methods of remote sensing image based on decision tree technologies[J]. Remote Sensing Technology and Application, 2007,22(3):333-338. ]

[11]
徐军,谭莹,郑云峰.基于CART 决策树技术的林业地类遥感影像分类研究[J].华东森林经理,2011(4):79-84.以Landsat TM遥感影像为研究数据源,利用CART决策树算法,结合光谱信息和纹理信息进行林业地类的分类,并把获得的结果与传统的最大似然法分类进行比较,结果表 明:在卫星影像的整体分类精度上,决策树分类技术要优于最大似然法。相对于最大似然分类,决策树的树状分类结构对数据特征空间分布不需要预先假设某种参数 化密度分布,所以其总体分类精度优于传统的参数化分类精度。

DOI

[ Xu J, Tan Y, Zheng Y F.Remote sensing image classification of forest based on CART decision tree method[J]. East China Forest Management, 2011,4:79-84.]

[12]
Diner D J, Martonchik J V, Borel C, et al. Multi-angle imaging spectro-radiometer level 2 surface retrieval algorithm theoretical basis document[EB/OL]. , 2010-8-5.

[13]
Su L, Chopping M J.Differentiation of semi-arid vegetation types based on multi-angular observations from Misr And Modis[J]. International Journal of Remote Sensing, 2007,28(6):1419-1424.Not Available

DOI

[14]
Heiskanen J.Tree cover and height estimation in the Fennoscandian tundra-taiga transition zone using multiangular MISR data[J]. Remote Sensing of Environment, 2006,103(1):97-114.The tundra–taiga transition zone stretches around the northern hemisphere separating boreal forest to the south from treeless tundra to the north. Tree cover and height are important variables to characterize this vegetation transition. Accurate continuous fields of tree cover and height would enable the delineation of the forest extent according to different criterion and provide useful data for change detection of this climatically sensitive ecotone. This study examined if multiangular remote sensing data has potential to improve the accuracy of the tree cover and height estimates in relation to nadir-view data. The satellite data consisted of Multi-angle Imaging SpectroRadiometer (MISR) data at 275m and 1.1km resolutions. The study area was located in the Fennoscandian tundra–taiga transition zone, in northernmost Finland. The continuous fields of tree cover and height were estimated using neural networks, which were trained and assessed by high-resolution biotope inventory data. The spectral–angular data together produced lower estimation errors than single band nadir, multispectral nadir or single band multiangular data alone. RMSE of the tree cover estimates reduced from 7.8% (relative RMSE 67.4%) to 6.5% (56.1%) at 275m resolution, and from 5.4% (49.2%) to 4.1% (36.9%) at 1.1km resolution, when multispectral nadir data were used together with multiangular data. RMSE of the tree height estimates reduced from 2.3m (44.3%) to 2.0m (37.6%) and from 1.8m (35.4%) to 1.3m (25.4%), respectively. The largest estimation errors occurred in mires and in areas of dense shrub cover, but the use of multiangular data also reduced estimation errors in these areas. The results suggest that directional information has potential to improve the tree cover and height estimates, and hence the accuracy of the land cover change detection in the tundra–taiga transition zone.

DOI

[15]
Quinlan J R.C4.5: Programs for Machine Learning[M]. San Mateo, CA: Morgan Kaufmann, 1993.

[16]
Breiman L.Random forests[J]. Machine Learning, 2001,45:5-32.lt;a name="Abs1"></a>Random forests are a combination of tree predictors such that each tree depends on the values of a random vector sampled independently and with the same distribution for all trees in the forest. The generalization error for forests converges a.s. to a limit as the number of trees in the forest becomes large. The generalization error of a forest of tree classifiers depends on the strength of the individual trees in the forest and the correlation between them. Using a random selection of features to split each node yields error rates that compare favorably to Adaboost (Y. Freund &amp; R. Schapire, <i>Machine Learning</i>: <i>Proceedings of the Thirteenth International conference</i> ***, 148&#x2013;156), but are more robust with respect to noise. Internal estimates monitor error, strength, and correlation and these are used to show the response to increasing the number of features used in the splitting. Internal estimates are also used to measure variable importance. These ideas are also applicable to regression.

DOI

[17]
Landwehr N, Hall M, Frank E.Logistic model trees[C]. Proceedings of the 14th European Conference on Machine Learning, 2003.

[18]
Quinlan J R.Improved use of continuous attributes in C4.5[J]. Journal of Artificial Intelligence Research, 1996,4:77-90.Abstract: A reported weakness of C4.5 in domains with continuous attributes is addressed by modifying the formation and evaluation of tests on continuous attributes. An MDL-inspired penalty is applied to such tests, eliminating some of them from consideration and altering the relative desirability of all tests. Empirical trials show that the modifications lead to smaller decision trees with higher predictive accuracies. Results also confirm that a new version of C4.5 incorporating these changes is superior to recent approaches that use global discretization and that construct small trees with multi-interval splits.

DOI

[19]
Breiman L, Friedman J H, Olshen R A, et al.Classification and Regression Trees[M]. Monterey, CA: Wadsworth & Brooks/Cole Advanced Books & Software, 1984.

[20]
史泽鹏,马中文,马友华,等.基于J48决策树算法的遥感土地利用变化分析[J].遥感信息,2014,29(1):78-85.在遥感和GIS技术的支持下,运用WEKA的J48决策树算法和 监督分类的最大似然法对肥东县3期ETM+影像进行分类,提取土地利用信息,构建了土地利用类型转换矩阵,从主地利用类型的数量、结构和程度3个方面对肥 东县土地利用变化进行分析.研究表明,前一种分类方法的精度较高;肥东县2000年~2011年建设用地面积呈上升趋势且变化最大,耕地、林地、草地、水 域、未利用地均呈减少趋势,土地利用变化速度和综合程度越来越快.

DOI

[ Shi Z P, Ma Z W, Ma Y H, et al.Land use change of remote sensing based on J48 decision tree algorithm[J]. Remote Sensing Information, 2014,29(1):78-85. ]

[21]
陈绍杰,李光丽,张伟,等.基于多分类器集成的煤矿区土地利用遥感分类[J].中国矿业大学学报,2011,40(2):273-278.针对不同分类器在遥感影像分类 中的应用效果,将模式识别领域的研究热点———多分类器集成,引入煤矿区土地利用遥感分类.分别以国外Landsat ETM+和国产中巴地球资源卫星(CBERS)影像为数据源,按照煤矿区土地利用分类的特点和需求,构建由支持向量机、径向基神经网络、最大似然分类器、 最小距离(马氏距离)分类器、J48决策树等组成的分类器集合,基于Double Fault,WCEC,Kappa等差异性测量指标选择成员分类器,利用Bagging,Boosting、加权投票法、分类器动态选择法、分层组合分类 器等分类器集成方法实现组合成员分类器输出,获得集成不同分类器优势的分类结果.试验表明:多分类器集成能够有效地提高土地利用分类精度,在煤矿区土地动 态监测和生态环境分析领域具有广泛应用前景.

[ Chen S J, Li G L, Zhang W, et al.Land use classification in coal mining area using remote sensing images based on multiple classifier combination[J]. Journal of China University Of Mining & Technology, 2011,40(2):273-278. ]

[22]
Breiman L.Random forests[J]. Machine Learning, 2001,45:5-32.lt;a name="Abs1"></a>Random forests are a combination of tree predictors such that each tree depends on the values of a random vector sampled independently and with the same distribution for all trees in the forest. The generalization error for forests converges a.s. to a limit as the number of trees in the forest becomes large. The generalization error of a forest of tree classifiers depends on the strength of the individual trees in the forest and the correlation between them. Using a random selection of features to split each node yields error rates that compare favorably to Adaboost (Y. Freund &amp; R. Schapire, <i>Machine Learning</i>: <i>Proceedings of the Thirteenth International conference</i> ***, 148&#x2013;156), but are more robust with respect to noise. Internal estimates monitor error, strength, and correlation and these are used to show the response to increasing the number of features used in the splitting. Internal estimates are also used to measure variable importance. These ideas are also applicable to regression.

DOI

[23]
Jay S, Lawrence R, Repasky K, et al.Invasive species mapping using low cost hyper spectral imagery[C]. Asprs 2009 Annual Conference, 2009.

[24]
Waske B, Heinzel V, Braun M, et al.Random forests for classifying multi-temporal Sar data[C]. Proceedings of the Envisat Symposium, 2007:23-27.

[25]
Breiman L, Friedman J H, Olshen R A, et al.Classification and Regression Trees[M]. Monterey, CA: Wadsworth & Brooks/Cole Advanced Books & Software, 1984.

[26]
张晓娟,杨英健,盖利亚,等.基于CART决策树与最大似然比法的植被分类方法研究[J].遥感技术与应用,2010,25(1):88-92.结合阿坝若尔盖县大骨节病典型 病区植被分布特点,选用不同时相SPOT4及ETM遥感数据,提出了将较易实现的CART决策树算法与最大似然比分类法有机结合在一起进行植被分类的方 法。决策树算法能很好地区分植被大类,分类精度达到96%,但是无法确定区分乔木亚类的阈值;最大似然比法整体分类精度不高,仅为84%,但是针对乔木亚 类的分类精度能达到94%,将两种算法综合利用,最终总分类精度达到95.05%,Kappa系数达到0.9016。良好的分类结果不但为研究该区植被覆 盖状况与发病率关系提供了很好的一手资料,并且分类算法较易实现,尤其对于新入门者较为实用和快捷。

DOI

[ Zhang X J, Yang Y J, Gai L Y, et al.Research on vegetation classification method based on combined decision tree algorithm and maximum likelihood ratio[J]. Remote Sensing Technology and Application , 2010,25(1):88-92. ]

[27]
Exelis. ENVI Homepage[EB/OL]. , 2014-10-1.

[28]
Quinlan J R. See5 Manual[EB/OL]. , 2010-5-10.

[29]
Machine Learning Group at the University of Waikato. WEKA Homepage[EB/OL]. , 2013-3-28.

文章导航

/