金钟山国家级自然保护区黑颈长尾雉生境适宜性评价

  • 刘慧明 ,
  • 刘晓曼 , * ,
  • 王昌佐 ,
  • 王桥
展开
  • 环境保护部卫星环境应用中心,北京 100094
*通讯作者:刘晓曼(1979- ),女,湖北宜昌人,高级工程师,研究方向为生态遥感。E-mail: showma79@163.com

作者简介:刘慧明(1982- ),女,山西临县人,高级工程师,研究方向为生态遥感。E-mail:

收稿日期: 2015-08-03

  要求修回日期: 2015-09-14

  网络出版日期: 2016-04-19

基金资助

国家科技支撑计划项目“生物多样性保护与濒危物种保育技术研究及示范”(2012BAC01B00)

Assessment and Conservation Strategy on Habitat Suitability of Syrmaticus humiae in Jinzhongshan National Nature Reserve

  • LIU Huiming ,
  • LIU Xiaoman , * ,
  • WANG Changzuo ,
  • WANG Qiao
Expand
  • Satellite Environment Center, Ministry to Environmental Protection, Beijing 100094, China
*Corresponding author: LIU Xiaoman, E-mail:

Received date: 2015-08-03

  Request revised date: 2015-09-14

  Online published: 2016-04-19

Copyright

《地球信息科学学报》编辑部 所有

摘要

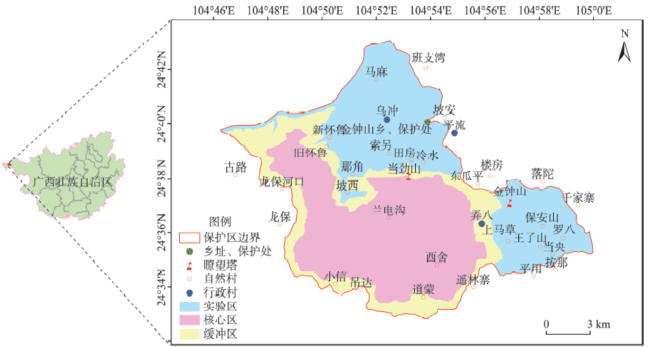
为加强对珍稀动物黑颈长尾雉(Syrmaticus humiae)的保护,本研究以广西金钟山国家级自然保护区的黑颈长尾雉野外实地调查数据为基础,在地理信息系统(GIS)技术支持下,以植被类型、植被覆盖度、海拔和坡度为评价因子,采用生境适宜性评价模型,对黑颈长尾雉潜在生境的适宜性进行了评价。研究结果表明:(1) 黑颈长尾雉最适宜的生境是海拔1000~1850 m、坡度为5~25 º、盖度大于70%的落叶阔叶林,这些区域应该成为重点保护的生境;(2) 保护区内黑颈长尾雉分布的生境类型有25种,鉴于保护的有效性和成本,选择面积占主导的15种生境类型为潜在生境,其中,54.31%的潜在生境分布在核心区内,15.75%分布在缓冲区,29.94%分布在实验区;(3) 生境适宜性评价结果表明,保护区适宜栖息生境的面积达74 km2,约占保护区总面积的36.30%。最后,基于黑颈长尾雉在金钟山自然保护区的生境适宜性研究范围提出了相应的保护对策。

本文引用格式

刘慧明 , 刘晓曼 , 王昌佐 , 王桥 . 金钟山国家级自然保护区黑颈长尾雉生境适宜性评价[J]. 地球信息科学学报, 2016 , 18(4) : 526 -536 . DOI: 10.3724/SP.J.1047.2016.00526

Abstract

To strengthen the protection of the rare animal species of Syrmaticus humiae, we assessed the habitat suitability of Syrmaticus humiae in Jinzhongshan Nature Reserve. Based on the field survey data, we selected the vegetation type, vegetation coverage, altitude and slope as the evaluation factors and built the habitat suitability model using GIS technology. The results showed that: (1) the deciduous broadleaved forest area with the altitude of 1000-1850 m, the slope of 5-25º and the vegetation coverage higher than 70% are the most suitable habitat for Syrmaticus humiae, so these areas should be taken as the key protection habitat; (2) there are a total of 25 kinds of habitat types for Syrmaticus humiae to settle, however, considering the efficiency and cost of the conservation, 15 kinds among the habitat types with bigger area are selected as the potential habitat, and 54.31% of the potential habitat is distributed in the core zone of the nature reserve, 15.75% of the potential habitat is distributed in the buffer zone, and 29.94% of the potential habitat is distributed in the experiment zone; (3) the assessment of the habitat suitability showed that the area of the suitable habitat is about 74 km2 and takes almost 36.30% of the total area of Jinzhongshan Nature Reserve. Based on the habit assessment of Syrmaticus humiae, a series of conservation strategy was proposed respectively.

1 引言

近年来动物的生境不断遭到破坏,破碎化和斑块化现象日益加重,对动物的生存繁衍造成严重影响[1-2]。研究表明,生境丧失和破碎是生物多样性降低的主要原因[3-4],因此生境保护是保护动物生存、维持生态系统生物多样性稳定的根本措施之一[5]。开展动物生境适宜性评价,是分析野生动物生存状况和导致部分物种濒危的重要手段,也能为生境保护制定合理的对策提供科学依据[6-7]。生境适宜性模型(Habitat Suitability Model)将动物分布信息与环境变量信息相结合,以评价特定物种的生境适宜性、预测潜在的适宜生境及物种的地理分布,是决策者在开展生物多样性保护、物种监测和管理中的重要工具和有效手段[8-11]
生境适宜性模型根据所需数据及原理的不同,可将其分为机理模型、回归模型和生态位模型[12-14]。机理模型根据对物种生物学和生态学长期研究的结果,分析物种的生境需求,明确影响其种群及行为的限制因素或主导因素,建立相应准则进行评价[15]。机理模型评价因子的选择和评价标准的制定都是以物种生物学、生态学研究结果为依据,根据物种的生境要求而选择。机理模型的局限性在于物种的生境选择行为难以研究清楚,且没有考虑生境的可达性[16]。回归模型是以物种出现频率或是否出现(1/0)为因变量[17-18],以各种生境因子为自变量,通过回归分析建立物种反应与环境变量之间的关系,据此来评价和预测物种的生境[19]。回归模型有很多种,常用的有广义加法模型(Generalized Additive Model)和逻辑回归模型(Logistic Regression Model)。但是,回归模型对数据要求较高,要求详细的物种调查数据。在野外调查中,物种出现或者没有出现的样点很难确定,所以,获取物种有无出现的数据比较困难,进而影响了模型的应用。生态位模型是继机理模型和回归模型之后的一种新的生境预测模型,只需要物种出现点和环境变量就能对整个研究区的物种生境进行预测[20]。常用的生态位模型有基于主成分分析的生态位因子分析模型ENFA[21]和最大墒原理的Maxent模型[22]。生态位模型结果充分体现物种的生境利用与生境因子之间的关系[21],在生境评价与生境预测中得到广泛应用。但是,也有学者认为已知分布资料往往存在偏倚性,难以保证所有的区域都有足够的考察样点,因此并不能反映出全部的适宜生境分布区,导致生态位模型预测的结果出现较大的偏差[23]。综上所述,不同的模型各有优缺点,在利用模型进行生境适宜性评价时应根据数据的特点选择模型,这样才能发挥模型的优点,得到可靠的生境适宜性评价结果,为野生动物的保护提供有力的技术支持。
黑颈长尾雉(Syrmaticus humiae)属于鸡形目鸟类,是杂食性鸟类,夏季以植物的花、果实、嫩叶芽和动物性食物为主,其他3个季节以壳斗科和裸子植物的种子为主要食物[24],栖息地的主要植被类型是常绿阔叶林、常绿阔叶与落叶阔叶混交林、落叶阔叶林、针阔混交林、针叶林,典型生境是1200~1300 m开阔的以壳斗科植物或松树为优势的森林[25-26],分布于印度东北部、缅甸北部、泰国西北部及中国的广西西部和云南的中、西部地区,为濒危物种[27-28],是国家一级重点保护动物。由于黑颈长尾雉数量少,分布范围狭窄,被列入国际濒危物种贸易公约附录Ⅰ(AppendixⅠof the Convention on International Trade in Endangered Species of Wild Fauna and Flora),IUCN出版的红皮书将其列入稀有种[29]。金钟山国家级自然保护区内黑颈长尾雉种群不仅位于该物种分布区的边缘,而且其原生性、分布数量为世界少有,在遗传多样性保护方面具有重要意义。本文以分布于广西自治区金钟山国家级自然保护区内的黑颈长尾雉为研究对象,构建生境适宜性评价模型,对其潜在生境适宜性进行评价,旨在研究黑颈长尾雉的生境质量,为黑颈长尾雉的保护提供参考,同时也为其它物种的保护提供借鉴。

2 研究区地理环境与数据预处理

2.1 保护区地理环境

金钟山国家级自然保护区位于广西壮族自治区西部(东经104º46′13″~105º00′06″,北纬24º32′44″~24º43′07″),云贵高原南缘,是黑颈长尾雉的重要栖息地(图1)。保护区内地形复杂,地势陡峭,海拔在1200 m以上面积约占85%,金钟山顶峰最高点海拔1836 m,最低处海拔780 m,相对高差1056 m。山体坡度一般在25°以上,整体地势东南高,西北低。保护区在气候带上处于南亚热带西部,受西南季风以及来自云南高原焚风影响,具有干湿季明显的特点,年平均气温18.3 ℃,年降雨量1200 mm。保护区位于中国动物地理区的华南区、西南区和华中区这3大区的交界处,是云贵高原与广西丘陵之间物种扩散交流的重要通道,生物种类丰富,成为滇黔桂交界地带生物多样性最丰富的地区之一。
Fig. 1 The geographical distribution of Jinzhongshan Nature Reserve

图1 金钟山自然保护区地理分布

2.2 数据预处理

在搜集金钟山自然保护区管理局2008-2011年物种巡查监测记录、社会经济发展等资料的基础上,通过野外调查,以野外样方、沿途调查咨询等方式了解当地情况,包括物种生境分布、周边植被气候地形条件、巢址、食物源、当地自然灾害和人为干扰活动等,为植被分类以及后续生境影响因子选取等提供参考。
根据保护区植被分布状况、地形、地势等情况,采取野外样方法,划定调查小区和设计调查路线,在确定采样方式的基础上,结合环境卫星和TM影像的分辨率,设置样方大小为30 m×30 m,设置15处样方点。每个样方具体调查的内容包括植被类型、植被覆盖度、坡位、坡向、坡度、温度、海拔、土壤水分(距水源距离)、土壤类型、土壤侵蚀、距道路距离等基本数据。
首先,对保护区遥感影像进行几何精纠正、辐射校正的预处理,几何校正误差控制在1个像元以内;然后,在ERDAS环境下,利用监督分类辅以人工解译,划分该区土地覆盖类型,并通过外业调查验证分类精度。
获取研究区域内环境卫星和TM数据,经过投影转换后,首先计算归一化植被指数(Normalized Difference Vegetation Index,NDVI),如式(1)所示。
NDVI = NIR - R NIR + R (1)
式中:NIRR分别为近红外波段与红光波段的地表反射率。
利用像元二分法计算地表植被覆盖度,如式(2)所示。
Fcover = NDVI - NDV I soil NDV I veg - NDV I soil (2)
式中:Fcover表示植被覆盖度;NDVI为植被区域的归一化植被指数;NDVIveg为研究区域NDVI的最大值(或相对最大值);NDVIsoil为研究区域裸土NDVI的最小值(或相对最小值)。
通过外业调查,以目标物种的栖息地(有植被分布或动物巢址、粪便、脚印等)为中心,建立15个样方,采用照相法并利用影像阈值分割技术,数字化测量其植被覆盖度,以此平均值作为该样方的植被覆盖度。将15个样本点遥感植被类型解译和植被覆盖度反演结果,与实测值进行配对样本T检验,精度分别为90%和92%。

3 自然保护区物种生境适宜性综合 评价

3.1 生境适宜性影响因子的筛选

一般将影响野生动物生境适宜性的因子划分为:物理环境因子、生物环境因子和人类活动因子[15] 3类。鉴于该保护区位置偏僻,以HJ-1CCD数据(2011-02-25)为基础结合高分辨率卫星影像提取了该保护区内人为干扰因子,主要有城镇居民点、农田、人工设施、道路4类,保护区是目前中国天然林尚存比较完整的分布区,自然植被保存较好,人为干扰活动较少,占保护区面积的4.40%(图2表1),人类活动强度低,在本研究中暂不考虑人类活动因子。在保护区野外巡查中发现,水源距离在黑颈长尾雉分布区和未分布区差异不明显,所以,未纳入黑颈长尾雉生境适宜性影响因子。这与杨月伟 等[30-31]对白颈长尾雉的栖息地研究结果一致,主要与保护区的气候相关,保护区年降雨量充沛,能满足黑颈长尾雉的需要。
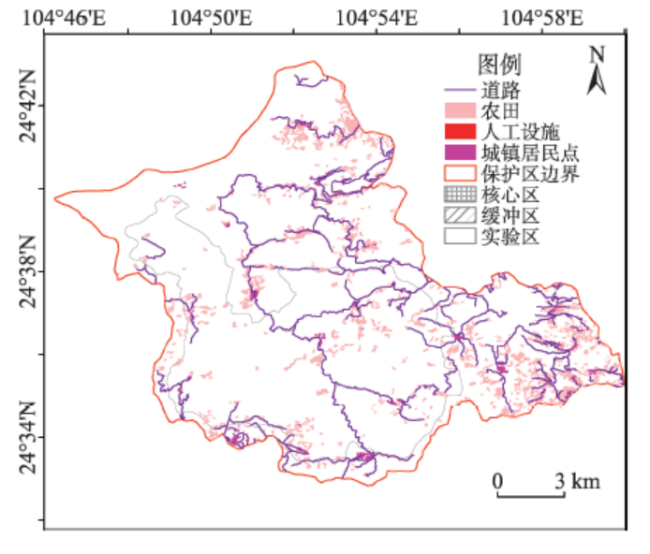
Fig. 2 Spatial pattern of the human-induced disturbance in Jinzhongshan Nature Reserve

图2 金钟山黑颈长尾雉国家自然保护区人为干扰空间分布图

Tab. 1 Statistical data of the pattern of the human-induced disturbance in Jinzhongshan Nature Reserve

表1 金钟山黒颈长尾雉国家自然保护区人为干扰统计表

核心区 缓冲区 实验区
面积/hm2 百分比/(%) 面积/hm2 百分比/(%) 面积/hm2 百分比/(%)
农田 26.64 0.14 35.72 0.19 80.83 0.39
城镇居民点 127.49 0.67 157.94 0.83 494.74 2.16
人工设施 0 0 0 0 3.60 0.02
道路 57 094 - 40 316 - 101 062 -

注:百分比为各区域内人为活动斑块面积与整个保护区的面积之比

对于物理环境因子及生物环境因子的选择,主要根据野外调查数据及前人对黑颈长尾雉分布习性和生境特点研究的相关文献[15-20]进行选择。
(1)物理环境因子:选择海拔、坡度作为反映物理环境因素的主要生境因子。
(2)生物环境因子:选择植被类型、植被覆盖度作为生物环境因子。

3.2 生境适宜性影响因子的分级

考虑生态、地理等因子对物种格局分布的影响,并参考有关文献资料[30-32],将海拔分为700~1000 m、1000~1300 m和1300~1850 m,坡度分为0~5º、5~15º、15~25º、25~35º和35~60º,植被覆盖度分为0~30%、30%~50%、50%~70%、70%~90%和>90%。为便于各因子叠加形成生境单元,将不同的海拔、坡度、植被覆盖度,以及土地覆盖类型进行编号,其中,植被类型代码为2位数,其他因子代码均为1位,对应关系见表2,这4个因子的组合代码构成了生境适宜性单元代码。
Tab. 2 Ratings and codes of habitat suitability factors

表2 各生境适宜性因子等级和代码

因子类型 分级 代码
海拔/m 700~1000 1
1000~1300 2
1300~1850 3
坡度/º <5 1
5~15 2
15~25 3
25~35 4
35~60 5
植被覆盖度 <30% 1
30%~50% 2
50%~70% 3
70%~90% 4
>90% 5
植被类型 农田和村庄 11
山顶矮林 12
常绿落叶阔叶混交林 13
常绿阔叶林 14
湿地 15
灌丛 16
竹林 17
经济林 18
草丛 19
落叶阔叶林 20
幼林地 21
针叶林 22

注:生境单位代码由5位数字组成,前3位依次分别为海拔代码、坡度代码、植被覆盖度代码,最后2位为植被类型代码,如23 420,即表示海拔位于1000~1300 m(代码为2)、坡度为15~25º(代码为3)、植被覆盖度在70%~90%之间(代码为4),以及植被类型为落叶阔叶林(代码为20)的生境单元类型

3.3 生境适宜性赋值

通过野外采样方法可对影响目标物种生境的各个因子进行测量。因此,可利用海拔、坡度、植被覆盖度、坡位等因素出现的频次作为赋值标准(以海拔因素为例):通过样方调查,将目标物种痕迹 出现频次最多的海拔阶段定为最适宜,赋值为1,其他各阶段海拔目标出现痕迹的频次与最适宜阶 段的频次相比,得出适宜性系数,计算公式如式(3)所示。
I = r ni / R ni (3)
式中:I为生境适宜度;n代表生境因子数量;r为样方中第i因素在不同海拔等生境因子出现的频次;R为样方中第i因素出现最多的频次。

3.4 评价模型的建立与评价验证

根据野外调查情况,建立如下模型对保护区目标物种潜在生境适宜性进行评价。
Sj = i = 1 n u i (4)
式中:Sj表示不同单元针对目标物种总的生境适宜性水平,以此作为该评价单元的物种生境适宜性评价依据;ui表示不同生境因子对目标物种生境适宜度赋值;n表示生境因子个数。
将海拔、坡度、植被覆盖度以及土地覆被类型4个因子叠加形成保护区生境单元,收集保护区2008-2010年黑颈长尾雉野外巡护监测数据,确定野外分布点(图3),提取该范围内的生境单元,找出面积占主导的生境单元类型,基于现有的分布点及其所对应的生境条件组合,构建物种分布-生境关系模型,并在此基础上预测物种在该保护区内的潜在生境。
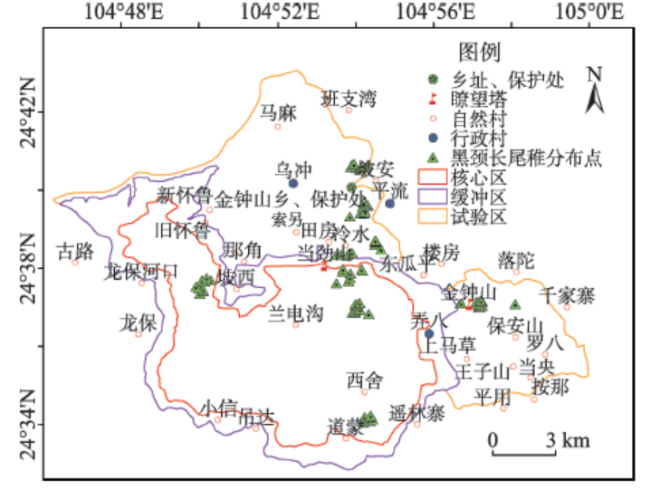
Fig. 3 The distribution points of Syrmaticus humiae in Jinzhongshan Nature Reserve

图3 金钟山自然保护区黑颈长尾雉野外分布点

针对目标物种适宜性评价结果,通过从野外调查或保护区管理处获取动物巢址、粪便、足迹等物种分布点数据,以及通过遥感监测或现场调查等植物分布数据对比予以验证,以此评价该适宜性评价结果的准确度。

3.5 适宜性评价结果分析

(1)地形因素分析
黑颈长尾雉在海拔1300~1850 m和1000~1300 m出现频率较高,说明黑颈长尾雉适宜生活于这2个海拔梯度内。海拔在1300~1850 m的区域,总面积约为60.71 km2,主要分布在保护区东部及南部;海拔在1000~1300 m的区域,总面积约101.19 km2,此区域面积较大,主要分布在核心区及实验区。海拔在700~1000 m范围内,为一般适宜,主要分布在保护区西北部(表3图4)。
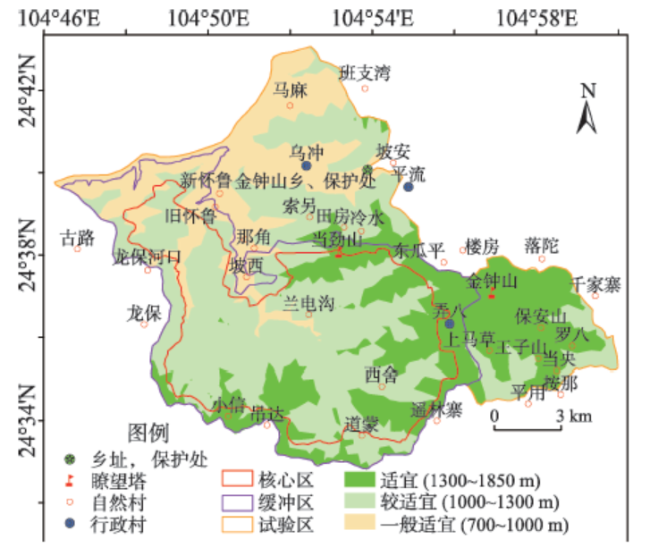
Fig. 4 Grade distribution of the habitat suitability factors (altitude) of Syrmaticus humiae in Jinzhongshan Nature Reserve

图4 金钟山自然保护区黑颈长尾雉生境适宜性因子(海拔)等级分布图

Tab. 3 Statistical table of the habitat suitability factors (altitude) of Syrmaticus humiae in Jinzhongshan Nature Reserve

表3 金钟山自然保护区黑颈长尾雉生境适宜性因子(海拔)分布统计表

代码 海拔范围/m 出现次数 出现频率/(%) 面积/km2 面积百分比/(%) 密度(出现次数/km2
1 700~1000 1 0.68 42.94 20.96 0.02
2 1000~1300 52 35.62 101.19 49.40 0.51
3 1300~1850 93 63.70 60.71 29.64 1.53
黑颈长尾雉在坡度为5~25º出现频率较高,其中在15~25º的区域出现频率达到了63%,此区域为适宜区,总面积约为110.19 km2,分布在保护区大部分地区;坡度在5~15º的区域较适宜,此区域面积约为52.41 km2;而坡度小于5°或大于25°的区域为一般适宜(表4图5)。
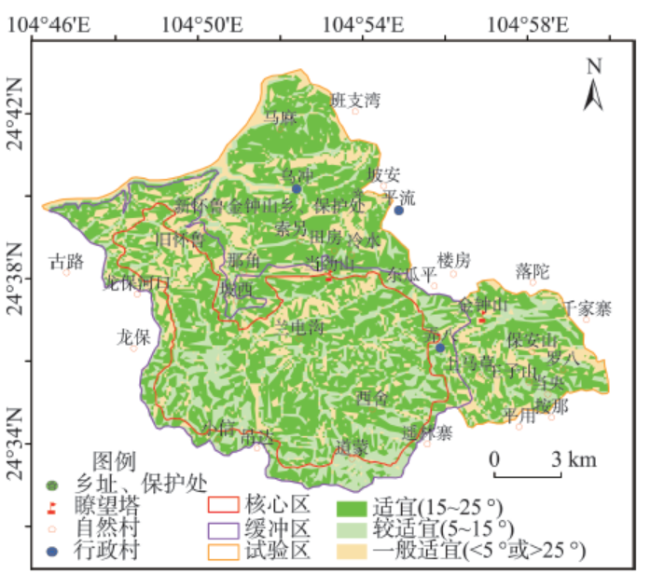
Fig. 5 Grade distribution of the habitat suitability factors (slope) of Syrmaticus humiae in Jinzhongshan Nature Reserve

图5 金钟山自然保护区黑颈长尾雉生境适宜性因子(坡度)等级分布图

Tab. 4 Statistical table of the habitat suitability factors (slope) of Syrmaticus humiae in Jinzhongshan Nature Reserve

表4 金钟山自然保护区黑颈长尾雉生境适宜性因子(坡度)分布统计表

代码 坡度/° 出现次数 出现频率/(%) 面积/km2 面积百分比/(%) 密度/(出现次数/km2
1 <5 6 4.11 7.48 3.65 0.80
2 5~15 38 26.03 52.41 25.58 0.73
3 15~25 92 63.01 110.19 53.79 0.83
4 25~35 9 6.16 33.49 16.35 0.27
5 35~60 1 0.68 1.27 0.62 0.79
(2)植被因素分析
黑颈长尾雉在落叶阔叶林中出现频率最高,此区域总面积约为93.03 km2,主要分布在核心区及缓冲区,是黑颈长尾雉适宜生活区域;其次是经济林、幼林地、常绿落叶阔叶混交林,主要位于保护区核心区东部以及实验区,总面积约55.17 km2,为较适宜区;在灌丛、常绿阔叶林、针叶林区域也有少量黑颈长尾雉分布,此区域主要分布在实验区,总面积约36.68 km2,为一般适宜区;而在山顶矮林、竹林、草丛、农田和村庄、湿地等区域未有黑颈长尾雉分布,其主要分布在保护区西部实验区,此区域不适宜黑颈长尾雉生存(表5图6)。
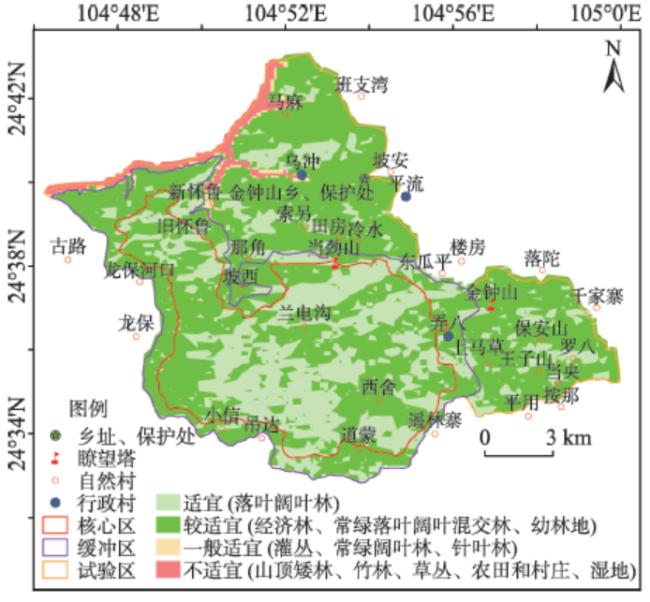
Fig. 6 Grade distribution of the habitat suitability factors (vegetation types) of Syrmaticus humiae in Jinzhongshan Nature Reserve

图6 金钟山自然保护区黑颈长尾雉生境适宜性因子(植被类型)等级分布图

Table 5 Statistical table of the habitat suitability factors (vegetation types) of Syrmaticus humiae in Jinzhongshan Nature Reserve

表5 金钟山自然保护区黑颈长尾雉生境适宜性因子(植被类型)分布统计表

代码 植被类型 出现次数 出现频率/(%) 面积/km2 面积百分比/(%) 密度(出现次数/km2
11 农田和村庄 0 0.00 1.14 0.56 0
12 山顶矮林 0 0.00 0.08 0.04 0
13 常绿落叶阔叶混交林 20 13.70 4.01 1.96 4.99
14 常绿阔叶林 5 3.42 4.54 2.21 1.10
15 湿地 0 0.00 9.32 4.55 0
16 灌丛 9 6.16 17.70 8.64 0.51
17 竹林 0 0.00 0.11 0.05 0
18 经济林 33 22.60 19.34 9.44 1.71
19 草丛 0 0.00 9.37 4.57 0
20 落叶阔叶林 52 35.62 93.03 45.40 0.56
21 幼林地 24 16.44 31.82 15.53 0.75
22 针叶林 3 2.05 14.44 7.05 0.21
黑颈长尾雉在植被覆盖度为70%~90%的区域出现频率最高,其次是覆盖度大于90%的区域,说明黑颈长尾雉适宜生活在植被覆盖度为70%~90%的区域,此类地区总面积约为143.66 km2,植被覆盖度大于90%的区域较适宜,此类地区面积约为53.09 km2,主要分布在核心区;在植被覆盖度在50%~70%的区域也有分布,此类地区为一般适宜;而植被覆盖度小于50%的地区不适宜黑颈长尾雉生存(表6图7)。
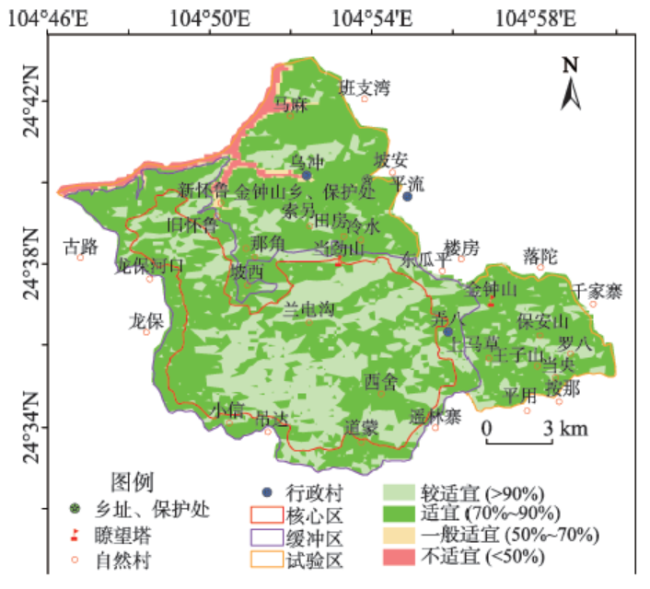
Tab. 6 Statistical table of the habitat suitability factors (vegetation coverage) of Syrmaticus humiae in Jinzhongshan Nature Reserve

表6 金钟山保护区黑颈长尾雉生境适宜性因子(植被覆盖度)分布统计表

代码 植被覆盖度/(%) 出现次数 出现频率/(%) 面积/km2 面积百分比/(%) 密度/(出现次数/km2
1 <30 0 0.00 3.08 1.51 0
2 30~50 0 0.00 2.69 1.31 0
3 5~70 1 0.68 2.37 1.16 0.42
4 70~90 81 55.48 143.66 70.12 0.56
5 >90 64 43.84 53.09 25.91 1.21
Fig. 7 Grade distribution of the habitat suitability factors (vegetation coverage) of Syrmaticus humiae in Jinzhongshan Nature Reserve

图7 金钟山自然保护区黑颈长尾雉生境适宜性因子(植被覆盖度)等级分布图

(3)潜在生境的分布
通过对海拔、坡度、植被覆盖度、植被类型等生境适宜性因子进行GIS叠加分析,构建物种-生境关系模型,提取黑颈长尾雉潜在生境单元。为更有效地保护潜在生境,同时减少过高的保护成本,选定生境面积从大到小到顺序进行累加,总和大于90%的生境单元类型为该物种的潜在生境,从而获得黑颈长尾雉潜在生境类型(图8)。表7列出了黑颈长尾雉25种类型分布生境单元中面积自大而小累加达到90%的生境类型中的前15种偏好的潜在生境类型。
通过叠加保护区功能区划,对潜在生境进一步分析。由表8可知,54.31%的潜在生境分布在核心区范围内,15.75%的潜在生境分布在缓冲区,29.94%的潜在生境分布在实验区。
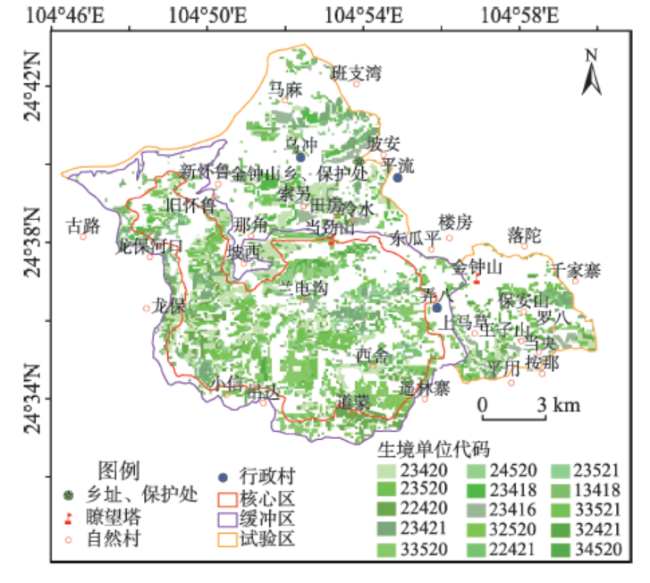
Tab. 7 The main potential habitat types and distribution of Syrmaticus humiae

表7 黑颈长尾雉主要潜在生境类型表

生境单元代码 海拔/m 坡度/(°) 植被覆盖度/(%) 植被类型 面积/hm2 比例/(%)
23420 1000~1300 15~25 70~90 落叶阔叶林 1546.29 18.49
23520 1000~1300 15~25 >90 落叶阔叶林 1102.41 13.18
22420 1000~1300 5~15 70~90 落叶阔叶林 816.48 9.76
23421 1000~1300 15~25 70~90 幼林地 672.30 8.04
33520 1300~1850 15~25 >90 落叶阔叶林 626.13 7.49
24520 1000~1300 25~35 >90 落叶阔叶林 434.16 5.19
23418 1000~1300 15~25 70~90 经济林 402.57 4.81
23416 1000~1300 15~25 70~90 灌丛 358.83 4.29
32520 1300~1850 15~25 >90 落叶阔叶林 358.02 4.28
22421 1000~1300 5~15 70~90 幼林地 295.65 3.54
23521 1000~1300 15~25 >90 幼林地 293.22 3.51
13418 700~1000 15~25 70~90 经济林 191.97 2.30
33521 1300~1850 15~25 >90 幼林地 191.16 2.29
32421 1300~1850 15~25 70~90 落叶阔叶林 165.24 1.98
34520 1300~1850 25~35 >90 落叶阔叶林 165.24 1.98
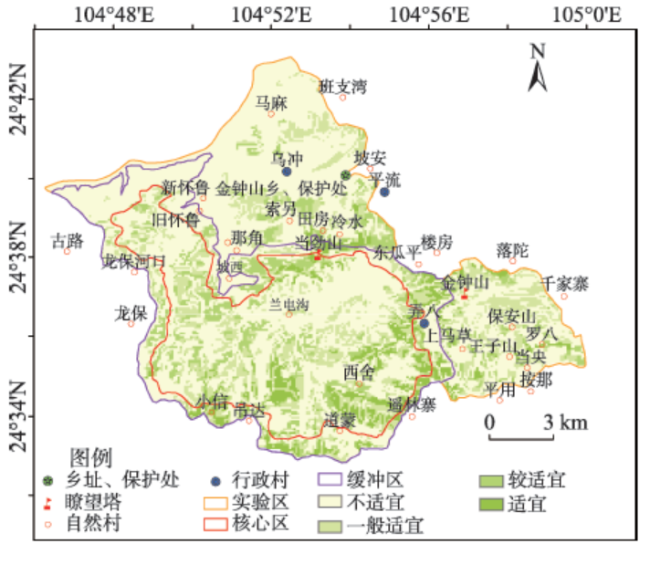
Fig. 8 Grade distribution of the potential habitat of Syrmaticus humiae in Jinzhongshan Nature Reserve

图8 金钟山自然保护区黑颈长尾雉潜在生境分布图

Tab. 8 Function zones of the potential habitat

表8 潜在生境功能分区图

功能区 潜在生境面积/hm2 面积比例/(%)
核心区 4139.14 54.31
缓冲区 1200.21 15.75
实验区 2281.67 29.94
(4)潜在生境适宜性评价与分级
选取海拔、坡度、植被类型、植被覆盖度4个生境因子构建物种生境适宜性多因子综合评价模型。在上述对保护区海拔、坡度、植被等因子适宜性分析的基础上,确定各因子适宜性等级。最后对各因子适宜等级相乘,得到保护区重点保护物种生境适宜性综合评价图(图9)。
Fig. 9 Grade distribution of the potential habitat suitability of Syrmaticus humiae in Jinzhongshan Nature Reserve

图9 金钟山自然保护区黑颈长尾雉潜在生境适宜性等级分布图

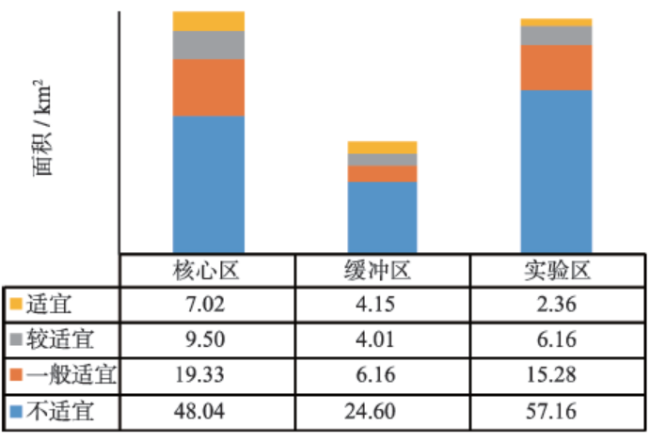
Fig. 10 Comparison diagram of the potential habitat suitability of Syrmaticus humiae in Jinzhongshan Nature Reserve

图10 金钟山自然保护区各功能区黑颈长尾雉潜在生境适宜性对比图

由评价结果可知(图10),保护区适宜生境(包括适宜、较适宜和一般适宜生境)面积达73.97 km2,约占保护区总面积的36.30%。其中适宜生境面积达13.53 km2,占保护区总面积的6.64%,主要分布在保护区中高海拔区域,如当劲山、金钟山附近,坡度较缓,大约位于15~25 °范围,以双皮栎、白栎林等落叶阔叶林和油桐林为主,植被覆盖度大于90%;较适宜生境面积达19.67 km2,占保护区总面积的9.65%,主要分布在保护区中海拔区域,植被类型以落叶栎林、油桐经济林为主,坡度平缓,植被覆盖度较高,如坡西乡的东北边;一般适宜生境面积达40.77 km2,占保护区总面积的20.01%,主要分布在保护区中高海拔区域,坡度较大,植被类型以落叶阔叶林及幼林地为主,灌丛亦有少量分布,植被覆盖度相对较低,如道蒙沟区域;不适宜区域主要分布在保护区西北侧天生桥水库周边区域,湿地区域不适宜雉类生存,保护区兰电沟乡东侧分布有大片杉木林区域,亦不适宜雉类生存。通过叠加保护区功能区划,对保护区物种潜在生境进一步分析。核心区生境(包括适宜、较适宜和一般适宜生境)面积最大,达35.85 km2,占保护区总适宜生境面积的48.47%。其中,适宜等级面积在3个功能区占比最大,占保护区适宜等级面积的51.88%;缓冲区生境面积达14.32 km2,约占保护区总适宜生境面积的19.36%,其中适宜等级面积占保护区总适宜等级面积的30.67%;实验区生境面积达23.80 km2,占保护区总适宜生境面积的32.18%,其中适宜等级面积占保护区总适宜等级面积的17.44%。

4 结论与建议

本文通过生境适宜性评价模型,对分布于广西自治区金钟山国家级自然保护区内的黑颈长尾雉潜在的生境适宜性进行了评价,得到如下结论:
(1)植被为动物提供食物以及栖息地,是影响动物生境适宜性的重要因素;地形要素能客观、真实地反映黑颈长尾雉的生物学特性及生境选择特点,可提高野生动物生境描述的准确性[9,15,20]。另外,地形间接影响了黑颈长尾雉的食物和栖息地的分布格局[7]。因此,本文中生物要素选择了植被类型、植被覆盖度,非生物要素选择了海拔、坡度等地形要素,以期能准确、客观地反映黑颈长尾雉的生境质量。
本文适宜性评价未涉及人为干扰因子,原因在于金钟山国家级自然保护区是目前中国天然林保存比较完整的区域,原始植被保存较好,且大多分布在山区,而山区主要是少数民族地区,人口稀少,大多以村屯方式散居,对森林生态系统干扰强度较小。保护区中道路较少,很难进入,而且在野外调查研究中发现黑颈长尾雉对道路、居民点等人为活动区没有明显的避退现象[33]
(2)黑颈长尾雉最适宜的生境是海拔1000~1850 m、坡度为5~25º、盖度大于70%的落叶阔叶林,是需要重点保护的生境。保护区内的黑颈长尾雉分布的生境类型有25种,但是,为了更有效地保护潜在生境,减少过高的保护成本,应选择面积占主导的15种生境类型分布区为潜在生境。黑颈长尾雉潜在生境的54.31%分布在核心区,15.75%的潜在生境分布在缓冲区,29.94%分布在实验区。生境适宜性综合评价结果表明,保护区适宜生境(包括适宜、较适宜和一般适宜生境)面积达73.97 km2,约占保护区总面积的36.30%。其中,适宜面积占保护区总面积的6.64%,较适宜面积占9.65%,一般适宜生境面积占20.01%。核心区适宜生境(包括适宜、较适宜和一般适宜生境)分布最广,占保护区总适宜生境面积的48.47%,实验区适宜生境占32.18%,缓冲区占19.36%。
(3)金钟山自然保护区是黑颈长尾雉重要的栖息地,该保护区对于黑颈长尾雉的种群保存及繁衍具有重要的意义。
为进一步加强保护黑颈长尾雉的栖息地,结合本研究对不同生境因子的分析和生境适宜性的评价,提出如下建议:
(1)海拔、植被覆盖度与黑颈长尾雉的分布点之间的相关性较坡度和植被类型更为显著(图4-7)。从图4、7可看出,海拔、植物覆盖度的生境适宜因子等级分布图中处于适合的部分虽然所占面积较小,但与目前黑颈长尾雉的分布点却较为吻合。因此,加强该范围内生境因子,尤其是植被的保护,对于提高黑颈长尾雉的生境质量具有重要的意义。
(2)分布于“当劲山”附近的种群恰好是处于植被覆盖度从70%~90%向小于70%的过渡区域,可推测在适宜的海拔范围内,植被覆盖度的过渡也预示着植被类型或群落结构的变化,而这种变化进一步丰富了黑颈长尾雉的栖息地的条件,从而使得一定居群数量的黑颈长尾雉栖息于此。
(3)历史上广西隆林县以植物覆盖度高而著称,尤其是境内的金钟山,直至20世纪50、60年代,金钟山附近的森林植被一直很好,隆林县城附近的德峨、长发等地森林植被均十分繁茂。但20世纪50、60年代的“大炼钢铁”和70年代的林权变更,致使植被一次次遭到毁坏,而且隆林县境内的“金钟山黑颈长尾雉国家级自然保护区”前身为林场[24],因此,建议相关部门进一步加强植被及生境的保护,尤其是加强植被的动态监测,这对于黑颈长尾雉的种群恢复及繁衍具有重要的意义。
致谢:野外工作得到了广西金钟山黑颈长尾雉国家级自然保护区全体工作人员的支持和帮助,在此表示感谢。

The authors have declared that no competing interests exist.

[1]
Henley S R, Ward D, Schmidt I.Habitat selection by two desert-adapted ungulates[J]. Journal of Arid Environments, 2007,70(1):39-48.Habitat selection, as a reflection of an animal's need to satisfy its life requirements was studied in two indigenous ungulates, the Asiatic wild ass ( Equus hemionus ) and dorcas gazelle ( Gazella dorcas ), under conditions of extreme aridity in the Negev desert. These ungulates had significantly different spatial distributions. The relative abundance of wild asses was positively correlated with plant species richness and the percentage cover of known forage species, and negatively correlated with the incidence of earlier browsing. There was no significant relationship between plant species distribution and habitat selection by the dorcas gazelle. It is possible, however, that the scale at which foraging opportunity was evaluated, namely the plant species level, masked habitat selection by the gazelle. Interestingly, the occurrence of dorcas gazelles was positively associated with access to perennial surface water. This is an unexpected result in a species known to be independent of free water for drinking. This result indicates, that while the gazelle can survive without free water should the need arise, it preferentially utilises habitats with access to drinking water.

DOI

[2]
刘雪华. 3S技术与中国野生动物生境评价[M].北京:中国林业出版社,2011.

[ Liu X H.3S technology and habitat assessment of wild life in China[M]. Beijing: Chinese Forestry Publishing House, 2011. ]

[3]
Laurance W F, Lovejoy T E, Vasconcelos H L.Ecosystem decay of Amazonian forest fragments: A 22-year investigation[J]. Conservation Biology, 2002,16(3):605-618.

[4]
武正军,李义明.生境破碎化对动物种群存活的影响[J].生态学报,2003,23(11):2424-2435.生境破碎是生物多样性下降的主要原因之一。通常以岛屿生物地理学、异质种群生物学和景观生态学的理论来解释不同空间尺度中生境破碎化的生态学效应。生境破碎化引起面积效应、隔离效应和边缘效应。这些效应通过影响动物种群的绝灭阈值、分布和多度、种间关系以及生态系统过程,最终影响动物种群的存活。野外研究表明,破碎化对动物的影响,因物种、生境类型和地理区域不同而有所变化,因此,预测物种在破碎生境中的存活比较困难。研究热点集中于:确定生境面积损失和生境斑块的空间格局对破碎景观中物种绝灭的相对影响,破碎景观中物种的适宜生境比例和绝灭阈值,异质种群动态以及生态系统的生态过程。随着3s技术的发展,生境破碎化模型趋于复杂,而发展有效的模型和验证模型将成为一项富有挑战性的任务。

DOI

[ Wu Z J, Li Y M.Effects of habitat fragmentation on survival of animal populations[J]. Acta Ecologica Sinica, 2003,23(11):2424-2435. ]

[5]
Boyce M S, McDonald L L. Relating populations to habitats using resource selection function[J]. Trends of in Ecology & Evolution,1999,14(7):268-272.Habitat use can be characterized by resource selection functions (RSFs) that are proportional to the probability of an area being used by an animal. We highlight two procedures that have recently been used to relate RSFs to population density, dependent upon which field procedures are practical for a species. These new developments allow RSF models to be interfaced with geographical information systems (GIS) to map the probability of use, and ultimately populations, across landscapes.

DOI PMID

[6]
Klar N, Fernández N, Kramer-Schadt S, et al.Habitat selection models for European wildcat conservation[J]. Biological Conservation, 2008,141(1):308-319.Populations of the European wildcat () are only slowly recovering in Central Europe after a severe decline in the last centuries and require specific conservation plans in many areas. However, detailed information on wildcat occurrence and habitat requirements is still scarce and controversial. We present a fine-scale habitat selection model for wildcats based on detailed species and land use information and evaluate its accuracy to predict habitat distribution in new areas. We analysed habitat use within home ranges using single locations of 12 radio-tracked individuals from south western Germany. Several competing models were fitted and compared using generalised linear mixed models (GLMM) and information-theoretic approaches. Radio-tracking data of 9 and 10 wildcats from two distant areas were used to evaluate the models. The selected model predicted habitat associated to close distance to forest, watercourses and meadows and a critical distance to villages, single houses and roads. To predict area suitable for home ranges we superimposed rules derived from home range attributes at a higher level of selection. Predictions from the combination of the fine-scale habitat model and home range rules matched well with more than 2000 wildcat observations of south-western Germany. We discuss the application of the model in wildcat conservation for finding potential reintroduction sites, identifying small isolated populations and aiding in the evaluation of the needs of mitigation and compensation within the scope of the European Habitats Directive.

DOI

[7]
林杰,徐文轩,杨维康,等.亚洲野驴生态生物学研究现状[J].生物多样性,2012,20(4):411-419.亚洲野驴为国家一级保护动物,2008年《iucn红色名录》将其列为濒危物种。自19世纪中期,由于人类活动干扰,分布区日益缩小,全球范围内亚洲野驴均处于濒危状态。为有效保护该物种,众多学者针对亚洲野驴生态生物学开展了大量研究。本文从形态描述与分类、分布与种群数量、社群和领域行为、栖息地选择、觅食生态、繁殖生态、行为时间分配与活动节律、濒危原因与保护对策等方面对亚洲野驴的研究成果进行了综述,并就亚洲野驴下一步的研究工作提出3个建议。

DOI

[ Lin J, Xu W X, Yang W K, et al.Present situation of eco-biological study on Equus hemionus[J]. Chinese Journal of Ecology, 2011,30(10):2351-2358. ]

[8]
Boyce M S, Vernier P R, Nielsen S E, et al.Evaluating resource selection functions[J]. Ecological Modeling, 2002,157(2/3):281-300.A resource selection function (RSF) is any model that yields values proportional to the probability of use of a resource unit. RSF models often are fitted using generalized linear models (GLMs) although a variety of statistical models might be used. Information criteria such as the Akaike Information Criteria (AIC) or Bayesian Information Criteria (BIC) are tools that can be useful for selecting a model from a set of biologically plausible candidates. Statistical inference procedures, such as the likelihood-ratio test, can be used to assess whether models deviate from random null models. But for most applications of RSF models, usefulness is evaluated by how well the model predicts the location of organisms on a landscape. Predictions from RSF models constructed using presence/absence (used/unused) data can be evaluated using procedures developed for logistic regression, such as confusion matrices, Kappa statistics, and Receiver Operating Characteristic (ROC) curves. However, RSF models estimated from presence/available data create unique problems for evaluating model predictions. For presence/available models we propose a form of k -fold cross validation for evaluating prediction success. This involves calculating the correlation between RSF ranks and area-adjusted frequencies for a withheld sub-sample of data. A similar approach can be applied to evaluate predictive success for out-of-sample data. Not all RSF models are robust for application in different times or different places due to ecological and behavioral variation of the target organisms.

DOI

[9]
Peterson J T, Dunham J A.Combining inferences from models of capture efficiency, detectability, and suitable habitat to classify landscapes for conservation of threatened bull trout[J]. Conservation Biology, 2003,17:1070-1077.Abstract: Effective conservation efforts for at-risk species require knowledge of the locations of existing populations. Species presence can be estimated directly by conducting field-sampling surveys or alternatively by developing predictive models. Direct surveys can be expensive and inefficient, particularly for rare and difficult-to-sample species, and models of species presence may produce biased predictions. We present a Bayesian approach that combines sampling and model-based inferences for estimating species presence. The accuracy and cost-effectiveness of this approach were compared to those of sampling surveys and predictive models for estimating the presence of the threatened bull trout ( Salvelinus confluentus ) via simulation with existing models and empirical sampling data. Simulations indicated that a sampling-only approach would be the most effective and would result in the lowest presence and absence misclassification error rates for three thresholds of detection probability. When sampling effort was considered, however, the combined approach resulted in the lowest error rates per unit of sampling effort. Hence, lower probability-of-detection thresholds can be specified with the combined approach, resulting in lower misclassification error rates and improved cost-effectiveness. Resumen: Los esfuerzos de conservaci&oacute;n efectivos para especies bajo riesgo exigen conocer la ubicaci&oacute;n de las poblaciones existentes. La presencia de una especie se puede estimar directamente por medio de muestreos a campo o mediante modelos predictivos. Los muestreos directos pueden ser costosos e ineficientes, especialmente para especies raras y dif&iacute;ciles de muestrear y los modelos que predicen la presencia de especies pueden generar predicciones sesgadas. Presentamos una aproximaci&oacute;n Bayesiana que combina el muestreo y las inferencias resultantes de modelos para estimar la presencia de especies. La precisi&oacute;n y rentabilidad de esta aproximaci&oacute;n para estimar la presencia de la especie amenazada Salvelinus confluentus se compar&oacute; con la del muestreo y de los modelos predictivos por medio de simulaci&oacute;n con modelos existentes y con datos de muestreo emp&iacute;rico. Las simulaciones indicaron que el muestreo &uacute;nicamente podr&iacute;a ser la m&aacute;s efectiva y tendr&iacute;a las menores tasas de error de clasificaci&oacute;n de presencia y ausencia para los tres umbrales de probabilidad de detecci&oacute;n. Sin embargo, cuando se consider&oacute; el esfuerzo de muestreo, la aproximaci&oacute;n combinada result&oacute; tener las menores tasas de error por unidad de muestreo. Por lo tanto, se pueden especificar umbrales menores de probabilidad de detecci&oacute;n con la aproximaci&oacute;n combinada, lo que resulta en menores tasas de error de clasificaci&oacute;n y mayor rentabilidad.

DOI

[10]
Hemami M R, Watkinson A R, Dolman P M.Habitat selection by sympatric muntjac (Muntiacus reevesi) and roe deer (Capreolus capreolus) in a lowland commercial pine forest[J]. Forest Ecology and Management, 2004,194:49-60Understanding deer habitat use is important in predictive management of increasing deer populations and in assessing the potential for inter-specific competition, particularly between native and introduced species. Habitat usage by roe deer and introduced Chinese muntjac was studied in a 1200ha study area within Thetford Forest, a commercially managed coniferous forest in Eastern England. Habitat use was related to forest growth stage and vegetation composition by pellet-group clearance transects conducted every 2 months from March 2000 to March 2001. Higher densities of roe deer were found in young plantations, while muntjac numbers were lower in open restocks and grassy areas and higher in older stands and areas with greater cover of bramble Rubus fruticosa agg. Overall, muntjac showed greater habitat selectivity than roe deer. The overlap between the two species in use of individual stands (single, even-aged management compartments) was significantly lower than overlap in use of growth stages (consisting of many individual stands), suggesting ecological partitioning at finer spatial scales. However, overlap in habitat use as measured by Pianka鈥檚 index remained substantial at both scales (mean 0.40卤0.16 S.D. for stands and 0.55卤0.11 for growth stages). Habitat overlap was greatest in winter when both species aggregate on bramble. There is, therefore, potential for exploitation competition in the event of food scarcity.

DOI

[11]
王秀磊,李迪强,吴波.青海湖东——克图地区普氏原羚生境适宜性评价[J].生物多样性,2005,13(3):213-220.普氏原羚(<i>Procapra przewalskii</i>)是我国特有珍稀濒危动物, 历史上曾分布于我国的内蒙古、甘肃、宁夏和青海等地, 现仅分布在青海湖周边地区。作者通过2002-2004年不同季节的实地调查, 在地理信息系统(GIS)的支持下, 以可食植物丰富度、坡度、隐蔽条件和人类活动等为评价因子, 采用生境评价模型, 对普氏原羚的主要分布区之一青海湖东-克图地区进行了适宜性评价。评价结果表明, 不考虑人类活动影响时普氏原羚的适宜和次适宜生境面积分别为2493.76 hm2和18 624.06 hm2, 分别占研究区总面积的8.05%和60.15%; 考虑人类活动影响时, 普氏原羚的适宜和次适宜生境面积分别减少了5.81%和33.09%, 而不适宜生境面积增加了38.90%。由于普氏原羚的生境受到居民地、道路、围栏等人类活动的强烈影响, 导致大量适宜生境丧失, 生境隔离和破碎化日益加剧, 建议重新规划保护区, 将普氏原羚的适宜生境划入保护区的核心区; 建立生境廊道, 拆除部分围栏, 以提高普氏原羚的生境质量, 促进其种群的发展。

DOI

[Wang X L, Li D Q, Wu B. Habitat suitability assessment of Przewalski’s gazelle in the Hudong- Ketu area, Qinghai, China[J]. Chinese Biodiversity, 2005,13(3):213-220.]

[12]
Store R, Jokimaki J. A GIS-based multi-scale approach to habitat suitability modeling[J]. Ecological modelling, 2003,169:l-15.The aim of this study is to develop a method by means of which it is possible to produce georeferenced ecological information about the habitat requirements of different species. The integrated habitat suitability index approach includes the steps of constructing habitat suitability models, producing data needed in models, evaluating of target areas based on habitat factors, and combining various suitability indices. The method relies on the combined use of empirical evaluation models and models based on expertise in geographical information system (GIS) environment. GIS was used to produce the data needed in the models, and as a platform to execute the models and to present the results of the analysis. Furthermore, multi-criteria evaluation methods (MCEs) provide the technical tools for modeling the expertise and for connecting (standardizing, weighting, and combining) the habitat needs of different species. The main advantages of the method were connected to possibilities to consider the habitat factors on different scales, to combine habitat suitability evaluations for several species and to weight different species in different ways, and to integrate empirical models and expert knowledge. The method is illustrated by a case study in which an integrated habitat suitability map is produced for a group of old-forest species.

DOI

[13]
王金亮,陈姚.3S技术在野生动物生境研究中的应用[J].地理与地理信息科学,2004,20(6):44-47.3S技术可快速、准确、实时地获取、处理空间信息,具有广泛的应用性。该文从野生动物生境格局、生境破碎化、生境因子特性、生境分析模型建立、生境评价和生境恢复建设等方面,综合评述野生动物生境研究中3S的应用问题,并提出野生动物生境研究将朝着3S技术集成、GIS与数学模型结合、数据可视化模拟、网络化和智能化的方向发展。

DOI

[ Wang J L, Chen Y.Applications of 3S technology in wildlife habitat researches[J]. Geography and Geo-Information Science, 2004,20(6):44-47. ]

[14]
Romero-Calcerrada R, Luque S.Habitat quality assessment using weights-of-Evidence based GIS modeling: The case of Picoides tridactylus as species indicator of the biodiversity value of the Finnish forest[J]. Ecological modelling, 2006,196:62-76.

[15]
欧阳志云,刘建国,肖寒,等.卧龙自然保护区大熊猫生境评价[J].生态学报,2001,21(11):1869-1874.生物的生境是指生物生活繁衍的 场所 ,由生物与非生物环境构成。近几个世纪以来 ,物种绝灭的速度加快 ,生物多样性丧失最重要的原因是生物生境的人为破坏。对保护生物的生境评价 ,是分析这些物种种群减少、濒危原因的重要手段 ,还能为制定合理的保护对策提供依据。根据大熊猫生境分布特点提出了大熊猫生境结构理论模型 ,将影响卧龙大熊猫生境质量的因素分为物理环境因素、生物环境因素和人类活动因素 ,探讨了生境评价的程序与卧龙大熊猫生境评价准则 ,运用地理信息系统技术与空间模拟方法分析了卧龙大熊猫生境质量。在人类活动影响下 ,卧龙自然保护区内适宜大熊猫生存的生境面积有 5 75 97.3 hm2 ,其中最适生境面积为 62 5 6.1 hm2 ,主要分布在海拔 2 3 0 0~ 2 80 0 m的平缓山坡与台地

DOI

[ Ouyang Z Y, Liu J G, Xiao H, et al.An assessment of giant panda habitat in Wolong Nature Reserve[J]. Acta Ecologica Sinica, 2001,21(11):1869-1874. ]

[16]
Dettki H, Lofstand R, Edenius L.Modeling habitat suitability for moose in coastal northern Sweden: empirical vs. process-oriented approaches[J]. AMBIO, 2003,32(8):549-556.

PMID

[17]
Boyce M S, Vernier P R, Nielsen S E, et al.Evaluating resource selection functions[J]. Ecological Modelling, 2002,157:281-300.A resource selection function (RSF) is any model that yields values proportional to the probability of use of a resource unit. RSF models often are fitted using generalized linear models (GLMs) although a variety of statistical models might be used. Information criteria such as the Akaike Information Criteria (AIC) or Bayesian Information Criteria (BIC) are tools that can be useful for selecting a model from a set of biologically plausible candidates. Statistical inference procedures, such as the likelihood-ratio test, can be used to assess whether models deviate from random null models. But for most applications of RSF models, usefulness is evaluated by how well the model predicts the location of organisms on a landscape. Predictions from RSF models constructed using presence/absence (used/unused) data can be evaluated using procedures developed for logistic regression, such as confusion matrices, Kappa statistics, and Receiver Operating Characteristic (ROC) curves. However, RSF models estimated from presence/available data create unique problems for evaluating model predictions. For presence/available models we propose a form of k -fold cross validation for evaluating prediction success. This involves calculating the correlation between RSF ranks and area-adjusted frequencies for a withheld sub-sample of data. A similar approach can be applied to evaluate predictive success for out-of-sample data. Not all RSF models are robust for application in different times or different places due to ecological and behavioral variation of the target organisms.

DOI

[18]
李石华,王金亮,陈姚.高黎贡山羚牛生境选择初步研究[J].四川动物,2007,26(1):51-55.2004年1月~2005年12月,在高黎贡山自然保护区内开展 了羚牛指名亚种的生境调查研究,在调查点内对与羚牛生存有关的生境因子(植被型、郁闭度、坡向、坡位、水源、人为干扰、距主要公路距离、距农用地距离)进 行了调查统计.在研究中,将这些生态因子分别分成了3个等级进行回归分析,建立羚牛在不同生境中出现概率的预测方程,通过分析后发现,影响高黎贡山羚牛生 境选择的主要生态因子是人为干扰和隐蔽条件,其次是距农业用地距离、距主要公路距离和水源,坡度、坡向和植被型对羚牛生境选择的影响不明显.

DOI

[ Li S H, Wang J L, Chen Y.A Primary Study on Habitat Selection of Gaoligong Mountain Takin[J]. Sichuan Journal of Zoology, 2007,26(1):51-55. ]

[19]
Lehmann A, Overton J M, Leathwick J R.GRASP: Generalized regression analysis and spatial prediction[J]. Ecological Modelling, 2003,160:165-183.We present generalized regression analysis and spatial prediction (GRASP) conceptually as a method for producing spatial predictions using statistical models, and introduce and demonstrate a specific implementation in Splus that facilitates the process. We put forward GRASP as a new name encapsulating an existing concept that aims at making spatial predictions using generalized regression analysis. Regression modeling is used to establish relationships between a response variable and a set of spatial predictors. The regression relationships are then used to make spatial predictions of the response. The GRASP process requires point measurements of the response, as well as regional coverages of predictor variables that are statistically (and preferably causally) important in determining the patterns of the response. This approach to spatial prediction is becoming more commonplace, and it is useful to define it as a general concept. For instance, GRASP could use a survey of the abundance of a species (the response), and existing spatial coverages of environmental (e.g. climate, landform) variables (the predictors) for a region. A multiple regression can be used to establish the statistical relationship between the species abundance and the environmental variables. These regression relationships can then be used to predict the species abundance from the environmental surfaces. This process defines relationships in environmental space and uses these relationships to predict in geographic space. We introduce GRASP (the implementation) as an interface and collection of functions in Splus designed to facilitate modern regression analysis and the use of these regressions for making spatial predictions. GRASP standardizes the modeling process and makes it more reproducible and less subjective, while preserving analysis flexibility. The set of functions provides a toolbox that allows quick and easy data checking, model building and evaluation, and calculation of predictions. The current version uses generalized additive models (GAMs), a modern non-parametric regression technique the advantages of which are discussed. We demonstrate the use of the GRASP implementation to model and predict the natural distributions of two components of New Zealand fern biodiversity: (1) the natural distribution of an icon species, silver fern ( Cyathea dealbata ); and (2) the natural pattern of total fern species richness. Key steps are demonstrated, including data preparation, options setting, data exploration, model building, model validation and interpretation, and spatial prediction.

DOI

[20]
Phillips S J, Anderson R P, Schapire R E.Maxemum entropy modeling of species geographic distributions[J]. Ecological Modelling, 2006,190:231-259.

[21]
Hirzel A H, Hausser J, Chessel D, et al.Ecological niche factor analysis: How to compute habitat suitability maps without absence data?[J]. Ecology, 2002,83(7):2027-2036.We propose a multivariate approach to the study of geographic species distribution which does not require absence data. Building on Hutchinson's concept of the ecological niche, this factor analysis compares, in the multidimensional space of ecological variables, the distribution of the localities where the focal species was observed to a reference set describing the whole study area. The first factor extracted maximizes the marginality of the focal species, defined as the ecological distance between the species optimum and the mean habitat within the reference area. The other factors maximize the specialization of this focal species, defined as the ratio of the ecological variance in mean habitat to that observed for the focal species. Eigenvectors and eigenvalues are readily interpreted and can be used to build habitat-suitability maps. This approach is recommended in Situations where absence data are not available (many data banks), unreliable (most cryptic or rare species), or meaningless (invaders). We provide an illustration and validation of the method for the alpine ibex, a species reintroduced in Switzerland which presumably has not yet recolonized its entire range.

DOI

[22]
姚小刚,李明会,周伟,等.哀牢山自然保护区南华片黑颈长尾雉生境适宜性评价[J].西南林业大学学报,2012,32(2):68-72.在地理信息系统(GIS)支持 下,结合实地调查,对分布于云南哀牢山自然保护区南华片的黑颈长尾雉生境适宜性进行评价。结果表明:不考虑人类活动影响时,黑颈长尾雉的适宜生境面积为2 041.38 hm2,占保护区总面积的8.06%;次适宜生境面积为2 775.84 hm2,占保护区总面积的10.96%;较不适宜生境面积为18 612.81 hm2,占保护区总面积的73.49%;而不适宜生境面积为1 896.99 hm2,占保护区总面积的7.49%。考虑人类活动影响时,黑颈长尾雉的适宜生境和次适宜生境分别减少27.30%和9.49%,而较不适宜生境和不适宜 生境分别增加4.34%和0.68%。表明哀牢山自然保护区南华片黑颈长尾雉的生境适宜性较差。

DOI

[ Yao X G, Li M H, Zhou W, et al.Habitat Suitability Assessment for Hume’s Pheasant (Syrmaticus humiae) in Nanhua Part of Ailaoshan National Nature Reserve[J]. Journal of Southwest Forestry University, 2012, 32(2):68-72. ]

[23]
Arriaga L, Castelanos V A E, Moreno E, et a1. Potential ecological distribution of alien invasive species and risk assessment: A case study of bufel grass in arid regions of Mexico[J]. Conservation Biology, 2004,18(6):1504-1514.

[24]
刘小华,周放,潘国平,等.广西黑颈长尾雉的分布与生态[J].广西林业,1990(4):25-26.我区最西部闻名遐尔的金钟山,座落在隆林县境内,海拔1836米。在它的茫茫林海中栖居着我国的一级重点保护野生动物——黑颈长尾雉。黑颈长尾雉属鸡形目、雉科,它是世界珍稀濒危鸟类之一。其已被列入国际保护自然和自然资源联盟1982年出版的红皮书中,它在我国的分布区十分狭窄,仅分布于桂、滇

[ Liu X H, Zhou F, Pan G P, et al.The distribution and ecology of syrmaticus humiae in Guangxi[J]. Forestry of Guangxi,1990,4:25-26. ]

[25]
刘小华,周放,潘国平,等.黑颈长尾雉繁殖习性的初步研究.动物学报,1991,37(3):332-333.正 黑颈长尾雉(Syrmaticus humiae burmannicus)是我国的一级保护动物。据郑作新等(1978),吴名川(1984)报道,云南亚种在国内仅分布于桂、滇两省区。作者于1986年5月、1987年2—6月、1988年1、5、9—10月、1989年7月、1990年4、5月间在隆林县金钟山北坡对其的繁殖习性作了初步的观察,现报道如下:

[ Liu X H, Zhou F, Pan G P.et al.Liu X H, Zhou F, Pan G P. et al.Breeding habits of syrmaticus humiae burm annicus[J]. Acta Zoologica Sinica, 1991,37(3):332-333. ]

[26]
贝永建, 陈伟才,李汉华,等.再引入黑颈长尾雉育雏行为和育雏地选择[J].四川动物,2008(1):92-94.2004~2005年在广西岑王老山自然保护区对再引进黑颈长尾 雉的育雏行为和育雏地选择进行了研究.结果表明:雏鸟活动能力随时间明显增强,1~3日活动面积在300 m2以内.育雏初期为地栖,后期开始为树栖.育雏地有3种类型:人工西南桦幼林、针叶林、针阔混交林.3种生境的乔木盖度分别是75%、90%、85%; 草本盖度分别是80%、60%、65%.Mann-Whitney U分析表明草本层盖度,水源距离,林缘距离,林间小路距离是影响黑颈长尾雉育雏地选择的主要因子.

[ Bei Y J. Chen W C, Li H H, et al.Brooding behavior and brooding habitat election of reintroduced syrmaticus humiae[J]. Sichuan Journal of Zoology, 2008,1:92-94. ]

[27]
广西金钟山黑颈长尾雉自然保护区综合科学考察.国家林业局中南林业调查规划设院,2006(1):1-9.

[ Scientific investigation of Syrmaticus humiae in Guangxi Jingzhongshan National Nature Reserve. Central South Forest Bureau Survey Scheme Designing Institute,2006,1:1-9. ]

[28]
韩联宪. 云南黑颈长尾雉(Syrmaticus humiae)分布及栖息地类型调查[J].生物多样性,1997,5(3):185-189.黑颈长尾雉是鸡形目鸟类中的濒 危物种,分布局限于印度东北部、缅甸北部、泰国西北部和中国西南部。在中国,该雉仅栖息于广西西部和云南中部、西部及南部地区。1992年至1995年在 云南对黑颈长尾雉的分布及栖息生境进行了专门的调查,共有13县18个地点记录到黑颈长尾雉分布。通过访问还获得一些可能有黑颈长尾雉分布但需进一步证实 的地点。黑颈长尾雉在云南的栖息生境主要有热带季雨林、亚热带常绿阔叶林、暖温性针叶林、暖热性针叶林和落叶阔叶林等5种类型。栖息地丧失和高强度狩猎是 导致黑颈长尾雉濒危的主要原因,如欲有效保护该物种,不仅要注意保护其栖息地,更要严格控制非法狩猎。

DOI

[ Han L X.The distribution and habitat selection of the Hume’s pheasant in Yunnan[J]. Chinese Biodiversity, 1997,5(3):185-189. ]

[29]
郑光美,王岐山.中国濒危动物红皮书——鸟类[M].北京:科学出版社,1998:180-181.

[ Zheng G M, Wang Q S.China red data bood of endangerde animals: Aves[M]. Beijing: Sciece Press, 1998:180-181. ]

[30]
杨月伟,丁平,姜仕仁,等.针阔混交林内白颈长尾雉栖息地利用的影响因子研究[J].动物学报,1999,45(3):279-286.采用无线电遥测和样方法对针阔混交林内白颈长尾雉栖息地利用的影 响因子进行了定量研究,结果显示:(1)白颈长尾雉对其栖息地的利用有较强的选择性;(2)白颈长尾雉主要在阳坡活动,春、秋、冬三季活动地坡度较平缓, 夏季略陡.该雉栖息地利用受水源距离的影响;(3)各种灌木层、草本层和地被层因子在白颈长尾雉栖息地中食物条件和隐蔽条件方面发挥重要作用.大叶白纸 扇、油茶、山、野枇杷、毛冬青、格药柃、乌饭、木、蔷薇科植物、苔草、三脉叶紫菀和蕨类植物是影响白颈长尾雉栖息地利用的重要植物种类; 昆虫和土壤动物作为白颈长尾雉的食物在栖息地的利用中亦起着重要作用.

DOI

[ Yang Y W, Ding P, Jiang S R, et al.Factors affecting habitat used by blliot’s pheasant (Syrmaticus humiae) in mixed coniferous and broadleaf foresrs[J]. Acta Zoologica Sinica, 1999,45(3):279-286. ]

[31]
丁平,杨月伟,李智,等.白颈长尾雉栖息地的植被特征研究[J].浙江大学学报(理学版),2001,28(5):557-562.构成白颈长尾雉阔叶林型栖息地的植被乔木层主要树种为壳斗科植 物,灌木层植物以山茶科、禾本科和樟科等科的种类为主,草本层植物以蕨类、禾本科和莎草科为主.在针阔混交林型栖息地,壳斗科植物仍占乔木层主要树种的相 当比例,但针叶树种的比例明显上升,该类型栖息地的灌木层和草本层植物组成特征与阔叶林型栖息地相似.在针叶林型栖息地中,乔木层的主要树种为马尾松、杉 木、福建柏和圆柏等,并有较多的阔叶灌木树种构成灌木层,草本层中以蕨类为主.白颈长尾雉栖息地选择的最主要影响因素是乔木层盖度.

DOI

[ Ding P, Yang Y W, Li Z, et al. Vegetation characteristics of habitats used by Elliot 's pheasant[J]. Journal of Zhejiang University (Sciences Edition), 2001,28(5):557-562. ]

[32]
刘钊,周伟,张庆,等.哀牢山自然保护区南华片黑颈长尾雉春季觅食地植物群落特征与选择[J].动物学研究,2006,29(6):646-652.2008年4月25日—5月 16日以系统取样法调查了哀牢山自然保护区南华片黑颈长尾雉(Syramticus humiae)觅食地的植物群落,共记录到植物133种,隶属86属49科。相关性分析结果显示,不同坡位,黑颈长尾雉的出现频率与常绿阔叶林的分布显著 相关,这意味着黑颈长尾雉的垂直分布与活动范围受常绿阔叶林分布的影响。黑颈长尾雉偏好选择常绿落叶林。植物重要值排序和物种组成的除趋势对应分析结果表 明,觅食地的植物种类组成与常绿阔叶林的相似性较高,而与其他林型分异较大。常绿阔叶林植被的层间组合可提供良好的隐蔽,林内蕨类的茎叶和壳斗科植物的坚 果可提供食物。多样性比较结果显示,觅食地植物多样性显著高于华山松林和落叶阔叶林,因此这两种林型均欠缺黑颈长尾雉的植物性食物。故植物多样性和食物丰 富度影响觅食地选择。植被因子比较及除趋势对应分析结果表明,除常绿阔叶林,觅食地的乔木盖度较其他林型的高,植被因子与其他林型相似性程度不一。落叶阔 叶林乔木稀疏,植被因子与觅食地相似性低且放牧干扰大;华山松林乔木矮小,灌木少;针阔混交林的植被因子与觅食地相似,但人为干扰严重。故隐蔽条件与人为 干扰是影响黑颈长尾雉觅食地选择的重要因素。相异性分析结果显示,研究区大部分地区能满足黑颈长尾雉生存基本要求,但最适宜其生存的地区很少。

DOI

[Liu Z, Zhou W, Zhang Q,et al.Selection and Plant Community Characteristics of Foraging Sites for Hume’s Pheasant (Syramticus humiae) in Nanhua Part of Ailaoshan National Nature Reserve[J]. Zoological Research, 2006,29(6):646-652. ]

[33]
李伟,周伟,纪德,等.哀牢山自然保护区南华分区黑颈长尾雉春季栖息地利用[J].浙江林学院学报,2006,23(2):153-158.2004年2~4月,对云南哀 牢山自然保护区南华分区黑颈长尾雉Syrmaticus humiae的春季栖息地利用进行了研究。结果表明:①黑颈长尾雉春季栖息地有常绿阔叶林、稀树灌丛林和华山松Pinus armandii;幼林等3种,前两者为其主要的栖息生境类型。②黑颈长尾雉栖息地的主要特征是高海拔,向阳坡,坡度较大,距水源较近,距道路较远;乔木 层平均胸径和高度较小,盖度和密度较低,以壳斗科Fagaceae和山茶科Theaceae植物为主;灌木层较高但密度较低,以山茶科和杨柳科 Salicaceae植物占优势;草本层密度较大,以堇菜科Violaceae,蔷薇科Rosaceae和菊科Compositae种类为主;枯落物层盖 度较低。③草本层和灌木层提供大量食物和优越的隐蔽条件,其作用大于乔木层。草本层密度和灌木层盖度是决定黑颈长尾雉春季栖息地利用的主要因素。表3参 20

DOI

[ Li W, Zhou W, Ji D, et al.Habitat use of Syrmaticus humiae in Nanhua Part of Ailaoshan National Nature Reserve in spring[J]. Journal of Zhejiang Forestry College, 2006,23(2):153-158. ]

文章导航

/