
遥感影像云及云影多特征协同检测方法
作者简介:沈金祥(1983-),男,博士,讲师,研究方向为遥感影像处理与信息提取。E-mail:shenjinx@126.com
收稿日期: 2016-03-08
要求修回日期: 2016-03-21
网络出版日期: 2016-05-10
基金资助
云南省应用基础研究计划项目(2013FB082)
国家自然科学基金项目(41271367)
Cloud and Cloud Shadow Multi-feature Collaborative Detection from Remote Sensing Image
Received date: 2016-03-08
Request revised date: 2016-03-21
Online published: 2016-05-10
Copyright
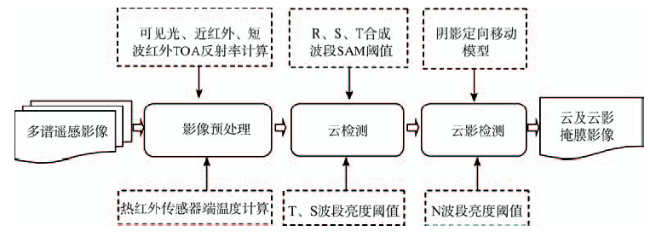
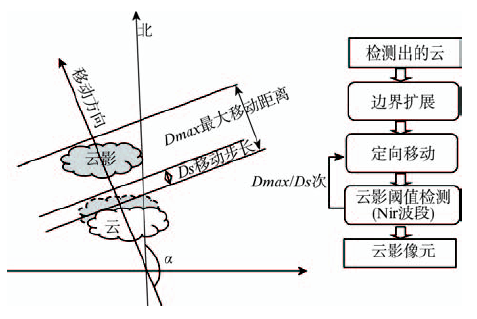
遥感影像中云及云影不同程度地影响着地物信息的有效获取。随着多源遥感数据的日益丰富,交叉应用多源、多时相遥感影像复原云及云影区的影像,以有效地获取地类演变过程是遥感大数据应用研究的重要内容。高精度的云及云影检测是遥感影像云及云影区修复的前提和保障。复杂多变的光谱特征以及难以有效表达的空间形态特征,使云及云影一直存在检测过程复杂、适用性差和精度不高的问题,难以形成稳定有效的检测方法。在对厚云、薄云、冰雪及其他地类多光谱特性分析的基础上,本文提出了一种云及云影的多特征协同检测方法。首先,对冰雪、云及其他地物类型可分性较好的红、短波红外、热红外波段,利用SAM方法匹配云光谱特征曲线,并进一步结合短波红外波段像元绝对值区分云与冰雪,以及热红外波段像元绝对值区分云及其他地物类型;其次,通过组合云影定向移动模型与近红外波段亮度阈值检测出云影像元。对具备这些光谱波段的Landsat-8进行实验,结果表明多光谱曲线、“诊断性”波段及空间关系多特征耦合能有效地检测出影像中的薄云、厚云及云影,整体精度优于95%。
沈金祥 , 季漩 . 遥感影像云及云影多特征协同检测方法[J]. 地球信息科学学报, 2016 , 18(5) : 599 -605 . DOI: 10.3724/SP.J.1047.2016.00599
Cloud and its shadow have certain degrees of impacts on the information extraction from remote sensing images. As the multi-source remote sensing data has become increasingly abundant in recent years, the cross application of the multi-source and multi-temporal remote sensing image for restoring the cloud and its shadow region, and for effectively acquiring the change information for the ground objects is an important content in studying the application of remote sensing big data. The precise detection of cloud and its shadow information is the premise and guarantee of their restoration. In general, the cloud and cloud shadow detection methods always use their spectral or spatial shape and the texture characteristics as references. However, regarding the complex and changeable spectrum and the inexpressible spatial shape characteristics, the cloud and cloud shadow information have always been difficult to be effectively detected. Based on the analysis of the spectral characteristics of thick clouds, thin clouds, snow and ice, and other feature types, a cloud and cloud shadow multi-feature collaborative detection method was proposed. (1) First of all, the cloud detection is executed. The proposed method extracts the standard thick cloud spectrum curve from the reflectance-calibrated image. Afterwards, the SAM method is used to match the cloud spectral curve from the distinguishable (red, shortwave infrared, thermal infrared) bands combination, with the absolute value of the shortwave infrared band pixel integrated to distinguish between cloud and snow, and the absolute value of the thermal infrared band pixel used to distinguish between cloud and other types of ground objects. (2) Next, the cloud shade detection is performed. Firstly, we expand the detected cloud pixel border, and produce a potential shadow mask area. Afterwards, we move the potential shadow mask along the direction of sun radiation to some distance. Thirdly, we detect the cloud shadow pixels using the brightness threshold of the near infrared band within the moved potential cloud shadow mask area. After several moves of the potential shadow mask and the implementations of cloud shadow detection based on the infrared band brightness threshold, eventually a complete cloud shadow mask is produced. The LANDSAT-8 image having the above mentioned bands is adopted in an experiment and the experimental result shows that the combination of spectral curve, "diagnosis" band and spatial relationship features can effectively detects the thin clouds, thick clouds and cloud shadows from the multispectral remote sensing image, and the overall accuracy is higher than 95%.
Fig. 1 Flowchart of cloud and cloud shadow multi-feature collaborative detection图1 云及云影多特征协同检测流程 |
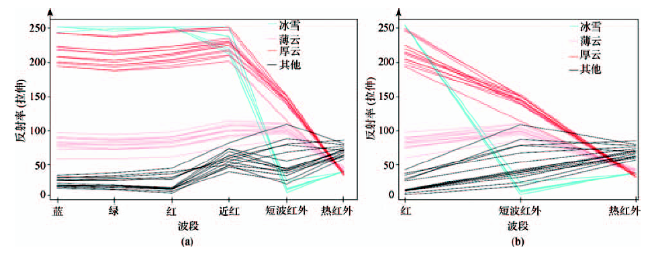
Fig. 2 The spectral curves of snow-ice, thick cloud, thin cloud and other feature types图2 冰雪、厚云、薄云及其他地类光谱曲线对比 |
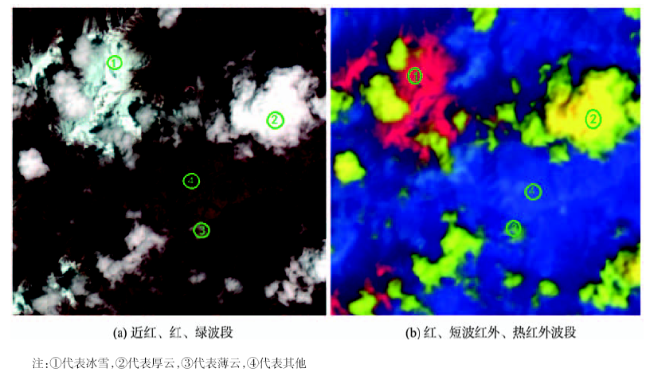
Fig.3 False color composite images图3 冰雪、厚云、薄云及其他地类假彩色合成影像 |
Fig.4 Cloud shadow detection procedure图4 云影检测流程图 |
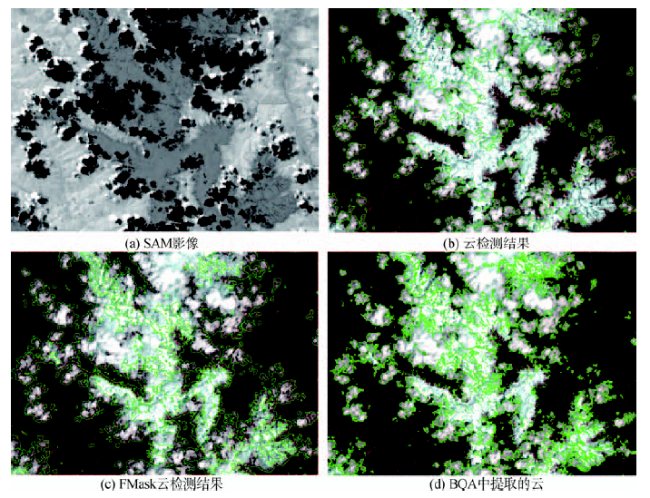
Fig.5 Results of cloud detection图5 云检测效果 |
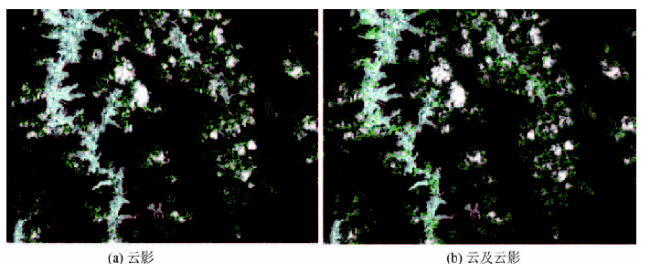
Fig.6 Results of cloud shadow detection图6 云影检测效果 |
The authors have declared that no competing interests exist.
| [1] |
|
| [2] |
|
| [3] |
|
| [4] |
|
| [5] |
[
|
| [6] |
|
| [7] |
[
|
| [8] |
[
|
| [9] |
|
| [10] |
|
| [11] |
|
| [12] |
|
| [13] |
|
| [14] |
|
| [15] |
|
| [16] |
|
| [17] |
[
|
| [18] |
[
|
| [19] |
[
|
| [20] |
[
|
| [21] |
|
| [22] |
|
/
| 〈 |
|
〉 |