遥感大数据协同计算方法

多分辨率协同遥感地块利用分类方法研究

  • 夏列钢 , * ,
  • 王卫红 ,
  • 杨海平
展开
  • 浙江工业大学计算机科学与技术学院,杭州 310023

作者简介:夏列钢(1986-),男,浙江绍兴人,博士,研究方向为遥感影像智能理解与信息自动提取。E-mail:

收稿日期: 2015-12-15

  要求修回日期: 2016-03-14

  网络出版日期: 2016-05-10

基金资助

国家自然科学基金项目(41271367、41371347)

国家高分辨率对地观测系统重大专项(03-Y30B06-9001-13/15-01)

广西科学研究与技术开发计划项目(14125008-1-6)

Remotely Sensed Land Patch Classification by Collaborating with Multi-Resolution Data

  • XIA Liegang , * ,
  • WANG Weihong ,
  • YANG Haiping
Expand
  • College of Computer Science and Technology, Zhejiang University of Technology, Hangzhou 310023, China
*Corresponding author: XIA Liegang, E-mail:

Received date: 2015-12-15

  Request revised date: 2016-03-14

  Online published: 2016-05-10

Copyright

《地球信息科学学报》编辑部 所有

摘要

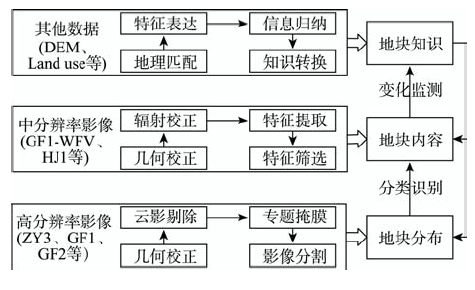
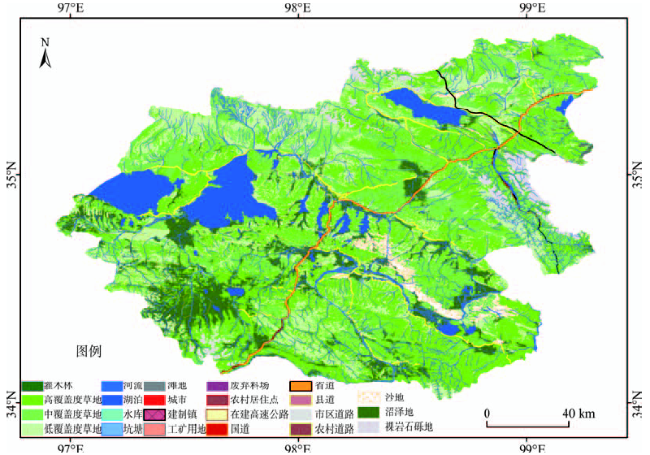
遥感影像的获取受卫星、传感器设计、大气条件等限制,往往难以兼顾时间和空间分辨率,导致由单一来源数据提取遥感信息难度较大,难以满足各种应用对信息时空分辨率越来越的需求。由此出发考虑多源数据的不同优势及其随着周期运行不断积累的多时相数据,设计了基于地块协同多种分辨率甚至多源数据的分类方法。以高空间分辨率影像为地理基准构建稳定地块分布图,这些地块在一定时间内边界与基本属性相对稳定,由此可以协同利用高时相分辨率数据反映地块在不同时间点的光谱表现,分别计算形成地块的时相变化特征,根据地类各自特点选择不同方法与数据特征完成解译,总体上以地块级监督分类完成具体类别解译。在2014年夏季青海玛多的米级土地利用分类实验中,整个植被生长季的中分数据以及冬季无云高分数据被收集用于协同分类,在解决多数据匹配、合成的基础上充分利用各数据的优势,对建设用地、水体、植被等关键类别区别对待,整体上取得了较高的解译精度,不但有效克服传统视角下数据源不足、信息缺失等问题完成了全县解译,而且保证了土地信息的时空分辨率,为生态调查与保护提供了最新最全数据支持。

本文引用格式

夏列钢 , 王卫红 , 杨海平 . 多分辨率协同遥感地块利用分类方法研究[J]. 地球信息科学学报, 2016 , 18(5) : 649 -654 . DOI: 10.3724/SP.J.1047.2016.00649

Abstract

The obtaining of remotely sensed imagery may affected by design of satellite, sensors, and atmospheric conditions.Normally it is difficult to balance the temporal and spatial resolution. Which leads to the hard of information extraction from a single source remote sensing data.Obviously this may impossible to meet the application demand which ask for higher and higher resolution information on spatial and temporal. Considering the different advantages of multi-source data and the accumulation of the multi-temporal data by time,we design the classification method based on the patches for multi-source data. The patches are basic geographical units which are relatively stable on boundary and properties. With these patches, other data may reflect the spectrum performance at different time or different point of view. After calculating these features we can interpret the patches with adapt methods based on the characteristics of each land class.In the land use classification experiment of Maduo in summer of 2014, many data are collecting for cooperating classification. Long term middle resolution data cover the whole vegetation growing season and cloudless high resolution data in winter are used after solving the problem of geo-matching and multi-source compositing. Because of different advantages of these data, categories like built up, water, vegetation are interpreted separately. At last we get a high total accuracy. Not only effectively overcome the traditional perspective of insufficient data source, lack of information and complete the interpretation of the county.But also ensure the spatial and temporal resolution of land information.

1 引言

遥感以其宏观快速的调查能力大大加深了人们对地表现象的认识[1-4],其数据已成为当前进行土地覆盖分类、土地利用现状调查的主要数据源。虽然已有很多研究致力于提高宏观尺度上土地分类的精度和自动化程度[5-6],但在详细类别的判别上人工,目视解译仍是难以替代的工程化解决方案[7]。目前遥感影像分类仍存在较大局限性,并存在许多技术瓶颈[8]:(1)光学遥感影像本身的稳定性有待提高,以保证几何定位、辐射一致性、数据有效性[9-10];(2)地物解译对影像的分辨率有所要求,其本身的变化不可忽视,但遥感数据空间分辨率与获取周期间的矛盾往往难以满足地物变化监测[11];(3)遥感分类方法本身存在较大局限性,不同来源(量纲)的特征、不同时段采集的样本如何协同应用于训练仍有待进一步研究[12]。例如,利用高分1号宽视场数据进行分类,尽管该数据在时空分辨率上具有较大优势,但实际应用中仍受多传感器间几何配准、辐射校正、云影处理等技术制约,特别在关键植被识别中难以避免地受生长季云雨天气制约,这显然难以满足土地调查对时效性日益增加的需求[13]
面对更高时空分辨率的影像分类需求,本文提出了基于地块的多分辨率影像协同分类方法。在数据源上,协同多空间、时间分辨率甚至多源的遥感影像参与计算分类,例如,利用高分辨率数据重点关注建筑、道路等精细目标,中分辨率数据重点关注作物、水域变化;在类别设置上,考虑不同地物随时间的变化规律,例如,人工建筑受时相影响较小且新增比减少更常见,而植被受时相影响较大且往往呈规律性变化;在分类方法上,也协同各种分类模型、人工目视解译以提高精度。最后,基于本文方法完成了2014年青海省玛多县米级土地利用分类图,在以往连完整收集遥感数据都困难的区域,及时解译了当年的高分辨率土地利用现状,为生态环境保护等应用提供了最新参考信息。

2 多分辨率协同遥感地块分类

遥感分类首先需要确定认知单元,传统以像元、对象为基本单元的分类方法难以脱离“当前影像”的概念,由于像元、对象是从某一景影像数据计算而来,因此难以考虑多源多分辨率协同。鉴此,本文引入“地块”作为基本认知单元,以现实地物为参照联系多类数据,从而实现协同分类。广义上,地块可以认为是边界和属性都稳定的地物在遥感图像空间的反映,因此一段时间内地块边界相对保持不变,其内部变化也由地物本身特点所导致。以常见的农林地块为例,其边界(田埂)一般保持稳定,边界内地物(作物生长)变化与地块类型(如水田、旱地、落叶阔叶林等)及外部条件(水、温、土、气及人为影响等)息息相关,因此,农林地块的认知不再局限于某景影像上的某种表现,而是由边界范围、植被生长、地形地貌、气候环境等多因素相互促进,基于这种认识的分类是准确、可验证且实用的。因此,以地块为联系有意识地关联影像内像元组团与现实地物,有可能协同所有数据来源中对地物的描述,从多角度相互印证和全方位地了解地物,从而提高认知精度。
为了达成该目标,本文建立了基于地块协同分类的整体框架,如图1所示。整体上按空间分辨率将数据源分成高分辨率影像、中分辨率影像和其他数据几大类,这些数据经过特定处理共同为基于地块的分类提供信息源。其中,高分辨率影像可用于确定地块的精确边界,中分辨率影像可及时地提供地块的光谱变化信息,其他数据协助提供地块的地形、环境、历史统计等多角度信息。
Fig. 1 Flowchart ofthe collaborative field classification formulti-resolution data

图1 多分辨率数据协同地块分类流程

在几何精校正、云影剔除等预处理的基础上,高分辨率影像主要用于提取部分仅在高分辨率影像上体现较好的重要地物。例如,道路、水系精度对边界比较敏感,可采用半自动方法先进行提取并进行掩膜,后续分割即可按区域特点调整尺度,城市区地物密集则分割精细,农林区地物单一则尺度增大,从而获得较完整的地块分布图。实际生产的地块是机器分割与人工修改的综合,根据地块特点,具有明确边界(建设用地、耕地、水域)的地块,需在分割基础上修改甚至直接手工勾画,而边界模糊(植被过渡区、未利用区域)的以分割为主,人工检查为辅,机器分割时根据数据情况会尽量考虑时相变化以保证结果的稳定。
中分辨率影像除了针对多时相做好几何配准外,还需保证各期的辐射一致性,使所提取特征具有可比性,同时为保证所提取特征确实反映地块特点,还需与高分辨率地块进行配准,最终将多时相的数据特征协同反映至地块分布图中。考虑到中、高分辨率之间尺度差异,假设地块边界上以混合像元为主,则离边界越远的内部像元其纯净度越高,且实际特征提取前还需将地块对应像素进行筛选。中分辨率影像的特征仅对部分地物(以植被为主)判别有所帮助,因此还需根据分类目标进行特征选择以提高精度与效率。
其他数据的协同应用首先需将其与地块空间进行地理匹配,其中部分原始数据根据数据特点按需进行特征表达以达到地块同化的目的。有些信息需经过地块级归纳与分析才能将其融入,有些知识需根据地块结构进行转换才能有效指导地块 的识别与理解,所有这些内容一方面能从更多角 度帮助了解地块[14],另一方面也是地块后续应用的基础。
地块分类整体上从边界确定、类型识别、知识理解递进且不断迭代,通过高分辨率影像处理基本确定地块边界以形成地块分布图。在此基础上,结合中分辨率数据的多特征进行地块识别,从而对地块内容有初步认识。最后,通过持续的数据更新及多源信息的融入,进一步了解地块变化过程,实现对地块知识的认知。在变化过程中,前期对地块的了解显然有利于后期对地块边界及内容的认知[15]

3 土地利用分类实验

青海省玛多县是黄河的发源地,水草丰盛,被称为千湖之县[16]。由于县域面积大(约2.5万km2),前期的土地利用调查数据以30 m为主,从当地生态环境保护和资源调查的需求来看,利用最新的米级高分辨率数据进行土地利用分类可大大改进基础数据质量,提高决策的科学性和各类措施的准确性。然而,由于青藏高原特殊的地理环境,玛多县的植被生长季主要为6-9月,且雨季云影对光学遥感的观测影响较大,从国产的高分1号和资源3号卫星数据覆盖情况来看,基本不可能在半年内收集到覆盖全县的有效数据,而以多分辨率协同分类方法,利用一切可用数据完成解译任务成为最可行的解决方案。

3.1 数据源

本文土地利用分类调查以2014年夏季为基准,因此收集了2014年6-9月的ZY3数据、GF1数据、Landsat 8数据,分辨率覆盖30、16、8、5.8和2 m等多个级别(表1)。为了获得完整覆盖的高分辨率数据,还收集了2013年与2014年冬天云量相对较少的ZY3数据。同时,为了辅助解译,参考最新的道路导航数据、2010年土地利用调查数据(图2),以及玛多、治多、伍道梁和沱沱河的站点观测数据。
Tab. 1 Statistics of the remote sensing data used in this study

表1 遥感数据统计表

数据类型 分辨率/m 时相 数量/景 数据量/GB
ZY3融合 2 2013、2014冬季 37 190
GF1融合 2 2014年6-9月 21 81.9
GF1-WFV 16 2014年6-9月 26 60.8
Landsat8 30 2014年6-9月 9 10.5
Fig. 2 Land use map of Maduo county in Qinghai Province

图2 青海省玛多县土地利用图

由于多批数据需要协同解译,对数据的几何定位精度提出了更高要求,特别是多时相和中、高分辨率之间的配准需要花更多时间进行精校正。中分辨率多时相数据主要以高分一号宽视场数据为主,多个传感器之间的辐射差异会对后续特征分析产生较大影响,因此需要分别进行辐射校正;夏季数据云量覆盖较大,特别是中分辨率数据由于覆盖次数多,对云影区检测及核查的精度和效率也有所要求。

3.2 分类流程

根据地域特点及生态调查需求,本次调查沿用了2000年中国科学院发布的全国土地利用图所设计的分类体系[17],共6个一级类25个二级类,同时根据高分辨率数据特点对人工地物、水域进行了细化,在解译过程中也根据地物特点分别采用人工或机器解译。整体上,首先,利用冬季无云的高分辨率数据进行人工地物的解译,这是由人工参考导航数据中的道路、建筑完成的,当然一些农村居住点也需要机器搜索并人工判定;其次,利用丰水季高分辨率数据尽量提取水体,云影区域采用同期16 m中分辨率数据补充,从而获得完整水体覆盖区域;最后,在排除上述2大类专题数据后,在剩余区域采用中高分辨率协同分类完成其余地物解译,具体采用高分辨率数据(夏季为主,云影区以冬季数据补充)分割地块,采用中分辨率多时相数据计算地块特征,再利用这些特征进行监督分类,实现草地、未利用地等类型的自动区分。采用了C5.0决策树分类,通过特征筛选可以有效地克服部分地块在某些时相的特征缺失(云影覆盖),此过程中的前期土地利用结果作为部分参考样本大大减少了工作量。

3.3 结果及分析

由于土地利用生产按实际需求有较多人工参与,因此,在精度评价中要分别考虑[18],人工用地数量少且自动化程度最低,草地数量最多但自动化程度最高。根据外业采集照片以及更高分辨率数据参考选择了400个验证点检验产品精度,在不考虑草地与人工用地二级类时,这些类别的总体精度达到93.5%,kappa系数达到0.911,具体分布混淆矩阵如表2所示。
Tab. 2 Maduo county land use classification

表2 玛多县土地利用分类精度表

类别 人工用地 草地 河流 湖泊 沙地 沼泽地 裸岩石砾地 生产精度/(%)
人工用地 39 0 0 0 0 0 0 100.0
草地 1 169 2 0 1 2 1 96.0
河流 0 3 56 1 0 1 0 91.8
湖泊 0 1 1 68 0 1 0 95.8
沙地 0 1 0 0 17 0 0 94.4
沼泽地 0 6 1 1 0 16 0 66.7
裸岩石砾地 0 0 0 0 2 0 9 81.8
用户精度/(%) 97.5 93.9 93.3 97.1 85.0 80.0 90.0
总体精度/(%) 93.5
kappa系数 0.911
单独考虑人工建设用地时,城市、建制镇、工矿用地、农村居住点、料场、国道、省道、县道、农村道路等二级类由于影像分辨率合适且人工参与较多,其总体精度超过了97%,仅有部分居住点及工矿用地被误判。
考虑草地的二级类按高覆盖度草地、中覆盖度草地、低覆盖度草地及灌丛草地分类,其统计精度相对较低,仅为89.1%。这主要存在2方面的问题:(1)草地是季节敏感性最大的地物,即使在夏季各时段生长情况也不一致,通过一段时间的不完整观测数据解译草地覆盖程度,存在很大的不确定性;(2)由于解译主时相为草地生长季,外业时间也安排在11月左右,因此草地类型的验证点可靠性相对较低。与传统解译方法相比,草地的二级类精度能达到80%以上已经有较大进步,充分发挥了协同分类的优势。从验证可靠性来看,人工地物、湖泊、时令/常年河的外业验证点相对可靠,沙地、沼泽地等部分区域难以到达,同时段的更高分辨率数据也较难获得,这些客观因素制约了精度评价的客观性。

4 结论与展望

针对更高时空分辨率土地利用产品的需求,在光学遥感被动式获取方式及条件难以改变的前提下,尽最大可能提高数据利用率的地块协同分类是解决实际生产的有效解决方案,一方面改变了传统方式下仅挑选较好数据时可用数据量不足的问题,另一方面也能快速满足特定时相的解译要求,而且综合多源信息能将解译精度提升一个层次。以玛多县分类实验为例,传统方法下一年内难以收集足够的高分辨率数据,即使花大量成本获取了数据,由于各数据时相没有延续性也很难取得较好的解译效果,而协同分类方法从设计上考虑了数据实际情况,因此,最终可行性更高,精度与效率也有保障。
在后续研究中,可从以下3方面考虑进一步改进方法实用性,在提升精度与生产效率的同时提取更多信息。
(1)随着影像的不断积累与更新,地块应持续修正甚至实时更新,尽管认为地块相对稳定,但由于人为或自然因素其边界仍有可能产生变化,在修正过程中由于难以保证多期影像绝对配准,因此在地块边界局部更新中应克服多边形整体偏移容差及局部线修改等问题。
(2)随着基础数据的生产与收集,多源信息应融入并辅助地块解译,以影像为主的分类解译已难以满足大数据时代对土地利用深入挖掘分析的需求。在建立地块多维特征集基础上需要不断延伸,不但要寻找内在关系与规律,更要拓展外围数据,形成全方位的地块。
(3)随着地块产品的丰富与应用,认知成果应随之积累并迭代改进,遥感认知的地表目标虽在不断变化,却有其固定模式:由简单而复杂的认知过程应逐步组建,以数据、信息、模型的不断迭代提高知识的凝练与精度,从而达到预测甚至指导决策的目标。

The authors have declared that no competing interests exist.

[1]
Homer C C, Huang L, Yang B W, et al.Development of a 2001 national land-cover database for the United States[J]. Photogrammetric Engineering and Remote Sensing, 2004,70(7):829-840.Multi-Resolution Land Characterization 2001 (MRLC 2001) is a second-generation Federal consortium designed to create an updated pool of nation-wide Landsat 5 and 7 imagery and derive a second-generation National Land Cover Database (NLCD 2001). The objectives of this multi-layer, multi-source database are twofold: first, to provide consistent land cover for all 50 States, and second, to provide a data framework which allows flexibility in developing and applying each independent data component to a wide variety of other applications. Components in the database include the following: (1) normalized imagery for three time periods per path/row, (2) ancillary data, including a 30 m Digital Elevation Model (DEM) derived into slope, aspect and slope position, (3) per pixel estimates of percent imperviousness and percent tree canopy, (4) 29 classes of land cover data derived from the imagery, ancillary data, and derivatives, (5) classification rules, confidence estimates, and metadata from the land cover classification. This database is now being developed using a Mapping Zone approach, with 66 Zones in the continental United States and 23 Zones in Alaska. Results from three initial mapping Zones show single-pixel land cover accuracies ranging from 73 to 77 percent, imperviousness accuracies ranging from 83 to 91 percent, tree canopy accuracies ranging from 78 to 93 percent, and an estimated 50 percent increase in mapping efficiency over previous methods. The database has now entered the production phase and is being created using extensive partnering in the Federal government with planned completion by 2006.

DOI

[2]
Friedl M A, Sulla-Menashe D, Tan B, et al.MODIS collection 5 global land cover: algorithm refinements and characterization of new datasets[J]. Remote Sensing of Environment, 2010,114(1):168-182.Information related to land cover is immensely important to global change science. In the past decade, data sources and methodologies for creating global land cover maps from remote sensing have evolved rapidly. Here we describe the datasets and algorithms used to create the Collection 5 MODIS Global Land Cover Type product, which is substantially changed relative to Collection 4. In addition to using updated input data, the algorithm and ancillary datasets used to produce the product have been refined. Most importantly, the Collection 5 product is generated at 500-m spatial resolution, providing a four-fold increase in spatial resolution relative to the previous version. In addition, many components of the classification algorithm have been changed. The training site database has been revised, land surface temperature is now included as an input feature, and ancillary datasets used in post-processing of ensemble decision tree results have been updated. Further, methods used to correct classifier results for bias imposed by training data properties have been refined, techniques used to fuse ancillary data based on spatially varying prior probabilities have been revised, and a variety of methods have been developed to address limitations of the algorithm for the urban, wetland, and deciduous needleleaf classes. Finally, techniques used to stabilize classification results across years have been developed and implemented to reduce year-to-year variation in land cover labels not associated with land cover change. Results from a cross-validation analysis indicate that the overall accuracy of the product is about 75% correctly classified, but that the range in class-specific accuracies is large. Comparison of Collection 5 maps with Collection 4 results show substantial differences arising from increased spatial resolution and changes in the input data and classification algorithm.

DOI

[3]
Dardel C, Kergoat L, Hiernaux P, et al.Re-greening Sahel: 30years of remote sensing data and field observations (Mali, Niger)[J]. Remote Sensing of Environment, 2014,140:350-364.

[4]
Hansen M C, Potapov P V, Moore R, et al.High-resolution global maps of 21st-century forest cover change[J]. Science, 2013,342(6160):850-853.Quantification of global forest change has been lacking despite the recognized importance of forest ecosystem services. In this study, Earth observation satellite data were used to map global forest loss (2.3 million square kilometers) and gain (0.8 million square kilometers) from 2000 to 2012 at a spatial resolution of 30 meters. The tropics were the only climate domain to exhibit a trend, with forest loss increasing by 2101 square kilometers per year. Brazil's well-documented reduction in deforestation was offset by increasing forest loss in Indonesia, Malaysia, Paraguay, Bolivia, Zambia, Angola, and elsewhere. Intensive forestry practiced within subtropical forests resulted in the highest rates of forest change globally. Boreal forest loss due largely to fire and forestry was second to that in the tropics in absolute and proportional terms. These results depict a globally consistent and locally relevant record of forest change.

DOI PMID

[5]
Gong P, Wang J, Yu L, et al.Finer resolution observation and monitoring of global land cover: first mapping results with Landsat TM and ETM+ data[J]. International Journal of Remote Sensing, 2013,34(7):2607-2654.

[6]
Quartulli M, Olaizola I G.A review of EO image information mining[J]. ISPRS Journal of Photogrammetry and Remote Sensing, 2013,75:11-28.We analyze the state of the art of content-based retrieval in Earth observation image archives focusing on complete systems showing promise for operational implementation. The different paradigms at the basis of the main system families are introduced. The approaches taken are considered, focusing in particular on the phases after primitive feature extraction. The solutions envisaged for the issues related to feature simplification and synthesis, indexing, semantic labeling are reviewed. The methodologies for query specification and execution are evaluated. Conclusions are drawn on the state of published research in Earth observation (EO) mining. (c) 2012 International Society for Photogrammetry and Remote Sensing, Inc. (ISPRS) Published by Elsevier B.V. All rights reserved.

DOI

[7]
Galleguillos C, Belongie S.Context based object categorization: a critical survey[J]. Computer Vision and Image Understanding, 2010,114(6):712-722.Abstract. The goal of object categorization is to locate and identify instances of an object category within an image. Recognizing an object in an image is difficult when images present occlusion, poor quality, noise or background clutter, and this task becomes even more challenging when many objects are present in the same scene. Several models for object categorization use appearance and context information from objects to improve recognition accuracy. Appearance information, based on visual cues, can successfully identify object classes up to a certain extent. Context information, based on the interaction among objects in the scene or on global scene statistics, can help successfully disambiguate appearance inputs in recognition tasks. In this work we review different approaches of using contextual information in the field of object categorization and discuss scalability, optimizations and possible future approaches. 1

DOI

[8]
Fauvel M, Chanussot J, Benediktsson J A.A spatial-spectral kernel-based approach for the classification of remote-sensing images[J]. Pattern Recognition, 2012,45(1):381-392.Classification of remotely sensed images with very high spatial resolution is investigated. The proposed method deals with the joint use of the spatial and the spectral information provided by the remote-sensing images. A definition of an adaptive neighborhood system is considered. Based on morphological area filtering, the spatial information associated with each pixel is modeled as the set of connected pixels with an identical gray value (flat zone) to which the pixel belongs: The pixel's neighborhood is characterized by the vector median value of the corresponding flat zone. The spectral information is the original pixel's value, be it a scalar or a vector value. Using kernel methods, the spatial and spectral information are jointly used for the classification through a support vector machine formulation. Experiments on hyperspectral and panchromatic images are presented and show a significant increase in classification accuracies for peri-urban area: For instance, with the first data set, the overall accuracy is increased from 80% with a conventional support vectors machines classifier to 86% with the proposed approach. Comparisons with other contextual methods show that the method is competitive.

DOI

[9]
Wulder M A, White J C, Goward S N, et al.Landsat continuity: issues and opportunities for land cover monitoring[J]. Remote Sensing of Environment, 2008,112(3):955-969.Initiated in 1972, the Landsat program has provided a continuous record of earth observation for 35years. The assemblage of Landsat spatial, spectral, and temporal resolutions, over a reasonably sized image extent, results in imagery that can be processed to represent land cover over large areas with an amount of spatial detail that is absolutely unique and indispensable for monitoring, management, and scientific activities. Recent technical problems with the two existing Landsat satellites, and delays in the development and launch of a successor, increase the likelihood that a gap in Landsat continuity may occur. In this communication, we identify the key features of the Landsat program that have resulted in the extensive use of Landsat data for large area land cover mapping and monitoring. We then augment this list of key features by examining the data needs of existing large area land cover monitoring programs. Subsequently, we use this list as a basis for reviewing the current constellation of earth observation satellites to identify potential alternative data sources for large area land cover applications. Notions of a virtual constellation of satellites to meet large area land cover mapping and monitoring needs are also presented. Finally, research priorities that would facilitate the integration of these alternative data sources into existing large area land cover monitoring programs are identified. Continuity of the Landsat program and the measurements provided are critical for scientific, environmental, economic, and social purposes. It is difficult to overstate the importance of Landsat; there are no other systems in orbit, or planned for launch in the short-term, that can duplicate or approach replication, of the measurements and information conferred by Landsat. While technical and political options are being pursued, there is no satellite image data stream poised to enter the National Satellite Land Remote Sensing Data Archive should system failures occur to Landsat-5 and -7.

DOI

[10]
Marsetic A, Ostir K, Fras M K.Automatic orthorectification of high-resolution optical satellite images using vector roads[J]. IEEE Transactions on Geoscience and Remote Sensing, 2015,53(11):6035-6047.This paper presents a completely automatic processing chain for orthorectification of optical pushbroom sensors. The procedure is robust and works without manual intervention from raw satellite image to orthoimage. It is modularly divided in four main steps: metadata extraction, automatic ground control point (GCP) extraction, geometric modeling, and orthorectification. The GCP extraction step uses georeferenced vector roads as a reference and produces a file with a list of points and their accuracy estimation. The physical geometric model is based on collinearity equations and works with sensor-corrected (level 1) optical satellite images. It models the sensor position and attitude with second-order piecewise polynomials depending on the acquisition time. The exterior orientation parameters are estimated in a least squares adjustment, employing random sample consensus and robust estimation algorithms for the removal of erroneous points and fine-tuning of the results. The images are finally orthorectified using a digital elevation model and positioned in a national coordinate system. The usability of the method is presented by testing three RapidEye images of regions with different terrain configurations. Several tests were carried out to verify the efficiency of the procedure and to make it more robust. Using the geometric model, subpixel accuracy on independent check points was achieved, and positional accuracy of orthoimages was around one pixel. The proposed procedure is general and can be easily adapted to various sensors.

DOI

[11]
Tulbure M G, Broich M.Spatiotemporal dynamic of surface water bodies using Landsat time-series data from 1999 to 2011[J]. ISPRS Journal of Photogrammetry and Remote Sensing, 2013,79:44-52.Detailed information on the spatiotemporal dynamic in surface water bodies is important for quantifying the effects of a drying climate, increased water abstraction and rapid urbanization on wetlands. The Swan Coastal Plain (SCP) with over 1500 wetlands is a global biodiversity hotspot located in the southwest of Western Australia, where more than 70% of the wetlands have been lost since European settlement. SCP is located in an area affected by recent climate change that also experiences rapid urban development and ground water abstraction. Landsat TM and ETM+ imagery from 1999 to 2011 has been used to automatically derive a spatially and temporally explicit time-series of surface water body extent on the SCP. A mapping method based on the Landsat data and a decision tree classification algorithm is described. Two generic classifiers were derived for the Landsat 5 and Landsat 7 data. Several landscape metrics were computed to summarize the intra and interannual patterns of surface water dynamic. Top of the atmosphere (TOA) reflectance of band 5 followed by TOA reflectance of bands 4 and 3 were the explanatory variables most important for mapping surface water bodies. Accuracy assessment yielded an overall classification accuracy of 96%, with 89% producer's accuracy and 93% user's accuracy of surface water bodies. The number, mean size, and total area of water bodies showed high seasonal variability with highest numbers in winter and lowest numbers in summer. The number of water bodies in winter increased until 2005 after which a decline can be noted. The lowest numbers occurred in 2010 which coincided with one of the years with the lowest rainfall in the area. Understanding the spatiotemporal dynamic of surface water bodies on the SCP constitutes the basis for understanding the effect of rainfall, water abstraction and urban development on water bodies in a spatially explicit way. (C) 2013 International Society for Photogrammetry and Remote Sensing, Inc. (ISPRS) Published by Elsevier B.V. All rights reserved.

DOI

[12]
Wozniak M, Grana M, Corchado E.A survey of multiple classifier systems as hybrid systems[J]. Information Fusion,2014,16:3-17.A current focus of intense research in pattern classification is the combination of several classifier systems, which can be built following either the same or different models and/or datasets building approaches. These systems perform information fusion of classification decisions at different levels overcoming limitations of traditional approaches based on single classifiers. This paper presents an up-to-date survey on multiple classifier system (MCS) from the point of view of Hybrid Intelligent Systems. The article discusses major issues, such as diversity and decision fusion methods, providing a vision of the spectrum of applications that are currently being developed.

DOI

[13]
黄振国,杨君.高分一号卫星影像监测水稻种植面积研究综述[J].湖南农业科学,2014(13):76-78.简要介绍了高分一号卫星应用于农情遥感监测的优势和水稻种植面积遥感监测的原理,着重对遥感影像数据预处理、遥感影像分类方法与水稻面积提取技术等方面的研究进展进行了综述。高分一号卫星具有高空间分辨率和时间分辨率的特点,反映作物的光谱特征明显,适合选用为农情遥感监测的数据源;基于高分辨率卫星影像的水稻种植面积提取技术比较成熟;基于决策树、人工神经网络、专家知识、人工目视解译等分类提取方法应用前景广阔,但精度有待进一步提高。

DOI

[ Huang Z G, Yang J.Review of High-1 satellite image monitoring rice planting area[J]. Hunan Agricultural Sciences, 2014,13:76-78. ]

[14]
Blaschke T, Hay G J, Weng Q, et al.Collective sensing: integrating geospatial technologies to understand urban systems-an overview[J]. Remote Sensing, 2011,3(8):1743-1776.Cities are complex systems composed of numerous interacting components that evolve over multiple spatio-temporal scales. Consequently, no single data source is sufficient to satisfy the information needs required to map, monitor, model, and ultimately understand and manage our interaction within such urban systems. Remote sensing technology provides a key data source for mapping such environments, but is not sufficient for fully understanding them. In this article we provide a condensed urban perspective of critical geospatial technologies and techniques: (i) Remote Sensing; (ii) Geographic Information Systems; (iii) object-based image analysis; and (iv) sensor webs, and recommend a holistic integration of these technologies within the language of open geospatial consortium (OGC) standards in-order to more fully understand urban systems. We then discuss the potential of this integration and conclude that this extends the monitoring and mapping options beyond "hard infrastructure" by addressing "humans as sensors", mobility and human-environment interactions, and future improvements to quality of life and of social infrastructures.

DOI

[15]
Demir B, Bovolo F, Bruzzone L.Updating land-cover maps by classification of image time series: A novel change-detection-driven transfer learning approach[J]. IEEE Transactions on Geoscience and Remote Sensing,2013,51(1):300-312.This paper proposes a novel change-detection-driven transfer learning (TL) approach to update land-cover maps by classifying remote-sensing images acquired on the same area at different times (i.e., image time series). The proposed approach requires that a reliable training set is available only for one of the images (i.e., the source domain) in the time series whereas it is not for another image to be classified (i.e., the target domain). Unlike other literature TL methods, no additional assumptions on either the similarity between class distributions or the presence of the same set of land-cover classes in the two domains are required. The proposed method aims at defining a reliable training set for the target domain, taking advantage of the already available knowledge on the source domain. This is done by applying an unsupervised-change-detection method to target and source domains and transferring class labels of detected unchanged training samples from the source to the target domain to initialize the target-domain training set. The training set is then optimized by a properly defined novel active learning (AL) procedure. At the early iterations of AL, priority in labeling is given to samples detected as being changed, whereas in the remaining ones, the most informative samples are selected from changed and unchanged unlabeled samples. Finally, the target image is classified. Experimental results show that transferring the class labels from the source domain to the target domain provides a reliable initial training set and that the priority rule for AL results in a fast convergence to the desired accuracy with respect to Standard AL.

DOI

[16]
张帅,邵全琴,刘纪远,等.黄河源区玛多县土地利用/覆被及景观格局变化的遥感分析[J].地球信息科学,2007,9(4):109-115,128,封2S.采用了黄河源地区1977、1990及2003年MSS、TM的3个时相遥感影像,通过人机交互的解译与GIS的空间分析,提取了玛多县3个时期的土地利用/覆被信息。分析了玛多县各地类的数量变化和空间变化特征。另外对景观生态空间分布格局,利用FRAGSTATS软件对玛多县景观级别的动态特征进行了分析。结果表明:玛多县的土地利用/覆被类型以草地为主,占全区总面积77.93%;退化现象十分严重,主要是草地覆盖度的降低以及草地沙化;景观破碎化程度在前期呈下降趋势,而后期呈上升趋势,景观斑块形态越来越偏离规则而变得复杂、多样。

DOI

[ Zhang S, Shao Q Q, Liu J Y, et al. Land use and landscape pattern change in Madoi county, the source region of Yellow River[J]. Geo-Information Science, 2007, 9(4):109-115,128,Cover 2.]

[17]
刘纪远,刘明亮,庄大方,等.中国近期土地利用变化的空间格局分析[J].中国科学D辑,2002,32(12):1031-1040.在全球环境变化研究中, 土地利用和土地覆被动态越来越被认为是一个关键而迫切的研究课题. 依据覆盖中国1990年代末期5 a时间间隔的陆地卫星数据资料, 研究了土地利用变化的特征和空间分布规律. 依据土地利用动态度的概念, 在1 km格网土地利用变化数据基础上, 根据区域近期土地利用动态特点与社会、自然环境综合特征, 设计了全国土地利用动态区划图, 揭示了土地利用变化过程的空间格局. 总体上, 传统农作区(包括黄淮海平原、长江三角洲地区和四川盆地等)城镇居民建设用地的扩张侵占了大面积的耕地, 而北方农牧交错带与西北绿洲农业区由于生产条件、经济利益和气候变化等方面的原因, 耕地开垦现象最为突出. 国家退耕还林还草政策的实施效果在局部地区有所体现, 但截至2000年, 尚未对土地覆被变化产生区域性的影响, 此5 a期间森林砍伐现象依然比较严峻. 本项研究, 实现了中国现代土地利用动态区域单元的划分, 揭示了中国现代土地利用变化的时间-空间属性并为其特征分析提供了区域格局框架. 该项研究是地理科学对研究对象的"空间格局"与"时间过程"特征进行集成研究, 揭示研究对象"变化过程的格局", 以及"格局的变化过程"的一次有益的尝试.

DOI

[ Liu J Y, Liu M L, Zhuang D F, et al.Spatial pattern analysis of land-use change in recent China[J]. Science in China (Series D), 2002,32(12):1031-1040. ]

[18]
Wickham J D, Stehman S V, Gass L, et al.Accuracy assessment of NLCD 2006 land cover and impervious surface[J]. Remote Sensing of Environment, 2013,130:294-304.Release of NLCD 2006 provides the first wall-to-wall land-cover change database for the conterminous United States from Landsat Thematic Mapper (TM) data. Accuracy assessment of NLCD 2006 focused on four primary products: 2001 land cover, 2006 land cover, land-cover change between 2001 and 2006, and impervious surface change between 2001 and 2006. The accuracy assessment was conducted by selecting a stratified random sample of pixels with the reference classification interpreted from multi-temporal high resolution digital imagery. The NLCD Level II (16 classes) overall accuracies for the 2001 and 2006 land cover were 79% and 78%, respectively, with Level II user's accuracies exceeding 80% for water, high density urban, all upland forest classes, shrubland, and cropland for both dates. Level I (8 classes) accuracies were 85% for NLCD 2001 and 84% for NLCD 2006. The high overall and user's accuracies for the individual dates translated into high user's accuracies for the 2001-2006 change reporting themes water gain and loss, forest loss, urban gain, and the no-change reporting themes for water, urban, forest and agriculture. The main factor limiting higher accuracies for the change reporting themes appeared to be difficulty in distinguishing the context of grass. We discuss the need for more research on land-cover change accuracy assessment Published by Elsevier Inc.

DOI

文章导航

/