
遥感大数据实时渲染与交互可视化研究
作者简介:周亚男(1987-),男,博士,研究方向为高性能GIS。E-mail:zhounanq@126.com
收稿日期: 2015-12-15
要求修回日期: 2016-02-01
网络出版日期: 2016-05-10
基金资助
国家自然科学基金项目(41501453、41301438)
中国博士后科学基金项目(2015M570138)
中国科学院重点部署项目(KZZD-EW-07-01)
中国科学院遥感与数字地球研究所“135”计划项目(Y3SG1500CX)
Real-time Rendering and Interactive Visualization of Remote Sensing Big Data
Received date: 2015-12-15
Request revised date: 2016-02-01
Online published: 2016-05-10
Copyright
数据可视化是遥感应用的重要服务出口。针对静态的预生成瓦片地图难以满足数据查看、地图配置、空间分析等专业应用问题,本文提出了一套面向遥感大数据的实时渲染与交互可视化的解决方案。在渲染节点构建影像的渲染瓦片结构,以提高数据的读取速度;在可视化服务上,提出“数据-计算”相一致的负载均衡策略,优化地图的渲染效率;在可视化服务方面,设计交互的地图服务接口。与传统技术的对比分析表明,该解决方案不但实现了遥感大数据的实时渲染与交互可视化,并且达到了与预生成瓦片地图服务相当的服务性能。基于这一解决方案,研发了遥感大数据的动态可视化原型,并在影像数据实时查看、可视化计算、可视化分析等方面开展了示范应用。
周亚男 , 赵威 , 范亚男 . 遥感大数据实时渲染与交互可视化研究[J]. 地球信息科学学报, 2016 , 18(5) : 664 -672 . DOI: 10.3724/SP.J.1047.2016.00664
Data visualization is an important service in remote sensing applications. To address the problems that it is difficult for the static pre-built map tile service to meet the requirements of professional data view, map configuration, spatial analysis and other applications, this paper presented a solution architecture for the real-time rendering and interactive visualization of remote sensing big data. Firstly, on the rendering nodes, a rendering-tile structure for image was constructed to improve the reading speed of remote sensing images. Secondly, on the visualization servers, a data-computing load balancing strategy was proposed to optimize the rendering efficiency of map tiles. Thirdly, a set of service interfaces for the interactive visualization was designed for the front ends of services. Compared with the traditional technology, this solution can not only achieve the real-time rendering and the interactive visualization of remote sensing data, but also obtain an equivalent service performance to the pre-built tile map service. Finally, based on the above solutions, an interactive visualization prototype system of remote sensing data was developed and was applied into the demonstrations of the real-time viewing of remote sensing images, the visualized computing and the visualized analysis.
Key words: RS big data; WMTS; real-time rendering; interactive visualization
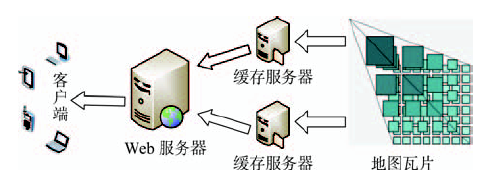
Fig. 1 Pre-built map tile service图1 基于预生成地图瓦片的地图服务 |
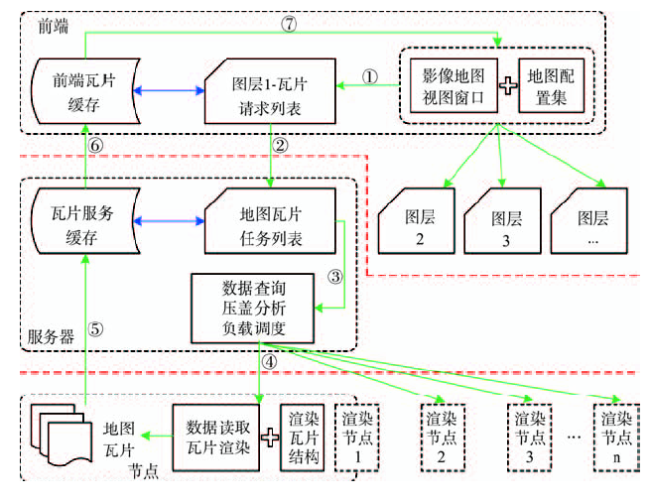
Fig. 2 Flowchart of real-time rendering and interactive visualization图2 实时渲染与交互可视化技术流程 |
Tab. 1 Timings of each step in the map tile service表1 地图瓦片服务各环节耗时比例 |
| 接收请求 | 元数据查询 | 请求下发 | 数据块检索 | 数据块读取 | 瓦片渲染 | 结果返回 | |
|---|---|---|---|---|---|---|---|
| 耗时比例/(%) | 6~9 | 13~16 | 5~7 | 15~17 | 27~33 | 20~24 | 4~9 |
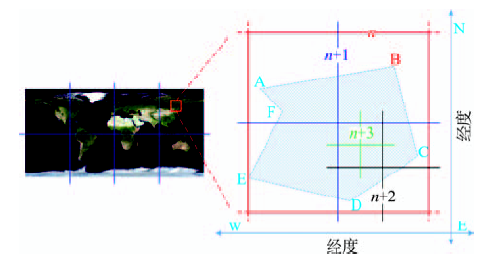
Fig. 3 Spatial partition of an image图3 影像数据空间划分示意 |
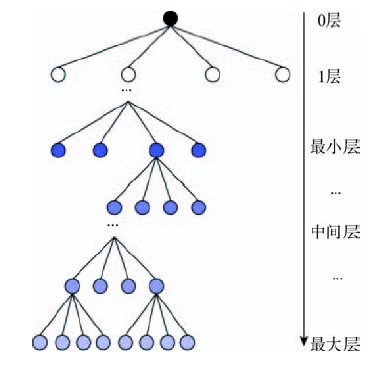
Fig. 4 Quad-tree structure of an image tile pyramid图4 影像渲染瓦片的四叉树层次结构 |
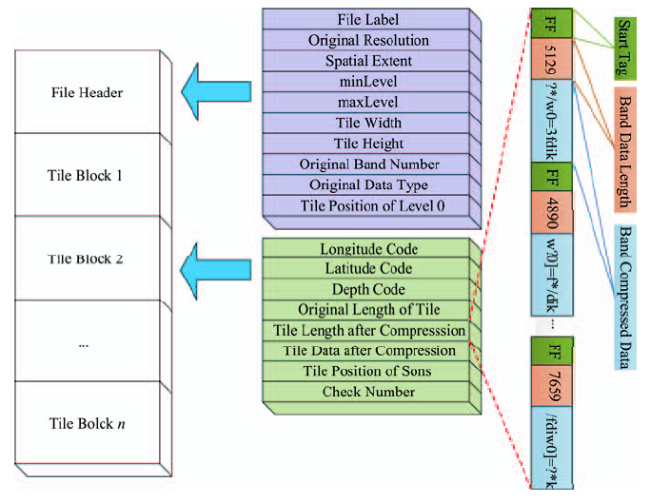
Fig. 5 Storage of image tile pyramid图5 影像瓦片金字塔存储结构 |
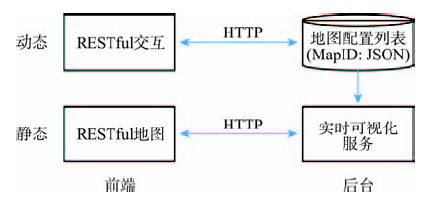
Fig. 6 Design of the real-time interactive map server图6 动态交互地图服务的整体设计 |
Tab. 2 Server interfaces of the interactive maps表2 交互地图的服务接口 |
| 名称 | RESTful接口 | 描述 |
|---|---|---|
| 新建空白地图 | POST:http://mapserver/rastermap/ | 创建一个新的地图,并返回地图的唯一标示字符串 |
| 配置地图 | PUT:http://mapserver/rastermap/{mapid} | 将交互前端生成的地图配置集更新到服务后台实现地图配置 |
| 删除地图 | DEL:http://mapserver/rastermap/{mapid} | 删除已有的影像地图 |
| 缓存地图瓦片 | POST:http://mapserver/tilecache/{mapid} | 生成地图的瓦片缓存,以供静态地图服务用 |
| 载入地图 | GET:http://mapserver/rastermap/{mapid} | 载入已有的地图配置 |
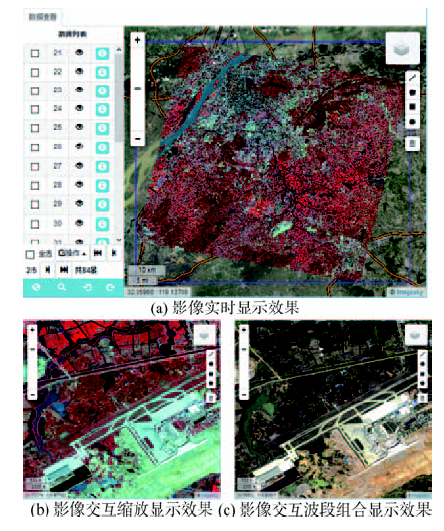
Fig. 7 Demonstration of the data real-time viewing图7 数据实时查看示范 |
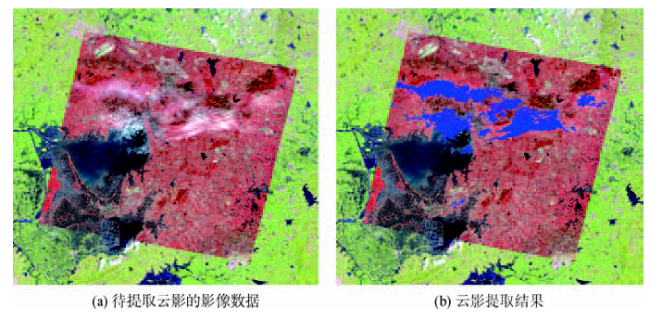
Fig. 8 Demonstration of the visual computing of remote sensing图8 遥感数据可视化计算——云影提取 |
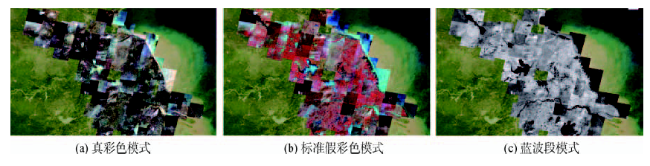
Fig. 9 Demonstration of the visual analysis of remote sensing图9 遥感数据可视化分析——波段组合 |
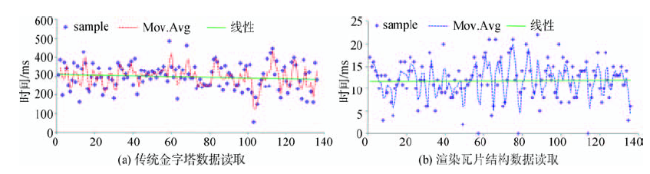
Fig. 10 Efficiency analysis of the data block reading from the rendering-tile structures图10 渲染瓦片结构数据块读取效率分析 |
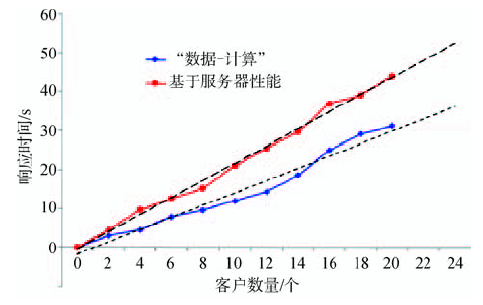
Fig. 11 Performance analysis of the storage-computing task schedule图11 “数据-计算”一致的任务调度策略的性能分析 |
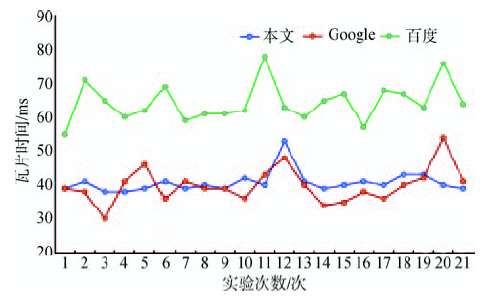
Fig. 12 Response performance of the real-time interactive visualization图12 实时交互可视化的服务响应效率分析 |
The authors have declared that no competing interests exist.
| [1] |
|
| [2] |
|
| [3] |
[
|
| [4] |
|
| [5] |
|
| [6] |
[
|
| [7] |
[
|
| [8] |
|
| [9] |
[
|
| [10] |
[
|
| [11] |
|
| [12] |
|
| [13] |
|
| [14] |
|
| [15] |
|
| [16] |
[
|
| [17] |
[
|
| [18] |
[
|
| [19] |
[
|
/
| 〈 |
|
〉 |