
北极海冰范围时空变化及其与海温气温间的数值分析
作者简介:孔爱婷(1990-),女,广东佛山人,硕士生,研究方向为地理信息系统。E-mail: aitykong@126.com
收稿日期: 2015-07-06
要求修回日期: 2015-09-18
网络出版日期: 2016-06-10
基金资助
国家自然科学基金项目(41101353)
极地环境与资源信息集成及共享服务项目(CHINARE2015-04-07)
Spatio-Temporal Variability of Arctic Sea Ice Extent and Its Numerical Analysis with Sea Surface Temperature and Air Temperature
Received date: 2015-07-06
Request revised date: 2015-09-18
Online published: 2016-06-10
Copyright
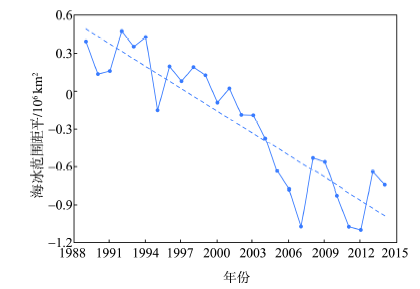
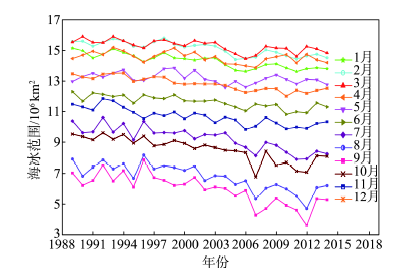
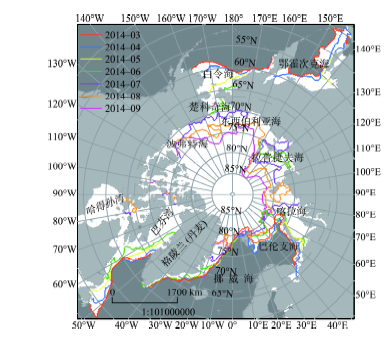
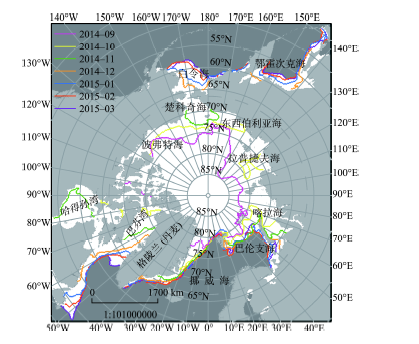
本文利用美国国家冰雪中心提供的1989-2014年海冰范围资料,分析了北极海冰范围的年际变化和季节变化规律。分析发现,北极海冰范围呈减少趋势,每年减小,夏季减少趋势显著,冬季减少趋势弱。北极海冰范围显现相对稳定的季节变化规律,海冰的结冰和融化主要发生在各个边缘海,夏季期间的海冰具有融化快、冻结快的特征。结合海温、气温数据,进行北极海冰范围与海温、气温间的数值分析,结果表明北极海冰范围变化通过影响北极海温变化进而影响北极气温变化。海冰范围的季节变化滞后于海温和气温的季节变化。基于北极考察走航海温气温数据,进行楚科奇海海冰范围线与海温气温间的数值分析,发现楚科奇海海冰范围线所在区域的海温、气温与纬度高低、离陆地远近有关。
孔爱婷 , 刘健 , 余旭 , 左菲 . 北极海冰范围时空变化及其与海温气温间的数值分析[J]. 地球信息科学学报, 2016 , 18(6) : 797 -804 . DOI: 10.3724/SP.J.1047.2016.00797
The annual and seasonal variability of Arctic sea ice extent was analyzed using of the sea ice extent data from 1989 to 2014, which was offered by the America National Snow and Ice Data Center. According to the data, it can be found that the Arctic sea ice extent decreases with an amplitude about 59 100 km2 annually. Moreover, the fastest decline occurs in summer, while the slowest decrease appears in winter. In addition, the Arctic sea ice extent shows a relatively stable seasonal variation, which exhibit the same thawing and freezing period. Arctic sea ice extent reaches its maximum value in March, undergoing the ice thawing period from April to September. It has the minimum value in September. Subsequently, it is the ice freezing period from October to March. During the summer, the sea ice reveals some featured characteristics, such as the fast thawing and sudden freezing. The Arctic sea ice thaws quickly in July and August, and freezes fast in October and November. The freezing and thawing process maps of the Arctic sea ice were made by ArcGIS software. Then, the freezing and thawing processes of the sea ice were discussed in detail. The results show that the Arctic sea ice mainly freezes and thaws in various marginal seas, including the Bering sea, Okhotsk, Beaufort Sea, Chukchi Sea, East Siberian Sea, Laptev Sea, Kara Sea, Barents Sea, Hudson B. and Baffin Bay. Finally, according to the sea surface temperature and air temperature data, the relationships among Arctic sea ice extent, sea surface temperature and air temperature were preliminarily discussed here. The results show that a change of the Arctic sea ice which affects the sea surface temperature may cause a variation of the air temperature. However, the seasonal changes of sea ice extent occur later than the seasonal changes of sea surface temperature and air temperature. The relationships among Arctic sea ice extent, sea surface temperature and air temperature in Chukotskoye More were analyzed using the sea surface temperature data and air temperature data derived from the ship-based observations. The data show that when the sea ice extent gets closer to the North Pole, the sea surface temperature and air temperature will be lower. When the sea ice extent gets closer to the land, the sea surface temperature and air temperature will be higher.
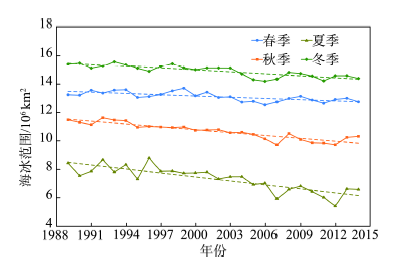
Fig. 1 Average annual anomaly variation of Arctic sea-ice extent图1 北极海冰范围年平均距平变化 |
Fig. 2 Average monthly variation of Arctic sea-ice extent图2 北极海冰范围月平均变化 |
Table 1 Linear regression of Arctic sea-ice extent表1 北极海冰范围线性回归 |
| 月份 | 斜率 | 相关系数 | 月份 | 斜率 | 相关系数 |
|---|---|---|---|---|---|
| 1 | -0.0542 | -0.8737 | 7 | -0.0862 | -0.8558 |
| 2 | -0.0491 | -0.8245 | 8 | -0.0892 | -0.7966 |
| 3 | -0.0353 | -0.6864 | 9 | -0.1056 | -0.7936 |
| 4 | -0.0224 | -0.4525 | 10 | -0.0872 | -0.8431 |
| 5 | -0.0199 | -0.4030 | 11 | -0.0632 | -0.8535 |
| 6 | -0.0444 | -0.8131 | 12 | -0.0526 | -0.9025 |
Fig. 3 Thawing process of Arctic sea-ice图3 北极海冰融化过程 |
Fig. 4 Freezing process of Arctic sea-ice图4 北极海冰冻结过程 |
Table 2 Arctic sea-ice freezing and thawing judgment表2 北极海冰冻融判断 |
| 月份 | ||||||||||||
|---|---|---|---|---|---|---|---|---|---|---|---|---|
| 1 | 2 | 3 | 4 | 5 | 6 | 7 | 8 | 9 | 10 | 11 | 12 | |
| 差值 | 1.41 | 0.71 | 0.32 | -0.63 | -1.43 | -1.47 | -3.05 | -2.03 | -0.94 | 2.81 | 2.24 | 2.20 |
Fig. 5 Seasonal variation of Arctic sea-ice extent图5 北极海冰范围季变化 |
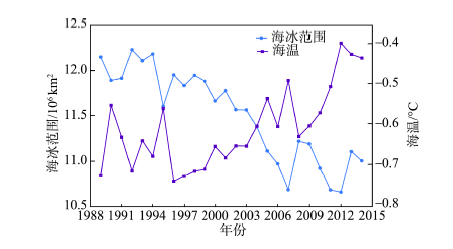
Fig. 6 The variation of Arctic sea-ice extent and sea surface temperature图6 北极海冰范围与海温的变化 |
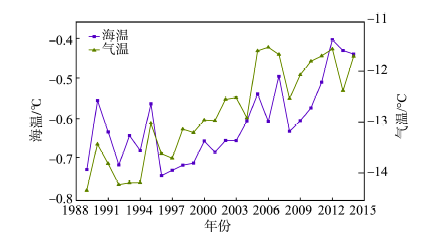
Fig. 7 The variation of sea surface temperature and air temperature图7 北极海温与气温的变化 |
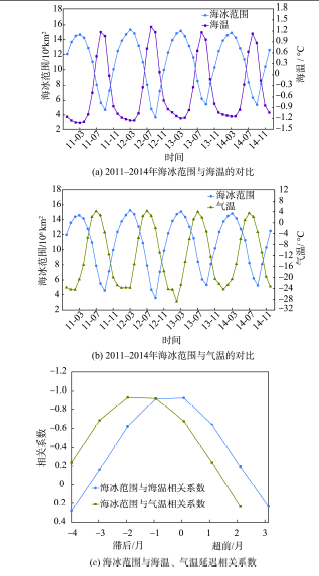
Fig. 8 The variation of Arctic sea-ice extent, sea surface temperature and air temperature图8 北极海冰范围与海温、气温的变化 |
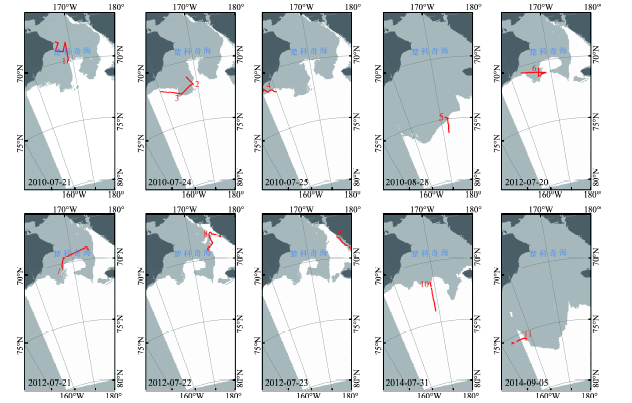
Fig. 9 Ship-based track in Chukotskoye More (the white area represents sea-ice and the red line represents the expedition track)图9 楚科奇海走航路线图(白色为海冰,红色线为走航路线) |
Tab. 3 Sea surface temperature and air temperature derived from ship-based observations表3 走航海温气温观测值 |
| 序号 | 时间 | 经度/° | 纬度/° | 海温/℃ | 气温/℃ |
|---|---|---|---|---|---|
| 1 | 2010-07-21 | -168.96 | 69.99 | 1.675 | 5.4 |
| 2 | 2010-07-24 | -168.43 | 71.97 | 0.971 | 3.1 |
| 3 | 2010-07-24 | -164.53 | 72.42 | 1.017 | 1.9 |
| 4 | 2010-07-25 | -158.20 | 71.58 | 2.175 | 5.5 |
| 5 | 2010-08-28 | -172.05 | 75.04 | -0.732 | -1.0 |
| 6 | 2012-07-20 | -167.94 | 70.92 | 0.801 | 0.8 |
| 7 | 2012-07-21 | -167.30 | 70.40 | 0.594 | 0.6 |
| 8 | 2012-07-22 | -174.39 | 68.05 | 2.251 | 6.1 |
| 9 | 2012-07-23 | -176.92 | 68.28 | 4.223 | 11.7 |
| 10 | 2014-07-31 | -169.01 | 72.23 | 1.100 | 2.6 |
| 11 | 2014-09-05 | -157.52 | 75.48 | -0.400 | -2.5 |
The authors have declared that no competing interests exist.
| [1] |
|
| [2] |
[
|
| [3] |
[
|
| [4] |
|
| [5] |
[
|
| [6] |
[
|
| [7] |
[
|
| [8] |
|
| [9] |
|
| [10] |
|
| [11] |
|
| [12] |
|
| [13] |
[
|
| [14] |
|
| [15] |
|
| [16] |
[
|
| [17] |
[
|
/
| 〈 |
|
〉 |