
闽东南沿海地区景观指数粒度效应的高分辨率遥感分析
作者简介:冉建波(1989-),男,重庆武隆人,硕士生,主要从事资源生态与遥感应用。E-mail: ran_wl@163.com
收稿日期: 2014-11-25
要求修回日期: 2015-09-09
网络出版日期: 2016-06-10
基金资助
福建省高校产学合作项目(2015Y4002)
The Effects of Changing Grain on Landscape Metrics with High-resolution Image in the South-eastern Coastal Region of Fujian
Received date: 2014-11-25
Request revised date: 2015-09-09
Online published: 2016-06-10
Copyright
以闽东南沿海地区3个流域SPOT 5影像解译所得的土地覆被类型分布图为原始矢量数据,通过优势规则聚合为一系列不同粒度大小的栅格类型图,统计各粒度下28种常用景观指数值;采用尺度检测图分析各种景观指数的粒度变化响应规律,对比中分辨率数据与高分辨率数据所建立尺度函数的差异,评价预测响应型指数尺度下推的相对误差。结果表明:闽东南沿海地区景观指数的粒度效应明显,可分为预测响应型、分段预测型、阶梯变化型和波动变化型4类,其中分段预测型指数由已有报道的预测响应型分化而来,其尺度转折点位于5 m 、7.5 m或10 m等粒度下,即高分辨率影像对景观指数粒度效应的分类有重要影响。在预测响应型指数中,高分辨率影像对ED、SHAPE_MN、CONTIG_MN和AI 4种指数的尺度函数影响较大,由中分辨率数据所建立的尺度函数进行尺度下推,会带来较大误差;这些指数的区域差异性也较大,对同一指数来说,不同区域可选用不同的尺度函数进行尺度下推。
冉建波 , 陈兴伟 . 闽东南沿海地区景观指数粒度效应的高分辨率遥感分析[J]. 地球信息科学学报, 2016 , 18(6) : 824 -832 . DOI: 10.3724/SP.J.1047.2016.00824
The effects of changing grain on landscape metrics is an important topic in landscape ecology studies. The original data in the most previous studies were derived from moderate/low resolution data and how the high-resolution data could affect the grain effect has not yet been well investigated. Therefore, we selected the land cover datasets produced from SPOT 5 imagery (with a spatial resolution of 2.5 m) in three watersheds located in the south-eastern coastal region of Fujian Province, China. We examined the behaviors of 28 landscape metrics in varying the range of grain size varing from 2.5 m to 150 m, where the grains coarser than 2.5 m were aggregated through majority filters. We then compared the differences between scaling functions fitted with the data from 2.5 m to 150 m and 30 m to 150 m. The results show that the effects of changing grain on 28 landscape metrics are obvious in the three watersheds examined. The responses of the metrics to changing grain size can be divided into four categories, while previous studies reported only three categories. The newly category is named as TypeⅡ including eight metrics that behaved split-up predictable responses with scale inflexion at 5 m, 7.5 m or 10 m respectively. This indicates that the high-resolution data can reveal more detailed effects of changing grain on landscape metrics. The results also show that the scaling functions for ED, SHAPE_MN, CONTIG_MN and AI, are sensitive to the spatial resolution of the raw data. Those scaling functions obtained from the moderate-resolution data may not be applicable to estimating the landscape metrics for grains finer than 10 m.
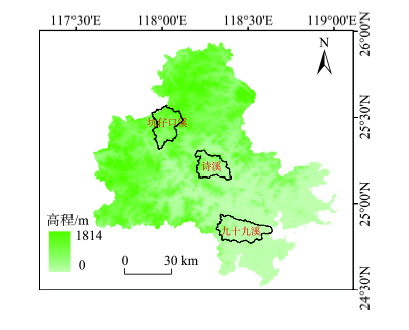
Fig. 1 The location and elevation distribution of the three watersheds in the south-eastern coast region of Fujian Province图1 闽东南沿海地区3个流域的地理位置与高程分布 |
Tab. 1 List of the 28 landscape metrics used in the study表1 景观水平上所用到的28种指数 |
| 景观指数 | 英文名称 | 缩写 | 单位 | |
|---|---|---|---|---|
| 组成特征 | 斑块密度 | Patch density | PD | 个/100 hm² |
| 边界密度 | Edge density | ED | m/hm² | |
| 最大斑块指数 | Largest patch index | LPI | % | |
| 平均斑块面积 | Patch area distribution_Mean | AREA_MN | hm² | |
| 加权平均斑块面积 | Patch area distribution_Area-weighted Mean | AREA_AM | hm² | |
| 斑块面积标准差 | Patch area distribution_Standard Deviation | AREA_SD | hm² | |
| 斑块面积变异系数 | Patch area distribution_Coeffient of Variation | AREA_CV | % | |
| 平均斑块回旋半径 | Radius of gyration | GYRATE_MN | m | |
| 加权平均斑块回旋半径 | GYRATE_AM | m | ||
| 形状特征 | 平均斑块形状指数 | Shape index distribution_Mean | SHAPE_MN | |
| 加权平均斑块形状指数 | Shape index distribution_Area-weighted Mean | SHAPE_AM | ||
| 平均斑块邻近指数 | Contiguity index distribution_Mean | CONTIG_MN | ||
| 加权平均斑块邻近指数 | Contiguity index distribution_Area-weighted Mean | CONTIG_AM | ||
| 周长面积分维数 | Perimeter-area fractal dimension index | PAFRAC | ||
| 平均周长面积比值 | Perimeter-area ratio distribution_Mean | PARA_MN | ||
| 加权平均周长面积比值 | Perimeter-area ratio distribution_Area-weighted Mean | PARA_AM | ||
| 平均斑块分维数 | Patch fractal dimension distribution_Mean | FRAC_MN | ||
| 加权平均斑块分维数 | Patch fractal dimension distribution_Area-weighted Mean | FRAC_AM | ||
| 斑块分维数标准差 | Patch fractal dimension distribution_Standard Deviation | FRAC_SD | ||
| 斑块分维数数变异系数 | Patch fractal dimension distribution_Coeffient of Variation | FRAC_CV | % | |
| 聚散性特征 | 蔓延度 | Contagion index | CONTAG | % |
| 聚合度 | Aggregation index | AI | % | |
| 散布与并列指数 | Interspersion and juxtaposition index | IJI | % | |
| 分离度 | Landscape division index | DIVISION | % | |
| 破碎度 | Splitting index | SPLIT | ||
| 多样性特征 | 香农多样性指数 | Shannon's diversity index | SHDI | |
| 辛普森多样性指数 | Simpson's diversity index | SIDI | ||
| 香农均匀度指数 | Shannon's evenness index | SHEI |
注:本文中各种景观指数按照文献[29]进行英文缩写,一些指数的缩写可能与其他文献有所差别 |
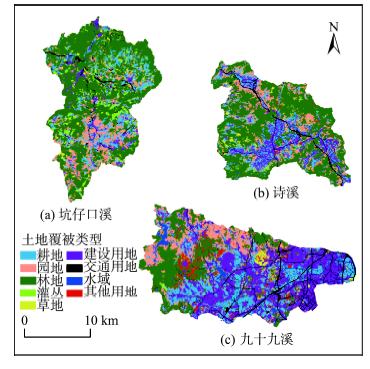
Fig. 2 The pattem of Land cover in the three watersheds图2 3个流域的土地覆盖类型图 |
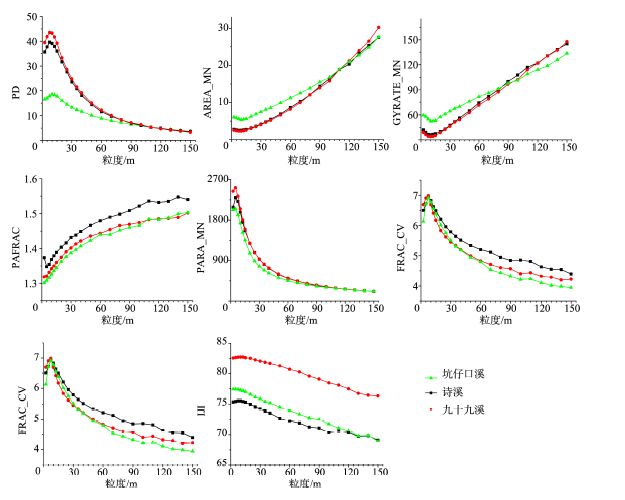
Fig. 3 Split-up predictable responses with scaling relations图3 分段预测型指数 |
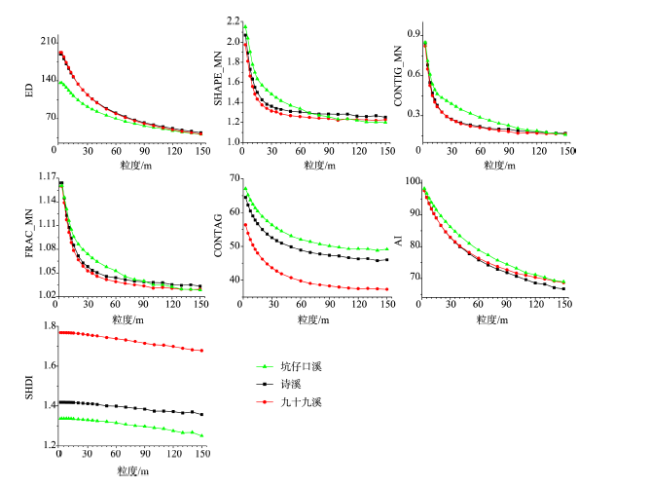
Fig. 4 Predictable responses with scaling relations图4 预测响应型指数 |
Tab. 2 Constants that characterize the TypeⅠ metrics scaling functions between 30~150 m and 2.5~150 m表2 第1类指数(TypeⅠ)在30~150 m与2.5~150 m内的拟合参数 |
| 景观指数 | 拟合 函数 | 粒度分析 范围/m | 坑仔口溪 | 诗溪 | 九十九溪 | ||||||||
|---|---|---|---|---|---|---|---|---|---|---|---|---|---|
| a | b | R² | a | b | R² | a | b | R² | |||||
| ED | 对数 | 30~150 | -31.889 | 200.463 | 1.000 | -43.729 | 260.818 | 0.996 | -44.987 | 264.643 | 0.996 | ||
| 2.5~150 | -26.682 | 178.560 | 0.972 | -40.624 | 248.552 | 0.982 | -42.196 | 253.778 | 0.983 | ||||
| SHAPE_MN | 幂函数 | 30~150 | 2.339 | -0.136 | 0.987 | 1.577 | -0.046 | 0.960 | 1.517 | -0.045 | 0.936 | ||
| 2.5~150 | 2.517 | -0.153 | 0.993 | 2.129 | -0.115 | 0.909 | 2.024 | -0.111 | 0.907 | ||||
| CONTIG_MN | 幂函数 | 30~150 | 2.907 | -0.575 | 0.990 | 0.750 | -0.301 | 0.994 | 0.799 | -0.326 | 0.982 | ||
| 2.5~150 | 1.436 | -0.414 | 0.972 | 1.165 | -0.402 | 0.985 | 1.151 | -0.409 | 0.990 | ||||
| FRAC_MN | 幂函数 | 30~150 | 1.179 | -0.028 | 0.992 | 1.104 | -0.013 | 0.968 | 1.102 | -0.014 | 0.969 | ||
| 2.5~150 | 1.197 | -0.031 | 0.993 | 1.181 | -0.029 | 0.936 | 1.176 | -0.029 | 0.938 | ||||
| CONTAG | 幂函数 | 30~150 | 75.679 | -0.090 | 0.972 | 69.552 | -0.085 | 0.986 | 59.985 | -0.098 | 0.965 | ||
| 2.5~150 | 75.487 | -0.088 | 0.985 | 71.891 | -0.092 | 0.993 | 64.261 | -0.113 | 0.989 | ||||
| AI | 对数 | 30~150 | -11.019 | 123.938 | 0.999 | -10.178 | 117.515 | 1.000 | -8.946 | 113.148 | 0.998 | ||
| 2.5~150 | -8.147 | 111.623 | 0.956 | -8.452 | 110.197 | 0.977 | -7.925 | 108.905 | 0.983 | ||||
| SHDI | 线性 | 30~150 | -0.001 | 1.352 | 0.986 | 0.000 | 1.424 | 0.973 | -0.001 | 1.778 | 0.997 | ||
| 2.5~150 | -0.001 | 1.345 | 0.977 | 0.000 | 1.422 | 0.985 | -0.001 | 1.775 | 0.995 | ||||
Tab. 3 Comparison of the TypeⅠmetrics between the estimate and actual value in high resolution表3 第1类指数(TypeⅠ)中尺度下推的估计值与其实测值之间的比较 |
| 景观指数 | 研究区 | 估计值 | 实测值 | 相对误差/(%) | ||||||||
|---|---|---|---|---|---|---|---|---|---|---|---|---|
| 2.5 m | 5 m | 10 m | 2.5 m | 5 m | 10 m | 2.5 m | 5 m | 10 m | ||||
| ED | 坑仔口溪 | 171.243 | 149.140 | 127.036 | 136.167 | 132.554 | 122.277 | 25.8 | 12.5 | 3.9 | ||
| 诗溪 | 220.756 | 190.451 | 160.147 | 189.370 | 180.905 | 162.781 | 16.6 | 5.3 | -1.6 | |||
| 九十九溪 | 223.422 | 192.239 | 161.057 | 192.410 | 184.338 | 164.612 | 16.1 | 4.3 | -2.2 | |||
| SHAPE_MN | 坑仔口溪 | 2.065 | 1.879 | 1.710 | 2.153 | 2.041 | 1.778 | -4.1 | -7.9 | -3.8 | ||
| 诗溪 | 1.512 | 1.464 | 1.419 | 2.071 | 1.893 | 1.632 | -27.0 | -22.7 | -13.1 | |||
| 九十九溪 | 1.456 | 1.411 | 1.368 | 1.976 | 1.811 | 1.559 | -26.3 | -22.1 | -12.3 | |||
| CONTIG_MN | 坑仔口溪 | 1.716 | 1.152 | 0.773 | 0.851 | 0.713 | 0.537 | 101.7 | 61.6 | 44.2 | ||
| 诗溪 | 0.569 | 0.462 | 0.375 | 0.847 | 0.679 | 0.470 | -32.8 | -32.0 | -20.2 | |||
| 九十九溪 | 0.593 | 0.473 | 0.377 | 0.823 | 0.650 | 0.452 | -28.0 | -27.3 | -16.5 | |||
| FRAC_MN | 坑仔口溪 | 1.149 | 1.127 | 1.105 | 1.161 | 1.146 | 1.116 | -1.0 | -1.6 | -1.0 | ||
| 诗溪 | 1.091 | 1.081 | 1.071 | 1.164 | 1.145 | 1.108 | -6.3 | -5.6 | -3.3 | |||
| 九十九溪 | 1.088 | 1.077 | 1.067 | 1.160 | 1.139 | 1.102 | -6.2 | -5.4 | -3.1 | |||
| CONTAG | 坑仔口溪 | 69.688 | 65.474 | 61.514 | 67.065 | 65.209 | 62.410 | 3.9 | 0.4 | -1.4 | ||
| 诗溪 | 64.341 | 60.659 | 57.189 | 64.493 | 62.219 | 58.945 | -0.2 | -2.5 | -3.0 | |||
| 九十九溪 | 54.833 | 51.232 | 47.868 | 56.338 | 53.893 | 50.406 | -2.7 | -4.9 | -5.0 | |||
| AI | 坑仔口溪 | 113.841 | 106.204 | 98.566 | 98.305 | 96.698 | 93.905 | 15.8 | 9.8 | 5.0 | ||
| 诗溪 | 108.189 | 101.134 | 94.079 | 97.642 | 95.492 | 91.883 | 10.8 | 5.9 | 2.4 | |||
| 九十九溪 | 104.951 | 98.750 | 92.549 | 97.605 | 95.409 | 91.799 | 7.5 | 3.5 | 0.8 | |||
| SHDI | 坑仔口溪 | 1.350 | 1.347 | 1.342 | 1.337 | 1.337 | 1.337 | 0.9 | 0.7 | 0.4 | ||
| 诗溪 | 1.424 | 1.424 | 1.424 | 1.418 | 1.418 | 1.418 | 0.4 | 0.4 | 0.5 | |||
| 九十九溪 | 1.776 | 1.773 | 1.768 | 1.768 | 1.768 | 1.767 | 0.4 | 0.3 | 0.0 | |||
The authors have declared that no competing interests exist.
| [1] |
[
|
| [2] |
[
|
| [3] |
[
|
| [4] |
[
|
| [5] |
|
| [6] |
|
| [7] |
|
| [8] |
|
| [9] |
|
| [10] |
|
| [11] |
|
| [12] |
|
| [13] |
|
| [14] |
|
| [15] |
|
| [16] |
|
| [17] |
|
| [18] |
|
| [19] |
|
| [20] |
[
|
| [21] |
[
|
| [22] |
[
|
| [23] |
|
| [24] |
[
|
| [25] |
|
| [26] |
[
|
| [27] |
[
|
| [28] |
[
|
| [29] |
|
| [30] |
[
|
| [31] |
|
| [32] |
|
/
| 〈 |
|
〉 |