
哈萨克斯坦生态环境状况及影响因素的遥感分析
作者简介:陈秋晓(1972-),男,博士,副教授,研究方向为GIS和遥感技术应用。E-mail: chen_qiuxiao@zju.edu.cn
收稿日期: 2015-06-11
要求修回日期: 2015-11-05
网络出版日期: 2016-07-15
基金资助
中亚干旱区生态系统模型集成及应用研究(2010DFA92720-27)
Analysis of the Eco-Environmental Condition of Kazakhstan and Its Impact Factors Using Remote Sensing Data
Received date: 2015-06-11
Request revised date: 2015-11-05
Online published: 2016-07-15
Copyright
本文利用基于TM影像所解译的土地利用数据,评价了哈萨克斯坦2000年和2010年生态环境质量状况。结果表明,哈萨克斯坦各州生态环境质量水平差异较大,整体呈现东部各州生态环境质量较高、中西部各州生态环境质量较低的空间格局,且2000-2010年哈萨克斯坦生态环境质量总体呈现变差的趋势。以基于MODIS数据所提取的归一化植被指数、地表含水量、地表温度等自然要素,以人口、GDP等社会经济要素为自变量,以生态环境质量指数为因变量建立回归模型,回归分析表明哈萨克斯坦生态环境状况主要受自然因素特别是NDVI指数的影响,因而改善哈萨克斯坦生态环境质量可从提高植被覆盖度入手。
陈秋晓 , 洪冬晨 , 侯焱 , 王彦春 . 哈萨克斯坦生态环境状况及影响因素的遥感分析[J]. 地球信息科学学报, 2016 , 18(7) : 1000 -1008 . DOI: 10.3724/SP.J.1047.216.01000
Located in the north of Central Asia, Kazakhstan is among regions having the highest fragility of eco-environment in the world. With the implementation of “the Silk Road Economic Belt and the 21st-Century Maritime Silk Road” strategy advocated by Chinese government since 2013, more attention is being paid to researches focusing on the eco-environment of this country. Utilizing the land use data interpreted by TM images with a spatial resolution of 30 meters, the Ecological Quality Indices (EQIs) of Kazakhstan in 2000 and 2010 were evaluated by considering its biological richness, vegetation coverage, water network denseness and land deterioration. The evaluation results indicated that the EQI values varied among different prefectures. The eastern states showed a relative higher level of eco-environment quality than the western ones, and an overall declining pattern of the quality level was revealed from 2000 to 2010. In order to explore the driving forces of the spatial variation of EI among prefectures, natural factors such as NDVI, Modified Surface Water Capacity Index (MSWCI) and Land Surface Temperature (LST) were retrieved from the MODIS data, and subsequently input into the linear regression model as the independent variable together with the social economic index such as population density and real GDP per capita by taking EQI as the dependent variable. Regression results indicated that EIs in Kazakhstan were mainly influenced by the natural factors, especially by NDVI which represented the vegetation coverage. Thus, the key point is to raise the vegetation coverage in order to improve the eco-environment quality in Kazakhstan.
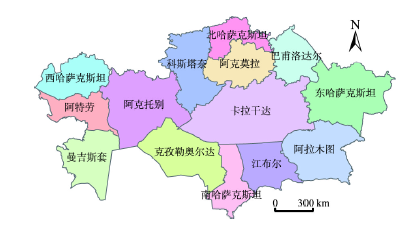
Fig.1 Administrative map of Kazakhstan图1 哈萨克斯坦行政区划图 |
Tab.1 Land use classification system表1 土地利用分类系统 |
| 一级类型 | 二级类型 | 一级类型 | 二级类型 | ||||||
|---|---|---|---|---|---|---|---|---|---|
| 编号 | 名称 | 编号 | 名称 | 编号 | 名称 | 编号 | 名称 | ||
| 1 | 耕地 | 11 | 水田 | 6 | 交通运输用地 | 61 | 铁路用地 | ||
| 12 | 水浇地 | 62 | 公路用地 | ||||||
| 13 | 旱地 | 63 | 农村用地 | ||||||
| 2 | 园地 | 20 | 园地 | 64 | 机场用地 | ||||
| 3 | 林地 | 31 | 有林地 | 7 | 水域 | 71 | 河渠 | ||
| 32 | 灌木林 | 72 | 湖泊 | ||||||
| 33 | 疏林地 | 73 | 水库坑塘 | ||||||
| 34 | 其他林地 | 74 | 永久性冰川雪地 | ||||||
| 4 | 牧草地 | 41 | 高覆盖度草地 | 75 | 滩地 | ||||
| 42 | 中覆盖度草地 | 8 | 未利用土地 | 81 | 沙漠 | ||||
| 43 | 低覆盖度草地 | 82 | 戈壁 | ||||||
| 5 | 居民点及工矿用地 | 51 | 城镇用地 | 83 | 盐碱地 | ||||
| 52 | 农村居民点 | 84 | 湿地 | ||||||
| 53 | 其他建设用地 | 85 | 裸土地 | ||||||
| 86 | 裸岩石砾地 | ||||||||
| 87 | 其他 | ||||||||
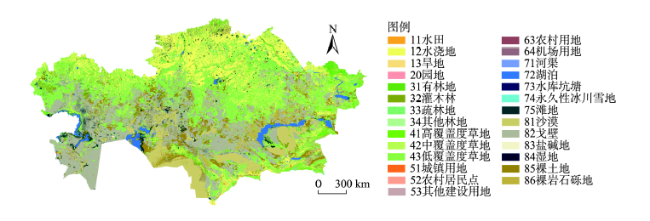
Fig.2 Land use map of Kazakhstan in 2010图2 哈萨克斯坦2010年土地利用图 |
Tab.2 Ecological Quality Index of the prefectures in Kazakhstan in 2000表2 哈萨克斯坦各州2000年生态环境质量指数 |
| 州名 | 生物丰度指数 | 植被覆盖指数 | 水网密度指数 | 退化指数 | EQI |
|---|---|---|---|---|---|
| 江布尔 | 32.43 | 35.82 | 22.78 | 52.74 | 33.18 |
| 南哈萨克斯坦 | 35.14 | 40.92 | 8.24 | 52.79 | 30.64 |
| 阿拉木图 | 73.18 | 69.10 | 100.00 | 40.29 | 77.72 |
| 曼吉斯套 | 42.41 | 12.05 | 53.76 | 72.77 | 36.71 |
| 克孜勒奥尔达 | 43.04 | 25.30 | 78.95 | 70.35 | 47.58 |
| 阿特劳 | 59.25 | 40.75 | 54.24 | 38.98 | 54.40 |
| 卡拉干达 | 46.57 | 52.97 | 20.44 | 40.38 | 42.62 |
| 东哈萨克斯坦 | 86.28 | 95.42 | 40.86 | 18.49 | 73.53 |
| 阿克托别 | 43.87 | 46.18 | 10.11 | 34.33 | 38.56 |
| 西哈萨克斯坦 | 74.64 | 82.51 | 13.60 | 6.22 | 61.73 |
| 阿克莫拉 | 84.82 | 91.68 | 25.69 | 12.88 | 68.91 |
| 巴甫洛达尔 | 77.34 | 84.55 | 22.08 | 10.48 | 64.64 |
| 科斯塔奈 | 70.27 | 75.72 | 21.44 | 14.11 | 59.83 |
| 北哈萨克斯坦 | 100.00 | 100.00 | 33.71 | 0.00 | 80.11 |
Tab.3 Ecological Quality Index of the prefectures in Kazakhstan in 2010表3 哈萨克斯坦各州2010年生态环境质量指数 |
| 州名 | 生物丰度指数 | 植被覆盖指数 | 水网密度指数 | 退化指数 | EQI |
|---|---|---|---|---|---|
| 江布尔 | 41.72 | 44.31 | 22.70 | 38.16 | 40.56 |
| 南哈萨克斯坦 | 42.30 | 42.54 | 14.94 | 37.76 | 38.13 |
| 阿拉木图 | 72.90 | 61.60 | 100 | 23.16 | 79.56 |
| 曼吉斯套 | 37.82 | 9.45 | 21.89 | 63.42 | 27.12 |
| 克孜勒奥尔达 | 38.79 | 26.29 | 43.46 | 60.30 | 37.87 |
| 阿特劳 | 53.41 | 27.92 | 33.74 | 43.79 | 42.97 |
| 卡拉干达 | 47.56 | 51.40 | 21.44 | 34.46 | 44.09 |
| 东哈萨克斯坦 | 94.74 | 99.41 | 42.11 | 0.00 | 80.94 |
| 阿克托别 | 38.60 | 36.78 | 5.44 | 38.72 | 32.82 |
| 西哈萨克斯坦 | 57.12 | 57.90 | 9.69 | 19.27 | 47.77 |
| 阿克莫拉 | 79.53 | 79.91 | 21.60 | 18.15 | 62.69 |
| 巴甫洛达尔 | 73.29 | 76.66 | 18.93 | 15.67 | 59.86 |
| 科斯塔奈 | 61.01 | 61.15 | 12.27 | 24.14 | 49.39 |
| 北哈萨克斯坦 | 100.00 | 100.00 | 26.59 | 3.93 | 77.19 |
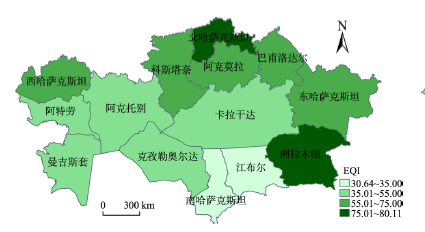
Fig.3 Ecological environmental quality grading diagram of Kazakhstan in 2000图3 2000年哈萨克斯坦生态环境质量分级图 |
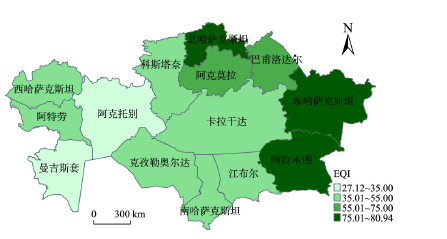
Fig.4 Ecological environmental quality grading diagram of Kazakhstan in 2010图4 2010年哈萨克斯坦生态环境质量分级图 |
Tab.4 Variation of Ecological Quality Index between 2000 and 2010表4 哈萨克斯坦各州2000-2010年生态环境质量变化情况 |
| 州名 | 2000年 | 2010年 | EQI变化值 | 变化幅度分级 | |||
|---|---|---|---|---|---|---|---|
| EQI | 生态环境状况分级 | EQI | 生态环境状况分级 | ||||
| 江布尔 | 33.18 | 较差 | 40.56 | 一般 | 7.38 | 明显变好 | |
| 南哈萨克斯坦 | 30.64 | 较差 | 38.13 | 一般 | 7.49 | 明显变好 | |
| 阿拉木图 | 77.72 | 优 | 79.56 | 优 | 1.84 | 无明显变化 | |
| 曼吉斯套 | 36.71 | 一般 | 27.12 | 较差 | -9.59 | 明显变差 | |
| 克孜勒奥尔达 | 47.58 | 一般 | 37.87 | 一般 | -9.71 | 明显变差 | |
| 阿特劳 | 54.40 | 一般 | 42.97 | 一般 | -11.43 | 显著变差 | |
| 卡拉干达 | 42.62 | 一般 | 44.09 | 一般 | 1.47 | 无明显变化 | |
| 东哈萨克斯坦 | 73.53 | 良 | 80.94 | 优 | 7.41 | 明显变好 | |
| 阿克托别 | 38.56 | 一般 | 32.82 | 较差 | -5.74 | 明显变差 | |
| 西哈萨克斯坦 | 61.73 | 良 | 47.77 | 一般 | -13.96 | 显著变差 | |
| 阿克莫拉 | 68.91 | 良 | 62.69 | 良 | -6.22 | 明显变差 | |
| 巴甫洛达尔 | 64.64 | 良 | 59.86 | 良 | -4.78 | 略有变差 | |
| 科斯塔奈 | 59.83 | 良 | 49.39 | 一般 | -10.44 | 显著变差 | |
| 北哈萨克斯坦 | 80.11 | 优 | 77.19 | 优 | -2.92 | 略有变差 | |
Tab.5 Ecological Quality Index and its impact factors表5 哈萨克斯坦各州生态环境质量及其影响因子数据汇总 |
| 州名 | DEM | LST | MSWCI | NDVI | 人口密度/(人/km2) | 人均GDP/万美元 | 2010年EQI |
|---|---|---|---|---|---|---|---|
| 江布尔 | 518.59 | 349.93 | 57.41 | 2352.07 | 7.19 | 0.320 | 40.56 |
| 南哈萨克斯坦 | 384.09 | 387.51 | 57.94 | 2368.93 | 21.61 | 0.321 | 38.13 |
| 阿拉木图* | 882.47 | 292.56 | 61.63 | 2920.35 | 14.45 | 1.158 | 79.56 |
| 曼吉斯套 | 92.86 | 295.37 | 54.42 | 1389.14 | 2.95 | 1.877 | 27.12 |
| 克孜勒奥尔达 | 108.58 | 338.87 | 48.83 | 1512.03 | 3.05 | 0.839 | 37.87 |
| 阿特劳 | -1.87 | 264.75 | 59.78 | 2124.42 | 4.49 | 3.422 | 42.97 |
| 卡拉干达 | 486.41 | 323.75 | 62.73 | 2496.47 | 3.16 | 0.981 | 44.09 |
| 东哈萨克斯坦 | 731.65 | 243.61 | 73.01 | 3790.32 | 4.96 | 0.634 | 80.94 |
| 阿克托别 | 193.56 | 320.08 | 61.05 | 2325.80 | 2.55 | 1.011 | 32.82 |
| 西哈萨克斯坦 | 29.41 | 360.51 | 67.22 | 3061.44 | 4.00 | 1.184 | 47.77 |
| 阿克莫拉** | 320.49 | 306.35 | 66.96 | 3116.66 | 9.12 | 1.583 | 62.69 |
| 巴甫洛达尔 | 188.78 | 303.83 | 69.49 | 3196.04 | 5.97 | 1.044 | 59.86 |
| 科斯塔奈 | 197.32 | 313.03 | 63.82 | 2876.44 | 4.55 | 0.674 | 49.39 |
| 北哈萨克斯坦 | 164.21 | 293.43 | 70.87 | 3632.70 | 6.13 | 0.545 | 77.19 |
注:*计入阿拉木图市;**计入阿斯塔纳市 |
The authors have declared that no competing interests exist.
| [1] |
[
|
| [2] |
|
| [3] |
|
| [4] |
|
| [5] |
[
|
| [6] |
[
|
| [7] |
[
|
| [8] |
|
| [9] |
|
| [10] |
|
| [11] |
|
| [12] |
[
|
| [13] |
HJ/T 192-2006, 生态环境状况评价技术规范(试行)[S]. 2006.
[ HJ/T 192-2006, Technical criterion for eco-environmental status evaluation[S]. 2006. ]
|
| [14] |
[
|
| [15] |
[
|
| [16] |
|
| [17] |
[
|
| [18] |
|
| [19] |
[
|
| [20] |
[
|
| [21] |
[
|
| [22] |
[
|
| [23] |
[
|
| [24] |
[
|
/
| 〈 |
|
〉 |