
基于夜间灯光和人口密度数据的京津冀GDP空间化对比
作者简介:王旭(1992-), 男, 硕士生, 研究方向为自然灾害经济损失评估。E-mail: wangxu2015@mail.bnu.edu.cn
收稿日期: 2015-12-04
要求修回日期: 2016-03-31
网络出版日期: 2016-07-15
基金资助
国家重大科学研究计划项目(2012CB955402)
国家自然科学基金项目(41571492)
教育部-国家外国专家局高等学校创新引智计划(B08008)
Comparison of GDP Spatialization in Beijing-Tianjin-Hebei Based on Night Light and Population Density Data
Received date: 2015-12-04
Request revised date: 2016-03-31
Online published: 2016-07-15
Copyright
国内生产总值(GDP)是衡量地区经济发展水平的重要指标,GDP的空间化可以为灾害风险分析等多学科交叉研究提供基础数据。空间化代用数据的选择是社会经济统计数据空间化的关键,本文以京津冀地区作为研究区,将夜间灯光、全球人口密度(LandScan)和亚洲人口密度(AsiaPop)空间分布信息作为代用数据,将市级GDP统计数据空间展布到栅格单元,以绝对误差、相对误差和均方根误差为指标,利用县级统计数据对展布结果进行误差分析,并对比3种数据对GDP空间模拟的表达效果。结果表明:相对于夜间灯光和LandScan数据,AsiaPop模拟得到的综合误差最小;基于夜间灯光和LandScan的GDP空间展布误差格局比较接近,即存在经济较发达的市辖区GDP值被低估、市郊区县GDP被高估的误差“两极区”倾向,而基于AsiaPop的GDP空间展布误差格局与经济发展水平关系不密切。因此,利用单一代用数据很难合理地反映经济活动的空间分布,综合夜间灯光、人口密度、道路和建筑物等多源空间数据是提高GDP空间展布精度的发展趋势。
王旭 , 吴吉东 , 王海 , 李宁 . 基于夜间灯光和人口密度数据的京津冀GDP空间化对比[J]. 地球信息科学学报, 2016 , 18(7) : 969 -976 . DOI: 10.3724/SP.J.1047.2016.00969
As an important indicator in measuring the economic development level of a region, GDP spatialization is of great significance to study the socio-economic heterogeneity. The ancillary spatial density data selection is the key technique in controlling the GDP spatialization′s accuracy. In this paper, the prefectural GDP statistics is distributed to grid cells according to the spatial distribution information of GDP such as the population density (LandScan, AsiaPop) and night light data in Beijing-Tianjin-Hebei. Moreover, the absolute errors and relative errors of the GDP disaggregation at county-level are both calculated in order to compare the errors among the three different ancillary data as mentioned above. These results can provide a reasonable reference to ancillary spatial density data selection in GDP disaggregation. The results show that, the spatial distributions of the three types of ancillary spatial density data for GDP have revealed their own advantages and disadvantages. Comparing with both of the night light and the LandScan data, the AsiaPop simulation generally has the smallest error, especially in the suburban districts and rural areas of Beijing where the GDP tends to be overestimated, while the GDP is often underestimated in the economically developed city centers. For the LandScan simulation, six counties have presented a relative error of more than 200%, as the LandScan data are concentrated in Beijing and Tianjin, while the suburban districts and counties have also been overestimated. The AsiaPop simulation has only three counties (which locate in Tianjin) presenting a relative error being more than 200%. Because of the spatial heterogeneity of the economic activities, the GDP disaggregation error will increase with respect to the refinement of the administrative units, therefore, using the single-generation data to reasonably reflect the spatial distribution of economic activities is difficult, we need to take advantage of the distribution data such as the night light, roads, housing distribution and cell phone signals to improve the GDP disaggregation′s accuracy in future, and to reflects the GDP distribution characteristics in a more detailed manner. High-quality exposure data not only provide the basic data for the study of spatial analysis of natural disaster risk, but also provide a reference for other multidisciplinary research fields; meanwhile, the comprehensive application of using both the multi-source remote sensing data and the statistics data is the trend for socio-economic data spatialization.
Key words: GDP spatialization; Beijing-Tianjin-Hebei; night light; population density
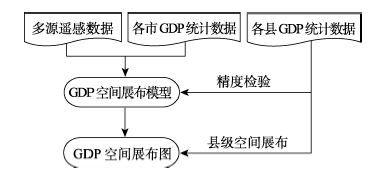
Fig.1 Flow chart of GDP spatialization图1 GDP空间化技术流程图 |
Tab.1 Introduction of the data used in this study表1 本文使用的数据信息表 |
| 数据名称 | 数据类型 | 空间分辨率 | 年份 | 基础数据依据 | 数据来源 |
|---|---|---|---|---|---|
| AsiaPop | 栅格 | 0.00083333°(赤道约100 m) | 2010 | 人口调查数据、卫星遥感数据、手机网络信号等 | www.worldpop.org.uk[23] |
| LandScan | 栅格 | 0.0083333°(赤道约1 km) | 2010 | 土地利用类型、夜间灯光、道路、坡度等 | ORNL[24] |
| 夜间灯光 | 栅格 | 0.0083333°(赤道约1 km) | 2012 | 夜间灯光灰度值 | NOAA |
| GDP/人均GDP | 统计 | 市级、县级 | 2013 | — | 国家统计局[25] |
| 行政区底图 | 矢量 | 市级、县级 | 2010 | — | 国家基础地理信息中心 |
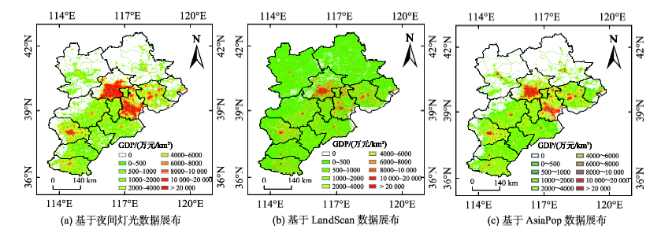
Fig.2 GDP spatialization results of the Beijing-Tianjin-Hebei region based on different ancillary data in 2013图2 基于不同代用数据的2013年京津冀地区GDP空间化结果 |
Tab.2 Comparison of the GDP spatialization errors based on different ancillary data表2 基于不同代用数据的GDP空间化模拟结果误差对比 |
| 数据展布 | 绝对误差的中位数 | E的均值[最值] | E的方差 | 平均绝对偏差 | RMSE |
|---|---|---|---|---|---|
| 夜间灯光 | 228 510 | 0.42 [-0.95, 5.44] | 0.80 | 0.59 | 6 165 793 |
| LandScan | 260 094 | 0.41 [-0.73, 5.75] | 0.61 | 0.52 | 5 331 930 |
| AsiaPop | 214 947 | 0.27 [-0.98, 3.48] | 0.40 | 0.46 | 4 623 166 |
Tab.3 Extreme-value statistics of the GDP spatialization errors based on different ancillary data表3 基于不同代用数据的GDP空间化模拟误差极值统计 |
| 误差项 | 夜间灯光数据 | LandScan数据 | AsiaPop数据 | ||||||||
|---|---|---|---|---|---|---|---|---|---|---|---|
| 县区名 | E | 人均GDP/万元 | 县区名 | E | 人均GDP/万元 | 县区名 | E | 人均GDP/万元 | |||
| GDP被高估的前10个县区 | 延庆县 | 5.44 | 2.92 | 红桥区* | 5.75 | 2.72 | 红桥区* | 3.48 | 2.72 | ||
| 通州区 | 3.36 | 3.77 | 河东区* | 3.68 | 2.94 | 河东区* | 3.05 | 2.94 | |||
| 大兴区 | 3.29 | 2.86 | 蓟县 | 3.21 | 3.49 | 河北区* | 2.05 | 3.94 | |||
| 平谷区 | 3.21 | 4.00 | 延庆县 | 2.86 | 2.92 | 蓟县 | 1.83 | 3.49 | |||
| 密云县 | 3.15 | 4.10 | 河北区* | 2.36 | 3.94 | 大兴区 | 1.79 | 2.86 | |||
| 门头沟区 | 2.90 | 4.10 | 平谷区 | 2.03 | 4.00 | 昌平区 | 1.72 | 2.95 | |||
| 昌平区 | 2.57 | 2.95 | 门头沟区 | 1.86 | 4.10 | 曲阳县 | 1.66 | 1.00 | |||
| 房山区 | 2.53 | 4.77 | 密云县 | 1.84 | 4.10 | 威县 | 1.25 | 0.88 | |||
| 怀柔区 | 2.51 | 5.25 | 海兴县 | 1.74 | 1.46 | 魏县 | 1.22 | 1.24 | |||
| 静海县 | 2.34 | 6.71 | 曲阳县 | 1.48 | 1.00 | 唐县 | 1.19 | 1.06 | |||
| GDP被低估的前10个县区 | 和平区* | -0.95 | 18.87 | 滨海新区 | -0.73 | 28.78 | 康保县 | -0.98 | 1.52 | ||
| 西城区* | -0.94 | 21.69 | 保定市辖区* | -0.69 | 5.76 | 赤城县 | -0.90 | 2.38 | |||
| 东城区* | -0.92 | 17.28 | 沧州市辖区* | -0.66 | 15.52 | 沽源县 | -0.88 | 1.72 | |||
| 河西区* | -0.81 | 6.77 | 西城区* | -0.65 | 21.69 | 尚义县 | -0.81 | 1.66 | |||
| 南开区* | -0.79 | 5.21 | 宽城满族自治县 | -0.61 | 8.56 | 崇礼县 | -0.73 | 3.07 | |||
| 保定市辖区* | -0.76 | 5.76 | 衡水市辖区* | -0.57 | 5.40 | 丰宁满族自治县 | -0.69 | 2.15 | |||
| 沧州市辖区* | -0.75 | 15.52 | 津南区* | -0.57 | 8.83 | 保定市辖区* | -0.67 | 5.76 | |||
| 河北区* | -0.74 | 3.94 | 武安市 | -0.56 | 7.34 | 宽城满族自治县 | -0.63 | 8.56 | |||
| 邢台市辖区* | -0.74 | 5.61 | 沙河市 | -0.52 | 5.00 | 滨海新区 | -0.62 | 28.78 | |||
| 海淀区* | -0.66 | 10.72 | 邢台市辖区* | -0.51 | 5.61 | 张北县 | -0.61 | 2.11 | |||
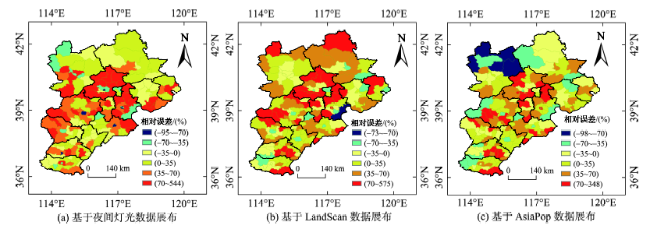
Fig.3 Relative error distribution of the GDP spatialization based on different ancillary data in Beijing-Tianjin-Hebei图3 基于不同代用数据的京津冀GDP空间展布相对误差分布图 |
The authors have declared that no competing interests exist.
| [1] |
[
|
| [2] |
[
|
| [3] |
[
|
| [4] |
[
|
| [5] |
[
|
| [6] |
[
|
| [7] |
|
| [8] |
|
| [9] |
|
| [10] |
[
|
| [11] |
[
|
| [12] |
[
|
| [13] |
[
|
| [14] |
[
|
| [15] |
[
|
| [16] |
[
|
| [17] |
|
| [18] |
|
| [19] |
|
| [20] |
|
| [21] |
|
| [22] |
|
| [23] |
|
| [24] |
|
| [25] |
国家统计局.中国统计年鉴2014[M].北京:中国统计出版社,2014.
[ National Bureau of Statistics of the People's Republic of China. China statistical yearbook 2014[M]. Beijing: China Statistics Press, 2014. ]
|
| [26] |
[
|
| [27] |
[
|
| [28] |
[
|
| [29] |
[
|
| [30] |
[
|
| [31] |
[
|
| [32] |
[
|
| [33] |
[
|
| [34] |
[
|
| [35] |
[
|
/
| 〈 |
|
〉 |