
黑河中游地区作物用水效率比较及种植结构调整方向研究
作者简介:郑璐倩(1991-),女,硕士生,主要从事土地利用/覆被变化及其环境效应研究。E-mail: zhenglq.13s@igsnrr.ac.cn
收稿日期: 2015-07-09
要求修回日期: 2015-10-01
网络出版日期: 2016-07-15
基金资助
国家自然科学基金重大研究计划项目(91325302)
国家自然科学基金重大国际合作项目(41161140352)
国家自然科学基金面上项目(41271119)
A Comparative Study of Water Use Efficiency of Different Crops in the Middle Reaches of Heihe River and Its Implications for Planting Structure Adjustment
Received date: 2015-07-09
Request revised date: 2015-10-01
Online published: 2016-07-15
Copyright
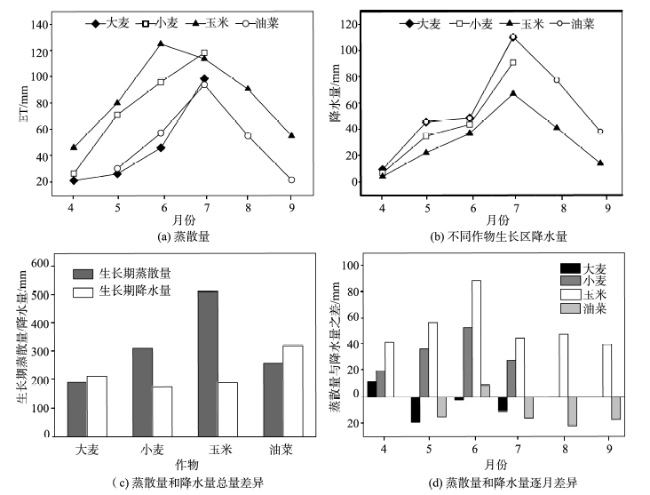
黑河流域地处西北干旱区,水资源短缺是限制其中游绿洲农业发展、下游生态环境保护的首要原因。该流域的中游绿洲农业用水约占总用水量的80%,因此农业节水对流域发展至关重要。在干旱区绿洲农业节水探索中,众多学者主张通过节水技术来提高用水效率,而关于农业种植结构调整对农业节水影响的定量研究较少。本文采用2012年黑河流域蒸散发数据、土地利用数据、降水数据和农业经济统计数据,定量分析黑河中游主要作物需水特征和用水效率差异,尝试从调整作物种植结构角度为其绿洲农业节水提供依据。结果表明:(1)研究区4种主要作物中,玉米生长期需水量最大,其次为小麦、油菜和大麦;(2)考虑降水补给,发现大麦和油菜生长需水可很大程度上依赖降水,而小麦和玉米则需要灌溉,且玉米灌溉需水量远超小麦;(3)作物用水效率由高到低依次为大麦、油菜、小麦和玉米。从用水效率角度而言,考虑种植区位,在黑河中游适当扩大小麦种植规模更有利于提高中游农业用水效率。
郑璐倩 , 谈明洪 . 黑河中游地区作物用水效率比较及种植结构调整方向研究[J]. 地球信息科学学报, 2016 , 18(7) : 977 -986 . DOI: 10.3724/SP.J.1047.2016.00977
The Heihe River Basin is located in the northwest arid region of China. Water shortage is the primary restrictive factor for oasis agriculture development and ecological environment protection in this region. Since the water consumed by the oasis agriculture in the middle reaches occupies about 80% of the total water resources in this basin, how to efficiently use the agricultural water resources is the key factor affecting the regional development. In the exploration of agricultural water saving measures in the arid region, most scholars advocate to improve the water use efficiency (WUE) through water-saving techniques. However, there are few quantitative studies focusing on the water saving effect of planting structure adjustment. This study takes the adjustment of agricultural planting structure as a breakthrough point to achieve the goal of agricultural water saving, considering that different crops have different water demands. We aim to explore the characteristics of the water demands of the main crops in the middle reaches of Heihe River and examine the different levels of WUE for those crops. In this paper, with the help of ArcGIS technique and based on the evapotranspiration (ET) data of Heihe River Basin and crop spatial distribution data, we extracted the ET information of the main crops during their growing seasons in 2012, which was represented as the water requirement of crop. Then, the crop ET data and crop yield data were used to calculate the WUE of four main crops. The results show that: (1) maize has the largest ET during its growing seasons, followed by wheat, rapeseed and barley; (2) considering the case of precipitation recharge, the water demands of barley and rapeseed may largely depend on rainfall, while maize and wheat require irrigation instead, and maize needs more water than wheat; (3) the WUE of crops ranking from high to low is barley, rapeseed, wheat and maize. This study argues that the appropriate increase in the size of wheat planting is helpful to improve the efficiency of agricultural water in the middle reaches of Heihe River.
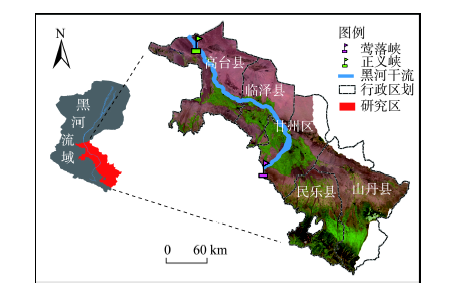
Fig. 1 The location of the study area图1 研究区示意图 |
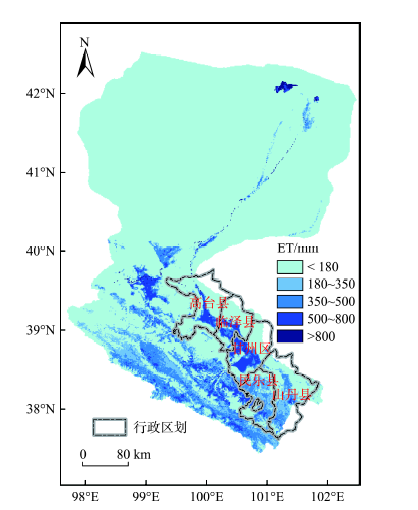
Fig. 2 Evapotranspiration data of 2012图2 2012年蒸散量图 |
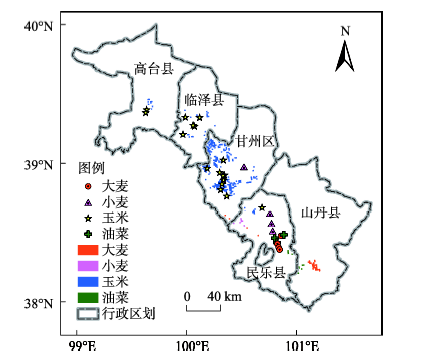
Fig. 3 The distribution of crop samples图3 作物采点及样本分布图 |
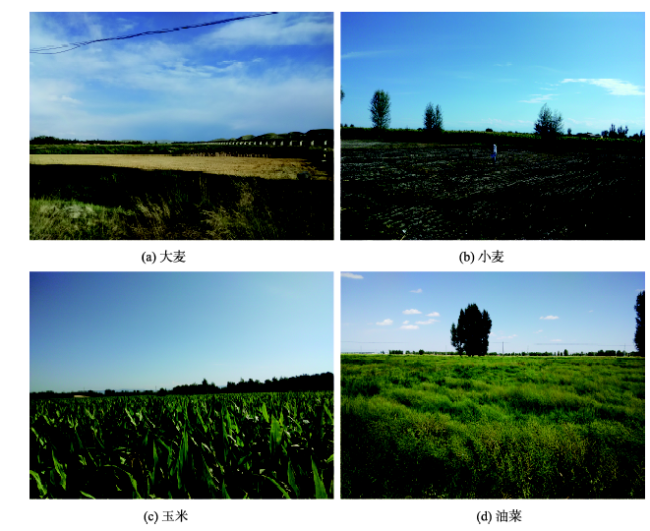
Fig. 4 Some field samples of crops图4 实地样本 |
Tab. 1 Yields and prices of different crops表1 不同作物产量及价格 |
| 指标 | 作物 | |||
|---|---|---|---|---|
| 大麦 | 小麦 | 玉米 | 油菜 | |
| 产量/(kg/hm2) | 6349.50 | 6189.75 | 7656.75 | 3051.60 |
| 价格/(元/kg) | 2.30 | 2.04 | 2.42 | 5.00 |
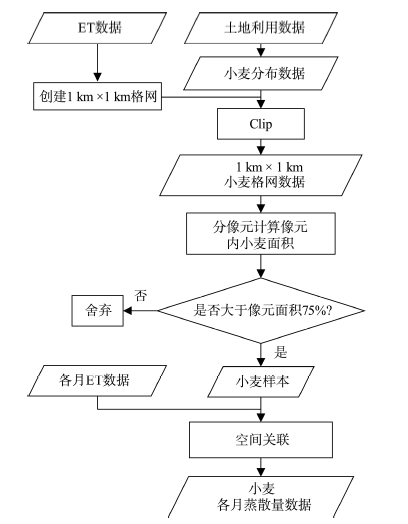
Fig. 5 The technical flowchart of crop evapotranspiration extraction图5 作物蒸散量提取技术流程(以小麦为例) |
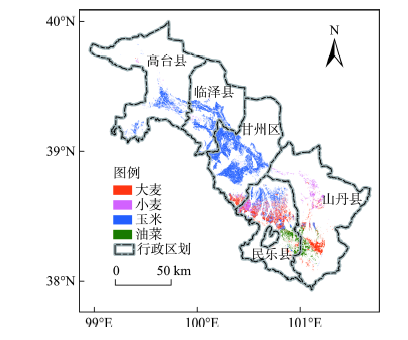
Fig. 6 The distribution of main crops in the study area图6 研究区主要作物分布图 |
Fig. 7 Evapotranspiration, precipitation and their relationship of crops during the growing seasons图7 作物生长期蒸散量、降水量及其关系 |
Tab. 2 Water use efficiencies of different crops表2 不同作物用水效率 |
| 作物 | 指标 | |||
|---|---|---|---|---|
| 产量(Y)/(kg/hm2) | 生长期需水(ET)/mm | 价格(P)/(元/kg) | 用水效率(WUEe)/(元/m3) | |
| 大麦 | 6349.50 | 192.92 | 2.30 | 7.57 |
| 油菜 | 3051.60 | 260.34 | 5.00 | 5.86 |
| 小麦 | 6189.75 | 314.29 | 2.04 | 4.02 |
| 玉米 | 7656.75 | 514.03 | 2.42 | 3.60 |
The authors have declared that no competing interests exist.
| [1] |
[
|
| [2] |
[
|
| [3] |
[
|
| [4] |
|
| [5] |
[
|
| [6] |
|
| [7] |
|
| [8] |
|
| [9] |
[
|
| [10] |
[
|
| [11] |
[
|
| [12] |
[
|
| [13] |
[
|
| [14] |
[
|
| [15] |
[
|
| [16] |
[
|
| [17] |
[
|
| [18] |
|
| [19] |
张掖市统计局,国家统计局张掖调查队.张掖统计年鉴2012[M].张掖:张掖市统计局,2013.
[
|
| [20] |
张掖市水务局.2012年张掖市水利管理年报[R].张掖: 张掖市水务局,2013.
[ Zhangye Municipal Water Affairs Bureau. Zhangye Municipal Water Conservancy Management Annual Report of 2012[M]. Zhangye: Zhangye Municipal Water Affairs Bureau, 2013. ]
|
| [21] |
|
| [22] |
|
| [23] |
|
| [24] |
[
|
| [25] |
[
|
| [26] |
|
| [27] |
[
|
| [28] |
|
| [29] |
|
| [30] |
[
|
| [31] |
[
|
| [32] |
[
|
| [33] |
[
|
| [34] |
[
|
| [35] |
[
|
| [36] |
[
|
| [37] |
|
| [38] |
[
|
| [39] |
|
| [40] |
|
| [41] |
[
|
| [42] |
[
|
| [43] |
[
|
| [44] |
[
|
| [45] |
[
|
| [46] |
[
|
| [47] |
[
|
| [48] |
[
|
/
| 〈 |
|
〉 |