
1954-2014年云南省降水变化特征与潜在的旱涝区域响应
作者简介:刘佳旭(1990-),男,辽宁铁岭人,博士生,研究方向为水文水资源。E-mail:liujx.12b@igsnrr.ac.cn
收稿日期: 2015-08-03
要求修回日期: 2015-09-11
网络出版日期: 2016-08-10
基金资助
国家科技重大专项专题(2013ZX07102-006-04)
国家自然科学基金项目(91547114)
Characteristics of Precipitation Variation and Potential Drought-Flood Regional Responses in Yunnan Province From 1954 to 2014
Received date: 2015-08-03
Request revised date: 2015-09-11
Online published: 2016-08-10
Copyright
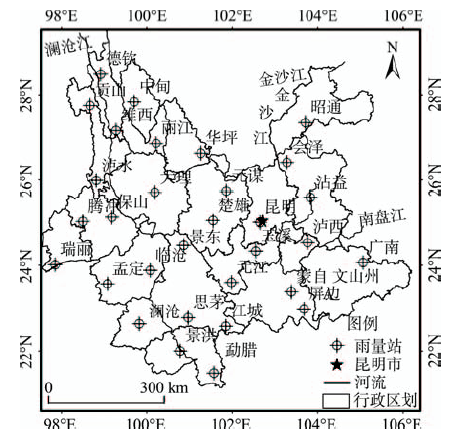
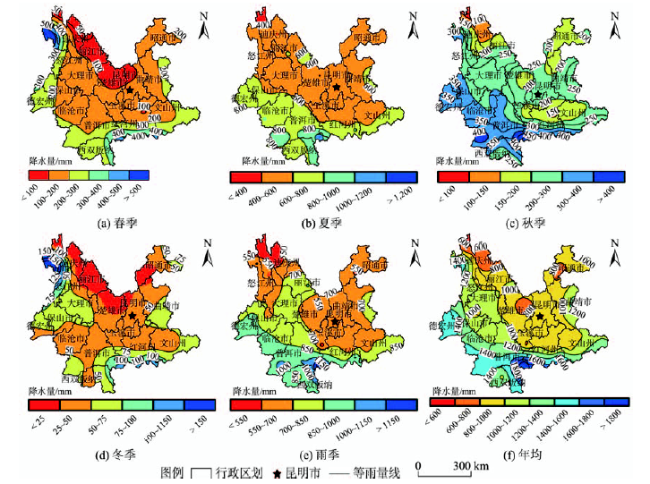
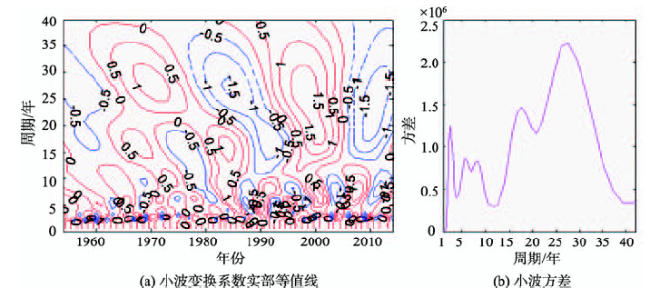
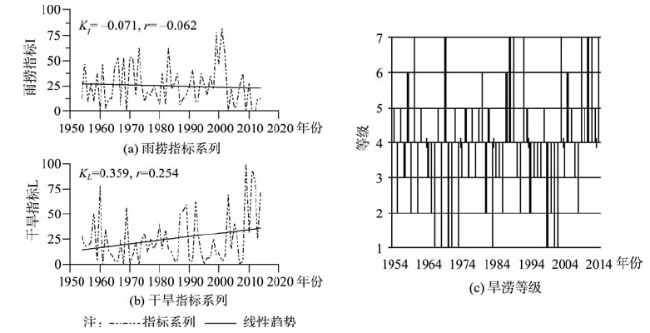
本文基于云南省1954-2014年32个气象站点逐月降水量资料,采用线性倾向估计法、径向基函数空间插值法、小波分析法、R/S分析法、Z指数法,分析了61年的云南省降水序列、旱涝情态的时间特征和空间格局。结果表明:在此期间除春季外,其余各季节降水量均呈现减少态势,年降水量总体以8.1 mm/10 a的速率减少,并且在未来一段时间内将保持减少趋势。多年平均降水量由云南省南部的西双版纳州向西北部的丽江市-迪庆州一带逐步减少;年降水量存在准2 a、准6 a、准8 a、准18 a、准28 a的周期性特征,且以准28 a为主周期;干旱化趋势增加速率较快(KL=0.359),印证了降水减少态势,洪涝化趋势减小速率相对较慢(KI= -0.071);旱灾易发地区主要涉及5个州,分别为迪庆州、德宏州、西双版纳州、红河州、楚雄州;洪涝易发地区涉及3州2市,依次为怒江州、大理州、文山州、普洱市及邵通市。
刘佳旭 , 李丽娟 , 李九一 , 王志勇 , 陈素景 , 张凯 . 1954-2014年云南省降水变化特征与潜在的旱涝区域响应[J]. 地球信息科学学报, 2016 , 18(8) : 1077 -1086 . DOI: 10.3724/SP.J.1047.2016.01077
Analyzing the characteristics of spatio-temporal variability of precipitation is very important to prepare against droughts and floods. Based on the monthly rainfall data from 1954 to 2014 collected from 32 meteorological sites in Yunnan province, the spatio-temporal variability of the precipitation and drought-flood regional responses were analyzed using the linear regression, RBF spatial interpolation, wavelet analysis, R/S analysis and Z-index. The results show that the precipitation of 3 seasons, except for the spring, has indicated a fluctuant downward trend, and the annual rainfall tends to decrease at a rate of 8.1 mm/10a in the last 61 years in Yunnan province, moreover, the results of wavelet analysis and Hurst index reveal that the precipitation will maintain a decreasing trend in the future. The average annual rainfall decreases gradually from Xishuangbanna to Lijiang-Diqing. Furthermore, the historical precipitation has a primarily downward trend, while secondly an increasing trend in partial areas. Interestingly, the spatial distribution of the decreasing trend has shown a characteristic of symmetry, but the spatial distribution of the increasing trend seems randomly scattered. The periodic oscillation of the annual rainfall is concentrated in the expectant of 2 years, 6 years, 8 years, 18 years and 28 years, and especially in expectant 28 years it has the strongest energy. The rate of drought trend (KL=0.359) is faster than that of flood trend (KI= -0.071), and the downward trend of the annual precipitation can also explain this phenomenon There are 5 sub-prefectures that the droughts appear more often than the other states in Yunnan province, and which are Diqing, Dehong, Xishuangbanna, Honghe and Chuxiong. In addition, there are 3 sub-prefectures and 2 cities where floods appear frequently, which are Nujiang, Dali, Wenshan, Puer and Shaotong.
Key words: precipitation; drought-flood; wavelet analysis; Z-Index; R/S analysis; Yunnan province
Fig. 1 Basin profile and the distribution of meteorological stations in the study area图1 研究区概况及气象站分布 |
Tab. 1 Drought-flood level indicators表1 旱涝等级指标 |
| 单站等级指标 | 区域等级指标 | ||||
|---|---|---|---|---|---|
| Z指数 | 等级 | 类型 | 指标 | 等级 | 类型 |
| Z>1.645 | 1 | 重涝 | I>50 | 1 | 大涝 |
| 1.037<Z≤1.654 | 2 | 大涝 | 35<I≤50 | 2 | 涝 |
| 0.842<Z≤1.037 | 3 | 偏涝 | 3<(I-L)≤35 | 3 | 偏涝 |
| -0.842<Z≤0.842 | 4 | 正常 | |I-L|≤3 | 4 | 正常 |
| -1.037<Z≤-0.842 | 5 | 偏旱 | 3<(L-I)≤35 | 5 | 偏旱 |
| -1.654<Z≤-1.037 | 6 | 大旱 | 35<L≤50 | 6 | 旱 |
| Z≤-1.654 | 7 | 重旱 | L>50 | 7 | 大旱 |
Fig. 2 Changing trends of precipitation at different time scales图2 不同时间尺度的降水变化趋势 |
Fig. 3 Spatial distribution of precipitation at different time scales图3 不同时间尺度的降水量空间分布 |
Fig. 4 Spatial distribution of precipitation trends图4 降水量变化趋势空间分布 |
Fig. 5 The result of wavelet analysis图5 小波分析结果 |
Tab. 2 The result of R/S analysis for precipitation series表2 降水系列的R/S分析结果 |
| 序号 | 站点 | H | R2 | 历史趋势 | 未来趋势 |
|---|---|---|---|---|---|
| 1 | 德钦 | 0.74 | 0.98 | 减 | 减 |
| 2 | 贡山 | 0.78 | 0.98 | 增 | 增 |
| 3 | 玉溪 | 0.61 | 0.88 | 减 | 减 |
| 4 | 中甸 | 0.66 | 0.96 | 减 | 减 |
| 5 | 沾益 | 0.63 | 0.95 | 减 | 减 |
| 6 | 广南 | 0.67 | 0.97 | 减 | 减 |
| 7 | 文山州 | 0.66 | 0.95 | 减 | 减 |
| 8 | 屏边 | 0.59 | 0.96 | 增 | 增 |
| 9 | 澜沧 | 0.64 | 0.98 | 减 | 减 |
| 10 | 蒙自 | 0.55 | 0.89 | 减 | 减 |
| 11 | 江城 | 0.62 | 0.94 | 减 | 减 |
| 12 | 元江 | 0.58 | 0.88 | 增 | 增 |
| 13 | 勐腊 | 0.47 | 0.80 | 增 | 减 |
| 14 | 思茅 | 0.53 | 0.88 | 减 | 减 |
| 15 | 景洪 | 0.89 | 0.96 | 减 | 减 |
| 16 | 临沧 | 0.62 | 0.94 | 减 | 减 |
| 17 | 景东 | 0.62 | 0.87 | 减 | 减 |
| 18 | 孟定 | 0.87 | 0.94 | 减 | 减 |
| 19 | 泸西 | 0.71 | 0.83 | 减 | 减 |
| 20 | 瑞丽 | 0.56 | 0.93 | 减 | 减 |
| 21 | 维西 | 0.53 | 0.90 | 减 | 减 |
| 22 | 楚雄 | 0.70 | 0.91 | 增 | 增 |
| 23 | 昆明 | 0.63 | 0.95 | 减 | 减 |
| 24 | 元谋 | 0.56 | 0.95 | 减 | 减 |
| 25 | 大理 | 0.55 | 0.94 | 减 | 减 |
| 26 | 保山 | 0.57 | 0.97 | 增 | 增 |
| 27 | 泸水 | 0.74 | 0.90 | 减 | 减 |
| 28 | 昭通 | 0.72 | 0.89 | 减 | 减 |
| 29 | 丽江 | 0.61 | 0.95 | 增 | 增 |
| 30 | 华坪 | 0.51 | 0.92 | 减 | 减 |
| 31 | 腾冲 | 0.84 | 0.91 | 增 | 增 |
| 32 | 会泽 | 0.78 | 0.90 | 减 | 减 |
| 全省 | 春季 | 0.72 | 0.94 | 增 | 增 |
| 夏季 | 0.76 | 0.97 | 减 | 减 | |
| 秋季 | 0.72 | 0.95 | 减 | 减 | |
| 冬季 | 0.42 | 0.85 | 减 | 增 | |
| 雨季 | 0.62 | 0.97 | 减 | 减 | |
| 年值 | 0.70 | 0.91 | 减 | 减 |
Fig. 6 Changing trends and grades of the regional flood and drought indices图6 区域旱涝指数变化及旱涝等级 |
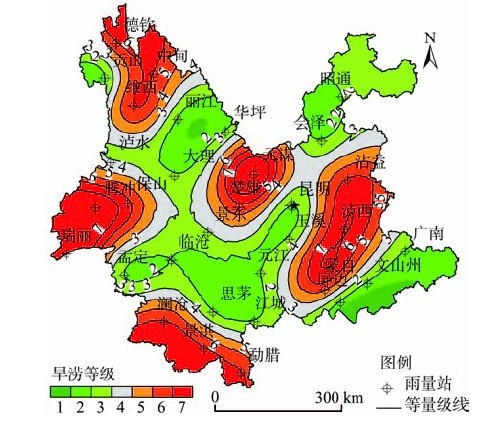
Fig. 7 Spatial distribution of grades for droughts and floods图7 旱涝等级空间分布 |
The authors have declared that no competing interests exist.
| [1] |
[
|
| [2] |
|
| [3] |
|
| [4] |
|
| [5] |
[
|
| [6] |
[
|
| [7] |
[
|
| [8] |
[
|
| [9] |
[
|
| [10] |
[
|
| [11] |
[
|
| [12] |
[
|
| [13] |
[
|
| [14] |
[
|
| [15] |
[
|
| [16] |
|
| [17] |
[
|
| [18] |
[
|
| [19] |
|
| [20] |
[
|
| [21] |
[
|
| [22] |
|
| [23] |
[
|
| [24] |
|
| [25] |
|
| [26] |
|
| [27] |
|
| [28] |
[
|
| [29] |
[
|
| [30] |
|
| [31] |
[
|
| [32] |
[
|
| [33] |
[
|
| [34] |
|
/
| 〈 |
|
〉 |

