
厦门市高温热浪人群健康风险格局分析
作者简介:赵颜创(1988-),男,河南郑州人,硕士生,研究方向为城市热环境。E-mail:yczhao@iue.ac.cn
收稿日期: 2015-11-05
要求修回日期: 2015-12-06
网络出版日期: 2016-08-10
基金资助
福建省自然科学基金项目(2013J05062)
国家自然科学基金项目(41371392)
厦门市科技计划项目(3502Z20142020)
国家科技支撑计划项目(2012BAC21B03)
Spatial Pattern Analysis on Human Health Risk of Heatwave in Xiamen City
Received date: 2015-11-05
Request revised date: 2015-12-06
Online published: 2016-08-10
Copyright
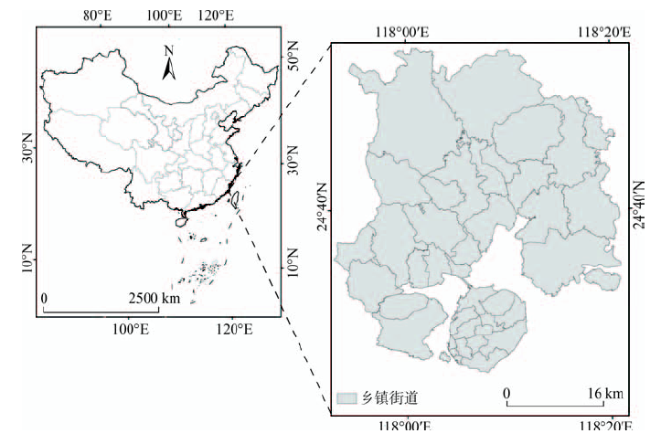
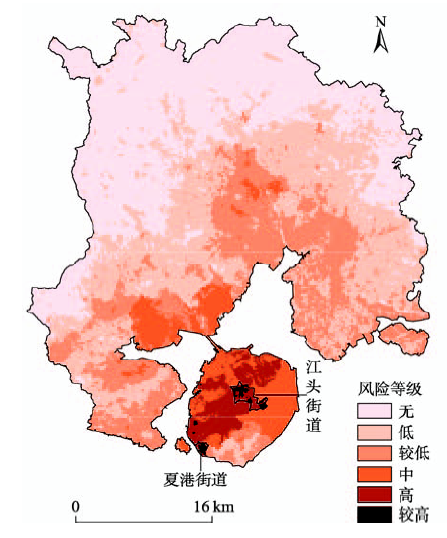
高温热浪已成为世界范围内夏季频繁发生的极端气象灾害事件,威胁着人类健康。研究高温热浪人群健康风险的空间格局,可以识别灾害高风险区域,有助于预防和应对高温热浪灾害。本文以厦门市为例,在历史气象数据分析的基础上,建立了高温热浪案例库,分析了厦门高温热浪的基本特征。通过结合卫星遥感影像和人口统计数据,选取2010年的一次高温热浪事件,进行人口因子和环境因子叠加分析,研究了厦门市高温热浪人群健康风险的空间格局,得出如下结论:(1)厦门市高温热浪强度较轻,频率较高,偶尔会发生强等级高温热浪;(2)高温热浪人群健康的高风险区域集中在厦门本岛内,沿东北-西南方向呈带状分布,较高等级的风险热点主要位于湖里区江头街道的北部与东南部和思明区夏港街道大部分区域;(3)高温热浪人群健康风险的空间格局与环境和人口的空间分布特征密不可分。本文对完善国内高温热浪人群健康风险分析的科学体系具有重要意义。
赵颜创 , 赵小锋 , 刘乐乐 . 厦门市高温热浪人群健康风险格局分析[J]. 地球信息科学学报, 2016 , 18(8) : 1094 -1102 . DOI: 10.3724/SP.J.1047.2016.01094
Heatwave has become an extreme meteorological disaster which occurred frequently during the summer. Moreover, heatwave could evidently affect the healthy conditions of residents. Thus, study the spatial pattern of heatwave health risk would be helpful for us to prevent from and respond to the impacts of heatwaves. Using the historically meteorological datum of Xiamen, this study built a database of heatwave cases and analyzed the basic characteristics of heatwaves in Xiamen. Taking a heatwave event occurred in 2010 as a case, we analyzed the spatial pattern of heatwave health risk by using both the remote sensing data and the demographic data. It is concluded as the following statements. (1) The intensity of heatwaves in Xiamen is quite low, but its frequency is rather high. An intensive heatwave occurred occasionally. (2) The regions with high health risk are located in Xiamen Island, lying from the northeast toward the southwest. The regions with the highest healthy risk are located in the northern and southeastern Jiangtou sub-district, Huli district, and the most area of Xiagang sub-district and Siming district. (3) The human health risk pattern of Heatwave is associated with the spatial distribution of environmental and demographic factors. Generally, this study promotes and extends the scientific knowledge on the health risk of heatwaves.
Key words: heatwave; health risk; spatial pattern; Xiamen city
Fig. 1 Location of the study area图1 研究区地理位置示意图 |
Tab. 1 Specifications of HJ-1B sensors表1 HJ-1B卫星主要载荷参数 |
| 传感器 | 谱段号 | 光谱范围/mm | 空间分辨率/m | 幅宽/ km | 重访周期/d |
|---|---|---|---|---|---|
| CCD相机 | 1 | 0.43~0.52 | 30 | 360 | 4 |
| 2 | 0.52~0.60 | ||||
| 3 | 0.63~0.69 | ||||
| 4 | 0.76~0.90 | ||||
| 红外多光谱扫描仪(IRS) | 5 | 0.75~1.10 | 150 | 720 | 4 |
| 6 | 1.55~1.75 | ||||
| 7 | 3.50~3.90 | ||||
| 8 | 10.5~12.5 | 300 |
Tab. 2 Descriptive summary of the risk factors表2 风险因子的基本统计信息 |
| 平均值 | 标准差 | 最小值 | 最大值 | ||
|---|---|---|---|---|---|
| 环境 变量 | 辐射温度 | 24.2 | 1.31 | 21.54 | 29.14 |
| 归一化植被指数 | 0.1801 | 0.1896 | -0.4981 | 0.5617 | |
| 归一化建设用地指数 | 0.497 | 0.0941 | -0.3175 | 0.9045 | |
| 人口 统计 变量 | 常住人口密度 | 2267 | 4329 | 2 | 33 564 |
| 5岁以下人口密度 | 118 | 224 | 0 | 1900 | |
| 64岁以上人口密度 | 101 | 247 | 0 | 3138 | |
| 独居人口密度 | 228 | 528 | 0 | 4568 | |
| 64岁以上独居人口密度 | 13 | 29 | 0 | 460 | |
| 未受大学教育人口密度 | 1708 | 3123 | 2 | 25 811 |
Tab. 3 Thresholds used in the segmentation of the risk index表3 风险等级划分中所使用的阈值 |
| Y值范围 | 风险等级 | 代表意义 |
|---|---|---|
| <0 | 1 | 无 |
| 0-1 | 2 | 低 |
| 1-1.5 | 3 | 较低 |
| 1.5-3 | 4 | 中 |
| 3-5 | 5 | 高 |
| >5 | 6 | 较高 |
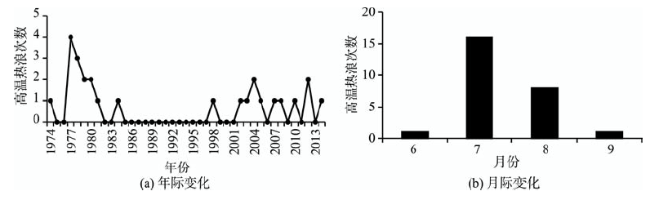
Fig. 2 Temporal change of the heatwaves in Xiamen图2 厦门市高温热浪时序变化 注:图(b)仅列出发生高温热浪时间的月份 |
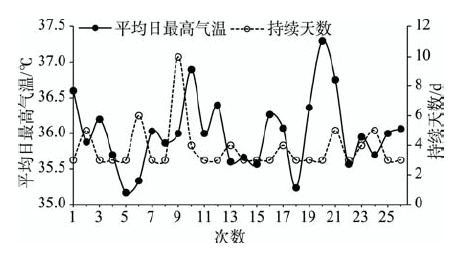
Fig. 3 Intensity of the heatwaves in Xiamen图3 厦门市高温热浪强度 |
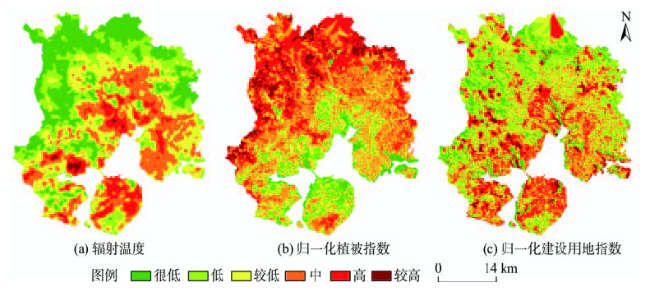
Fig. 4 Spatial distribution of the environmental factors’ grades during the heatwave period in Xiamen图4 厦门高温热浪期间不同等级环境因子的空间分布 |
Tab. 4 Thresholds used in the segmentation of the environmental factors表4 环境因子等级划分中所使用的阈值 |
| 阈值 | 等级 | 代表 意义 | ||
|---|---|---|---|---|
| 辐射温度/(℃) | 归一化植被指数 | 归一化建设用地指数 | ||
| < 23 | <-0.1 | <0.3 | 1 | 很低 |
| 23~24 | -0.1-0 | 0.3-0.4 | 2 | 低 |
| 24~25 | 0-0.1 | 0.4-0.5 | 3 | 较低 |
| 25~26 | 0.1-0.3 | 0.5-0.6 | 4 | 中 |
| 26~27 | 0.3-0.5 | 0.6-0.7 | 5 | 高 |
| >27 | > 0.5 | > 0.7 | 6 | 较高 |
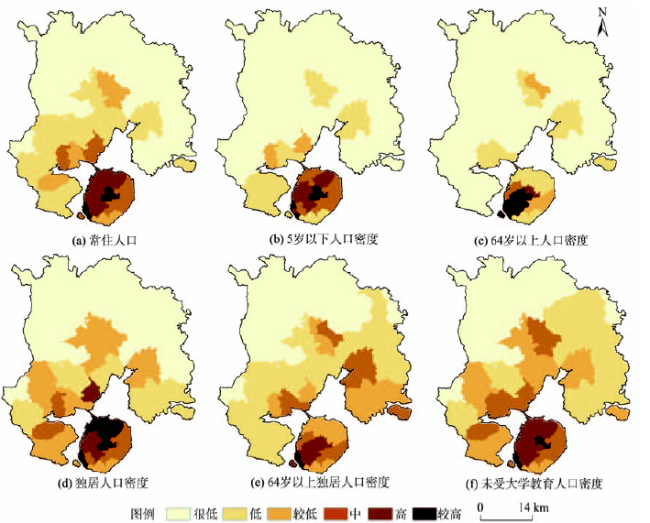
Fig. 5 Spatial distribution of the demographic factors in Xiamen图5 厦门市人口密度空间分布 |
Tab. 5 Thresholds used in the segmentation of the population density表5 人口密度等级划分中所使用的阈值 |
| 阈值/(人/km2) | 等级 | 代表意义 | |||||
|---|---|---|---|---|---|---|---|
| 常住人口 密度 | 5岁以下 人口密度 | 64岁以上 人口密度 | 独居人口 密度 | 64岁以上独居 人口密度 | 未受大学教育 人口密度 | ||
| <1000 | <100 | <100 | <30 | <5 | <100 | 1 | 很低 |
| 1000~3000 | 100~300 | 100~300 | 30~100 | 5~10 | 100~1000 | 2 | 低 |
| 3000~5000 | 300~500 | 300~500 | 100~500 | 10~30 | 1000~2000 | 3 | 较低 |
| 5000~10 000 | 500~700 | 500~700 | 500~1000 | 30~50 | 2000~7000 | 4 | 中 |
| 10 000~20 000 | 700~1000 | 700~1000 | 1000~1500 | 50~150 | 7000~15 000 | 5 | 高 |
| >20 000 | >1000 | >1000 | >1500 | >150 | >15 000 | 6 | 较高 |
Fig. 6 Map for the heatwave health risks in Xiamen图6 厦门市高温热浪人群健康风险等级图 |
The authors have declared that no competing interests exist.
| [1] |
[
|
| [2] |
|
| [3] |
[
|
| [4] |
[
|
| [5] |
IPCC. Climate change 2007: the physical science basis[M]. Cambridge, UK: Cambridge University Press, 2007.
|
| [6] |
[
|
| [7] |
[
|
| [8] |
|
| [9] |
[
|
| [10] |
|
| [11] |
|
| [12] |
|
| [13] |
|
| [14] |
|
| [15] |
|
| [16] |
|
| [17] |
|
| [18] |
|
| [19] |
[
|
| [20] |
[
|
| [21] |
[
|
| [22] |
[
|
| [23] |
|
| [24] |
厦门市统计信息网.2014年厦门经济特区年鉴 [EB/OL]. [2015-03-20]. .
[ Statistic Information of Xiamen. Environment quality bulletin of Xiamen[EB/OL]. ]
|
| [25] |
|
| [26] |
[
|
| [27] |
中国气象科学数据共享服务网.中国地面气候资料日值数据集(V3.0) [EB/OL]. [2015-03-20]. .
[ China Meteorological Data Sharing Service System. China ground climate daily data set (V3.0)[EB/OL]. ]
|
| [28] |
[
|
| [29] |
[
|
| [30] |
[
|
| [31] |
[
|
| [32] |
|
| [33] |
|
| [34] |
维基. 厦门市[EB/OL]. [2015-03-20]. .
[ Wiki. Xiamen city[EB/OL]. , 2015-03-20. ]
|
| [35] |
|
| [36] |
|
| [37] |
|
| [38] |
|
| [39] |
|
/
| 〈 |
|
〉 |