不同时间间隔下的遥感时间序列重构模型比较分析

  • 周惠慧 , 1, 2 ,
  • 王楠 1 ,
  • 黄瑶 3 ,
  • 王晋年 3 ,
  • 张立福 , 1*, *
展开
  • 1. 中国科学院遥感与数字地球研究所 遥感科学国家重点实验室,北京 100101
  • 2. 中国科学院大学,北京 100049
  • 3. 中科遥感科技集团有限公司,北京 100101
*通讯作者:张立福(1967-),男,博士生导师,研究员,主要从事高光谱遥感机理研究。E-mail: zhanglf@radi.ac.cn

作者简介:周惠慧(1991-),女,硕士生,主要从事遥感时间序列分析与应用。E-mail:

收稿日期: 2015-12-22

  要求修回日期: 2016-04-25

  网络出版日期: 2016-10-25

基金资助

国家“863”计划项目(2012AA12A301)

国家自然科学基金项目(41371359)

中国科学院遥感与数字地球研究所所长青年基金项目(Y5SJ2000CX)

Comparison and Analysis of Remotely Sensed Time Series of Reconstruction Models at Various Intervals

  • ZHOU Huihui , 1, 2 ,
  • WANG Nan 1 ,
  • HUANG Yao 3 ,
  • WANG Jinnian 3 ,
  • ZhANG Lifu , 1, *
Expand
  • 1. Key Laboratory of Remote Sensing Science, Institute of Remote Sensing and Digital Earth, Chinese Academy of Sciences, Beijing 100101, China
  • 2. University of Chinese Academy of Sciences, Beijing 100049, China
  • 3. China RS, Beijing, 100101
*Corresponding author: ZHANG Lifu, E-mail:

Received date: 2015-12-22

  Request revised date: 2016-04-25

  Online published: 2016-10-25

Copyright

《地球信息科学学报》编辑部 所有

摘要

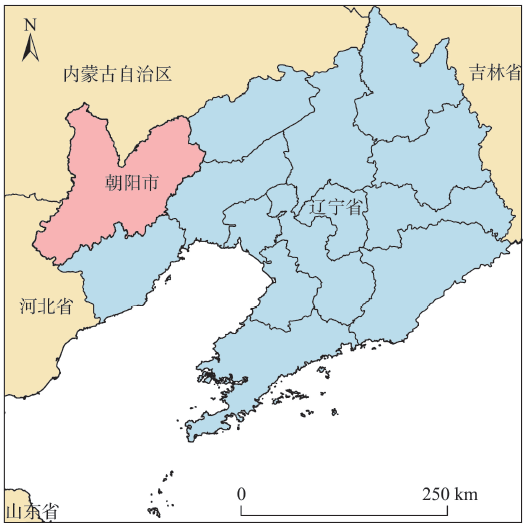
遥感时间序列被广泛用于地表信息探测。然而受传感器和外部条件的影响,时间序列存在不同程度的噪声。时间序列重构模型能够实现时间序列去噪,但不同重构模型应用于不同时间间隔时间序列的精度不同。本文以辽宁省朝阳市为研究区,分别利用1、4、8、16和30 d间隔归一化植被指数(Normalized Difference Vegetable Index, NDVI)时间序列,进行模拟数据实验和物候监测实验,从波形还原能力和物候期提取精度2方面,评价了SG滤波、DL拟合、HANTS 3种模型在不同时间间隔下的重构效果。结果表明,SG滤波模型适用于较大时间间隔的时间序列数据,DL拟合模型适用于较小时间间隔的时间序列数据,HANTS模型对较小间隔的时间序列重构精度较低。在此基础上,从模型自身的角度分析了3者在不同时间间隔下表现的原因,并为面向不同时间间隔时间序列数据的重构模型选择提供了参考。

本文引用格式

周惠慧 , 王楠 , 黄瑶 , 王晋年 , 张立福 . 不同时间间隔下的遥感时间序列重构模型比较分析[J]. 地球信息科学学报, 2016 , 18(10) : 1410 -1417 . DOI: 10.3724/SP.J.1047.2016.01410

Abstract

Remotely sensed time series are being widely used in land surface information detection. However, influenced by the sensors and external conditions, different levels of noises exist in the remotely sensed time series. Although reconstruction models can reduce the noises in times series effectively, different reconstruction models provide different levels of accuracy when they are used at various intervals. This study took the city of Chaoyang in Liaoning Province as a case. We utilized the time series of Normalized Difference Vegetation Index (NDVI) at intervals of 1-day, 4-day, 8-day, 16-day and 30-day, respectively, to carry out experiments of simulation and phenology observation. We also assessed the reconstruction results of the SG filter model, the DL fitting model and the HANTS model based on their capabilities of keeping waveform of time series and their accuracy of phenological date extraction. In addition, we also analyzed sensitivity of these three models to various intervals. The results showed that the SG filter model performed better at larger intervals, the DL fitting model gave better reconstruction accuracy at smaller intervals and the Hants model gave better accuracy when it is used at larger intervals. Moreover, the reasons of the different performance of the three reconstruction models were analyzed from the theories of these models. On this basis, we gave the suggestions on the choice of reconstruction models of time series at different intervals.

1 引言

遥感时间序列表征了像元随时间变化的信息,被广泛用于植被物候监测[1]、地物变化监测[2]、地物分类[3]等领域。然而,受传感器自身性能、大气、云层等条件影响,遥感时间序列普遍存在严重的噪声,限制了它的深入应用。为了获取准确的遥感时间序列,学者们发展了不同的时间序列重构模型。现有重构模型包括以下3类:(1)基于曲线局部特征的多项式拟合,如SG滤波[4]是一种应用最小二乘法确定加权系数进行移动窗口加权平均的滤波方法,重构的数据能够较好地保留局部特征;(2)基于曲线整体波形的函数拟合,通过函数逼近散点实现时间序列的重构,如AG拟合算法[5]、DL拟合算法[6]利用分段函数来模拟植被物候期,整个拟合过程包括区间提取、局部拟合、整体连接,该方法能够较好地还原时间序列的总体波形;(3)基于时间序列频率域的低通滤波,如快速傅里叶变换[7]、小波变换[8]、谐波分析[9],该类方法主要通过滤除时间序列数据中的高频成分实现时间序列数据的去噪,能够较好地反映地物的周期性变化。
为了在不同领域得到更好的应用效果,近年来,国内外学者从不同角度评价了这些时间序列重构模型的优劣。如李儒等[10]定性论述了拟合、滤波、傅立叶系列3类常用重构模型的优缺点,即拟合应用于季相信息提取优势明显、滤波和傅立叶变换受人为影响较大;Hird和McDermid[11]在总结前人研究的基础上,定量评价了噪声程度、植被类型、年际变化等因素对6种不同模型重构效果的影响,他认为面向不同应用和数据时,用户应根据模型对上述因素的敏感程度,慎重选择重构模型;Atkinson等[12]从植被物候的角度评价4种模型的应用效果,发现DL拟合和AG拟合算法对于非单季植被效果较差;曹云锋等[13]、宋春桥等[14]、王乾坤等[15]分别以长白山区、藏北地区、东北地区为研究区比较了SG滤波、DL拟合、AG拟合用于植被指数时序重构的保真效果,说明不同的重构方法对不同区域的适用性不同。
上述研究从物候、研究区域、植被类型、噪声程度等不同角度评价了时间序列重构模型,为用户选择模型提供了一定参考。然而,在面向不同的应用需求时,除了以上因素,时间间隔也是遥感数据时间序列的一大因素。时间间隔是指遥感时间序列中的相邻时相之差,根据不同的应用需求将选择不同时间间隔的遥感时间序列数据,如植被物候监测要求数据时间间隔以天为单位[16],森林扰动[17]则需要以年为单位的时间序列数据,而不同时间间隔也会对长期地表覆盖变化监测结果带来影响[18]。然而,现有研究却鲜少评价重构模型的时间间隔效应,因此,从时间间隔的角度,定量评价和比较不同时间序列重构模型的重构效果和应用精度十分必要。
东北地区是中国主要粮食生产基地,选择合适的模型对该地区进行农业监测尤为重要。玉米是东北地区的主要作物类型之一,而辽宁省朝阳市是玉米的主要产地。本文以辽宁省朝阳市为例,从3类遥感时间序列重构模型中各选取一种模型——SG滤波、DL拟合和HANTS谐波分析,通过玉米像元的模拟数据实验和真实物候分析,比较这3种方法对1、4、8、16和30 d时间间隔的作物MODIS NDVI时间序列的应用效果。根据实验结果,综合评价时间间隔对这3种重构模型的影响,为东北地区农业监测中时间序列重构模型的选择提供依据。

2 研究区与数据源

2.1 研究区

辽宁省朝阳市位于辽宁省西北部(图1),地理位置为40°31'45''~42°27'15''N,118°43'45''~121°22'40''E,总面积19 736 km2。地势以平原为主,属温带大陆性季风气候。该地区为东北地区主要的玉米种植地区之一,耕种作物主要为春玉米,一年一熟制。
Fig. 1 Location of the study area

图1 研究区地理位置

2.2 数据源

2.2.1 遥感数据
本文数据包括2013年全年条带号为h26v04和h27v04的MOD09GQ、MOD09A1和MOD13Q1数据产品(http://ladsweb.nascom.nasa.gov//search.html),覆盖整个朝阳市地区。其中,MOD09GQ和MOD09A1分别为1、8 d分辨率合成反射率产品,MOD13Q1为16 d合成植被指数NDVI产品,空间分辨率均为250 m。本文首先利用MODIS Reprojection Tool将影像投影至UTM坐标系51度带,利用ENVI、IDL工具对影像进行拼接、裁剪等操作,得到朝阳市影像数据;然后,采用最大值合成法[19],利用MOD09GQ数据合成4 d分辨率反射率数据,以及利用MOD13Q1合成30 d NDVI数据。
利用反射率数据计算归一化植被指数(Normalized Difference Vegetable Index, NDVI)并构成时间序列,NDVI计算方法如式(1)所示。
NDVI = ρ NIR - ρ red ρ NIR + ρ red (1)
式中: ρ NIR ρ red 分别为地物在近红外波段和红波段的反射率。
2.2.2 参考数据
模拟实验使用的参考数据为2013年朝阳市地理国情普查成果数据,该数据包含了耕地类型和分布情况等信息。基于该数据选取大片耕地中心的若干像元,作为典型像元进行模拟实验分析。物候实验使用的参考数据为朝阳市农业气象站点的观测数据,由中国气象数据网获取,该数据观测站点地理位置为120.45° E,41.55° N,作物类型为春玉米,记录的物候发育期名称及时间如表1所示。
Tab. 1 The phenological stages and corresponding dates recorded at observational sites

表1 地面站点记录的物候发育期及对应日期

出苗 拔节 抽穗 乳熟 成熟
日期 5月22日 6月28日 7月24日 8月26日 9月18日

3 研究方法

3.1 重构模型介绍

SG滤波对移动窗口内的离散点进行多项式拟合,并将窗口中心值由拟合值代替。由于窗口中心点的拟合结果仅由窗口内若干点的变化情况决定,SG滤波能够较好地保留局部特征。移动窗口的大小对时序数据的重建效果起主要作用,窗口越大,重构数据越平滑,去噪效果越好;窗口越小,重构数据保留的细节越多,去噪效果越差。
DL拟合利用分段的双逻辑斯蒂克函数对整个时间序列进行逼近,以获得一条光滑的曲线。由于双逻辑斯蒂克函数曲线为“S”形或倒“S”形,这与植被生长期和衰亡期的NDVI时间序列波形一致,因此,DL拟合模型能够用于模拟植被的生长变化 规律。
HANTS模型将时间序列分解为若干个振幅、周期、相位不同的余弦波之和,保留低频信号,去除高频信号,从而达到滤除噪声的效果。由于余弦波是典型的周期性变化曲线,因此HANTS可以用于模拟NDVI的周期性变化。

3.2 模拟实验

假定理想环境下,植被未发生干旱胁迫、病虫害等突变,数据获取时不受高度角、天气、云、阴影等噪声因素影响,像元NDVI值仅反映植被的理想生理状态和正常生长变化。在此环境下,模拟地物理想NDVI时间序列,模拟方法[11]为:首先,基于地理国情数据中的耕地,从影像时间序列中分别选择质量标记为“高”的时相数最多的100个典型像元;然后利用质量控制数据检测时间序列中的异常值,将其用前后时相高质量像元值平均值代替;接着,将冬季时相的所有NDVI值设定为0.1至0.2(具体值由时间序列本身决定);最后,采用大小为3的移动窗口对整条时间序列进行平滑,为得到光滑曲线,将1d和4d数据进行3次平滑,8 d数据进行二次平滑,16 d和30 d数据进行一次平滑。模拟理想时间序列完成后,利用MATLAB软件对每条时间序列随机加入10~70 db的噪声,使其具有和卫星影像相当的信噪比。
为了评价时间间隔对3种模型的影响,计算重构数据与理想数据的相关系数来评价二者的一致性,一致性越高,重构效果越好;此外,计算重构结果与理想时间序列统计指标之间的误差来评价重构模型对波形的保持能力,保持效果越好,方法的重构效果越好。相关系数的计算方法如式(2)所示,所用统计指标如表2所示,统计指标的相对误差计算方法如式(3)所示。
r = i = 1 N ( NDV I pi - NDV I p ¯ ) ( NDV I oi - NDV I o ¯ ) i = 1 N ( NDV I pi - NDV I p ¯ ) 2 × i = 1 N ( NDV I oi - NDV I o ¯ ) 2 (2)
RE = M i - M o i M o i (3)
式中:N为时间序列的时相总数; NDV I oi NDV I pi 分别为第i个时相理想数据和重构数据的NDVI值, NDV I o ¯ NDV I p ¯ 分别为理想数据和重构数据的NDVI平均值; M o i M i 分别为理想数据和重构数据提取的第i个指标值。对逐个像元的时间序列曲线计算相关系数和相对误差,将所有像元时间序列的相关系数和指标相对误差的平均值作为评价该模型重构效果的指标。
Tab. 2 Statistical indicators and the computing methods

表2 统计指标及其计算方法

指标名称 意义 指标名称 意义
MIN 时间序列最小值 MIN_t 时间序列最小值出现时间
MAX 时间序列最大值 MAX_t 时间序列最大值出现时间
MID 时间序列中值 MID_t 时间序列中值出现时间
MEAN 时间序列平均值

3.3 物候实验

在影像中提取物候观测站点对应像元,提取其不同时间间隔的NDVI时间序列,利用3种模型对其进行重构,利用重构后的时间序列提取作物物候发育期,计算提取物候期与真实物候期之差的绝对值,将其作为重构模型的评价指标。根据重构时间序列的变化情况,提取春玉米的出苗、拔节、抽穗、乳熟、成熟期,其含义和计算方法如表3所示。
Tab. 3 Phenological stages and the retrieval methods

表3 物候期名称及其提取方法

物候期名称 含义 计算方法
出苗 幼苗出土,NDVI开始上升 上升期曲率最大值对应时间
拔节 茎快速伸长,NDVI上升最快阶段 上升期曲线导数最大值对应时间
抽穗 发育完全,NDVI达到全年最大阶段 时间序列最大值对应时间
乳熟 NDVI开始下降 下降期曲线最大值对应时间
成熟 NDVI下降最快阶段 下降期曲率导数最大值对应时间

4 结果与分析

4.1 模拟数据实验分析

图2(a)为不同时间间隔下,利用不同模型所得重构数据与理想数据之间的相关系数;图2(b)为不同时间间隔下各模型重构数据与理想数据的统计指标平均相对误差。为方便比较,将1d和4d作为较小时间间隔,8 d和16 d作为中等时间间隔,30 d作为较大时间间隔进行分析。
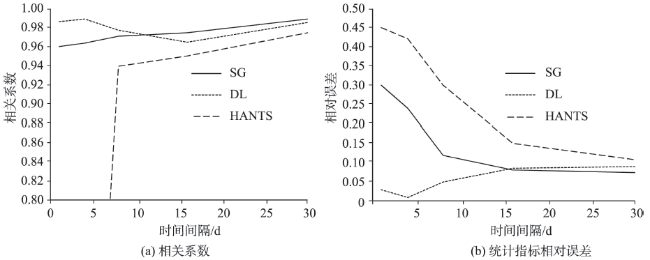
Fig. 2 Correlation coefficient and relative error of statistical metrics between reconstructed and ideal data of different time interval

图2 不同时间间隔下重构数据与模拟理想数据的相关系数以及提取统计指标的相对误差

(1)较小时间间隔
图2(a)可看出,当时间间隔为1 d时,DL拟合数据与理想数据的相关系数最高,SG滤波数据其次,HANTS数据最低;从图2(b)可看出,当时间间隔为1 d时,DL拟合数据所得统计指标相对误差最低,HANTS滤波数据相对误差最高,SG数据相对误差居于二者之间。当时间间隔为4 d时,DL拟合数据在三者中,仍能得到最高的重构精度,即相关系数最高且相对误差最低,SG滤波数据的相关系数上升至0.97以上,统计指标相对误差相比1 d间隔也有所下降,而HANTS数据的相关系数仍为最低,统计指标误差最高。图3以4 d间隔为例,展示了各模型在小时间间隔下的NDVI时间序列重构效果。图3中DL拟合结果与理想数据十分接近,甚至几乎重合,SG滤波结果能够较好地实现去噪的效果,同时还原理想数据的变化趋势,HANTS重构结果则与理想数据偏离严重。这说明当数据间隔较小时,在3种模型之中,选择DL拟合模型能够得到最好的重构效果,SG滤波在4 d间隔数据中能够得到较好的重构效果,而HANTS模型不适用于小间隔时间序列的重构。
(2)中等时间间隔
图2显示,当时间间隔为8 d时,DL拟合数据的相关系数最高,但低于1 d间隔和4 d间隔下所得的相关系数,SG滤波数据略低于DL拟合数据,HANTS数据相关系数上升至0.9以上;从统计指标来看,DL数据的相对误差最小,SG其次,HANTS仍为三者最高。当时间间隔为16 d时,SG滤波数据的相关系数和统计指标相对误差相比8 d间隔分别有所升高和下降,且为三者中表现最佳的模型,HANTS模型重构数据也得到了比较小间隔更高的相关系数和更低的相对误差,与SG滤波和HANTS不同,DL拟合的相关系数下降,统计指标相对误差升高。图4以16 d间隔为例,展示了中等时间间隔下各模型的重构效果。图4中SG滤波模型和DL拟合模型在年中的重构结果较为相似,SG滤波结果更为接近理想数据,而DL拟合结果的年中“波峰”较宽。HANTS重构结果能够一定程度上还原理想数据的变化规律,但年中最高值以及年初和年末的变化情况与理想数据差异较大。以上结果表明,在应用于中间隔时间序列分析时,DL拟合模型的重构效果不如小间隔数据重构效果,而SG滤波模型在三者中表现最为稳定,能够得到高于小间隔数据的重构精度,HANTS模型重构精度仍低于其他模型,但高于自身用于小时间间隔数据的精度。
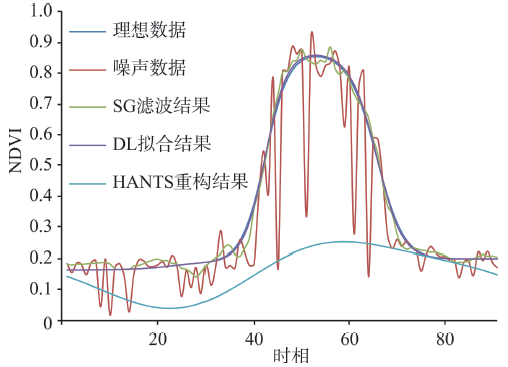
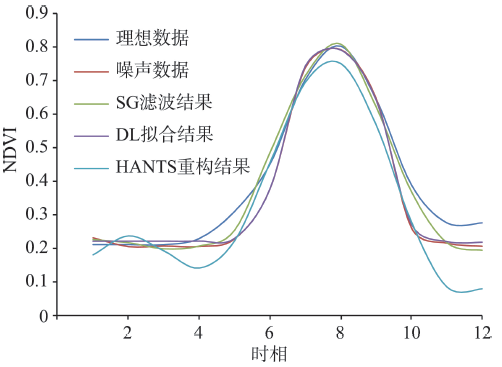
Fig. 3 The reconstruction results of time series at4-day-interval using the three models

图3 4 d间隔下的各模型重构结果图

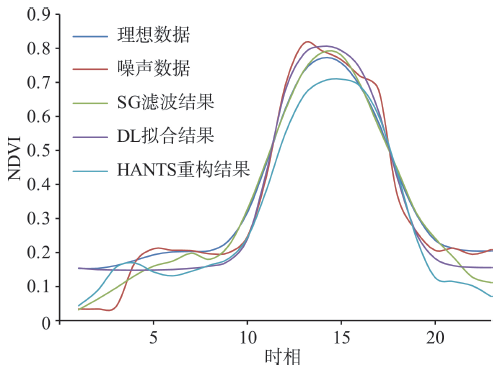
Fig 4 The reconstruction results of time series at16-day-interval using the three models

图4 16 d间隔下的各模型重构结果图

(3)较大时间间隔
图2可看出,当数据间隔达到30 d时,3种模型不再像小间隔和中间隔中表现出各异的重构效果,而是所得的相关系数和统计指标相对误差趋于接近,统计指标相对误差的差异更小,均处于0.05-0.15之间。图5展示了各模型对30 d间隔时间序列的重构效果图,从图5中可看出,3种模型均能较好还原理想数据的大致变化情况,对某些局部细节特征的重构效果各异,无法直观判断哪一种模型的重构效果较好。这说明大间隔数据不再对模型敏感,各种模型均能得到相似的重构结果,重构结果只与时间序列数据本身变化情况有关。可能的原因是30 d间隔时间序列的变化趋势十分明显,噪声量小,3种模型均能较好地还原它的变化情况。
Fig. 5 The reconstruction results of time series at30-day-interval using the three models

图5 30 d间隔下的各模型重构效果图

4.2 物候实验分析

利用3.3节中的方法,基于不同时间间隔、不同模型的重构时间序列数据提取春玉米的5项物候发育期。图6(a)、(b)、(c)分别展示了SG滤波、DL拟合、HANTS谐波分析模型重构数据提取结果误差的直方图。
图6(a)、(b)可看出,对于SG滤波和DL拟合2种模型来说,总体上,各项物候期误差随时间间隔的增大而增大,这说明时间间隔越小,数据越能精准捕捉到作物细微的变化信息。然而, 4 d时间间隔是一个特殊情况,即4 d间隔数据提取物候精度为5种间隔数据中最高,可能的原因是1 d间隔的时间序列包含过多噪声,这在一定程度上影响了数据重构效果,4 d合成时间序列既减少了噪声量,又不至于间隔过大导致错过某些重要转折点。因此,SG滤波数据和DL拟合数据的物候提取精度对时间间隔敏感,这种敏感性是由数据本身的信息量和噪声量决定的。5项物候指标中,拔节期、抽穗期、成熟期总体精度相对较高,这说明在任何时间间隔下,SG和DL模型对最大值和曲线变化速率特征的还原能力高于曲率特征的还原能力。
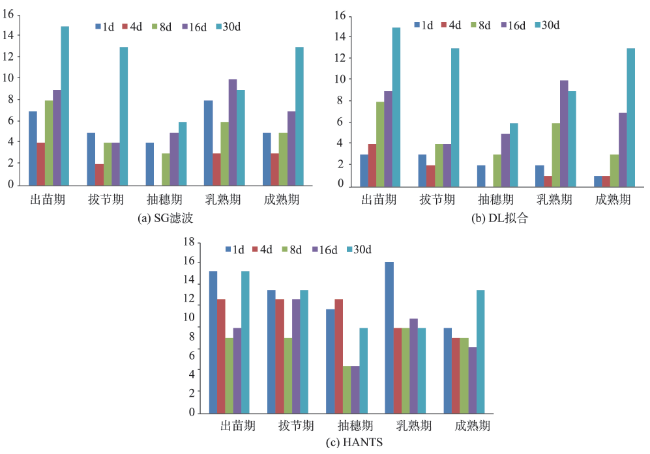
Fig. 6 The error histograms of phenological dates derived from reconstructed data by the three models

图6 3种模型重构数据所提物候期的误差直方图

图6(c)可看出,HANTS重构数据的物候提取误差较大,但8 d间隔数据的提取精度略高于其他间隔。可能的原因是:在较小时间间隔下,模拟数据实验证明了HANTS模型的重构效果不理想,重构数据存在严重失真,因而物候提取误差较大;在较大时间间隔下,虽然HANTS重构效果能够得到显著提升,但数据本身已不能精确地反映植被物候节点,因此精度较低。综上,在物候应用中,对于HANTS模型来说,8 d是一个最适用时间间隔。为评价各模型在不同时间间隔下的总体物候精度,图7展示了不同模型重构数据的5项物候期误差平均值。如图7所示,在1、4、8 d时间间隔下,DL拟合数据的物候提取精度最高,SG滤波数据其次,HANTS数据精度最低,这与模拟数据实验结果一致,说明物候提取精度与时间序列的重构效果相关。当使用8 d及以下时间间隔进行物候分析时,选择DL拟合模型对时间序列进行重构能得到理想的结果;在16 d和30 d间隔下,使用SG滤波和DL拟合模型提取的物候期精度相同,HANTS重构数据的提取精度也逐渐与另外两种模型接近,这说明模型的选择对于物候提取的重要性已不再明显,数据本身时间间隔过大成为制约物候信息提取的主要因素。此外,通过对图7进行分析可发现,4 d合成的时间序列数据能够获得最可靠的物候信息,说明时间间隔过小造成噪声量过大,或时间间隔过大造成重要信息缺失。这2种情况都不利于物候分析,且利用DL拟合模型对4 d数据进行重构能够获得最高精度。
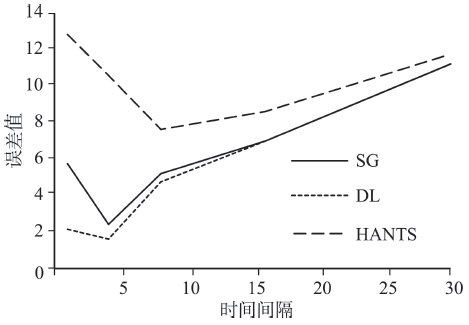
Fig. 7 The mean of 5 phenological dates' error derivedfrom the reconstructed data of different models

图7 不同模型重构数据的5项物候期误差平均值

4.3 模型表现分析

通过上述分析可知,各模型的表现情况随时间间隔下发生变化,这种变化情况不仅与时间序列本身的信息量和噪声量有关,也与自身性能有关。各模型自身的原理和特点决定了其适用性。本文从模型本身方面对其在不同时间间隔下的表现情况进行了分析。
4.3.1 SG滤波
SG滤波模型在模拟实验中相关系数和统计指标误差随时间间隔增大分别呈现升高、下降的趋势,在物候实验中,对1 d间隔数据的物候提取精度明显低于DL拟合模型,对其他间隔则表现较好。总体上,SG滤波更适用于8-30 d尺度的时间序列重构。这是因为SG滤波方法通过对曲线局部进行拟合来保留细节变化信息,而真实的细节变化信息与噪声往往难以区分,因而该模型对噪声较为敏 感[11]。时间间隔较大的时间序列数据比间隔较小的时间序列数据所含噪声更少,曲线的波动也较少,因此,SG滤波在用于较大间隔数据的重构时,能够较好地还原真实变化趋势。此外,在8-30 d间隔时间序列中,SG滤波模型的表现较为稳定,这可能是因为当数据质量满足一定条件时,SG滤波均能够通过设置合理的窗口大小,达到较好地去噪和保留细节特征的效果。
4.3.2 DL拟合
DL拟合模型的在模拟实验中的表现随时间间隔增大而逐渐变差,在物候实验中,对1-8 d间隔时间序列的应用精度优于其他模型。总体上,DL拟合更适用于1-8 d尺度的时间序列重构。这是因为DL拟合模型利用光滑的DL函数曲线来逼近时间序列,因而DL拟合模型能够最大限度地还原曲线的总体波形,具有较强的抗噪声能力。另外,DL拟合是一种针对植被物候周期的生长变化特征的拟合方法,DL函数的S形和倒S形曲线形状能够形象地反映植被物候周期的NDVI变化趋势。因此,若像元的NDVI变化能反映这种S形的物候特征,则拟合效果就越好。时间间隔较小的数据具有更大的信息量,更易捕捉植被的快速变化,有利于物候转折点的表达。而这些转折点在较大间隔的时间序列中表现为平滑缓慢的变化,因而DL拟合模型在较大间隔数据的应用中不具有优势。
4.3.3 HANTS
HANTS方法在2项实验中对较小间隔数据重构效果是3种模型中最差的,只有在对较大间隔数据进行重构时能得到较好的效果。由于研究使用的时间序列长度只有一年,对于单季作物来说NDVI时间序列只包含一个生长周期,并且时间间隔小的时间序列本身存在太多随机起伏波动,因此HANTS难以识别数据的真实变化趋势,导致在用于小间隔时间序列时,重构数据与模拟理想数据的相关系数为负。当时间间隔增大,时间序列的随机起伏波动减少,HANTS重构模型的表现有显著提升的趋势。在大尺度长时间序列中,HANTS模型效果的定量评价则有待研究。

5 结论

本文以1、4、8、16和30 d间隔的NDVI时间序列为例,通过模拟数据实验和真实物候实验,研究了时间间隔对SG滤波、DL拟合、HANTS 3种时间序列重构模型的影响,得出以下结论:
(1)SG滤波模型对8 d及以上间隔时间序列的重构效果较好,表现最稳定。值得注意的是,该方法对噪声较为敏感,时间间隔较小的数据噪声较多,因而该方法适合用于时间间隔较大的数据滤波。
(2)DL拟合方法对于1-8 d的数据应用效果较好。这是由于DL拟合从整体上考虑时间序列的变化规律。但由于时间间隔较大的数据不能充分反映某些快速变化信息,使DL拟合不具有优势。因而,当时间间隔较小且数据符合DL函数变化规律时,选择DL拟合方法较好。
(3)HANTS重构模型适用于时间间隔较大的数据重构。这是因为HANTS模型对数据曲线的起伏波动变化敏感。因此,当数据周期性变化规律明显且异常值较少时,可以选择HANTS对时间序列进行重构。

The authors have declared that no competing interests exist.

[1]
夏传福,李静,柳钦火.植被物候遥感监测研究进展[J].遥感学报,2013,17(1):1-16.植被物候是研究植被与气候、环境变化间关系的重要参量。本文针对目前常用的阈值法、拟合法和延迟滑动平均法等植被物候遥感监测方法进行比较分析;介绍了传感器网络法、物候模型法等物候遥感监测验证方法;从遥感监测方法和数据源两方面分析物候遥感监测的误差来源;针对目前研究中存在的问题,讨论了遥感物候的主要研究方向:从机理层面,应创新植被物候遥感监测方法;建立标准化地面验证数据源;利用多源遥感数据,组成高时间分辨率的原始遥感数据源,提高植被物候遥感监测的时间分辨率和测算精度。

DOI

[ Xia C F, Li J, Liu Q H.Review of advances in vegetation phenology monitoring by remote sensing[J]. Journal of Remote Sensing, 2013,17(1):1-16. ]

[2]
Jamali S, Jonsson P, Eklundh L, et al.Detecting changes in vegetation trends using time series segmentation[J]. Remote Sensing of Environment, 2015,156:182-195.Although satellite-based sensors have made vegetation data series available for several decades, the detection of vegetation trend and change is not yet straightforward. This is partly due to the scarcity of available change detection algorithms suitable for identifying and characterizing both abrupt and non-abrupt changes, without sacrificing accuracy or computational speed. We propose a user-friendly program for analysing vegetation time series, with two main application domains: generalising vegetation trends to main features, and characterizing vegetation trend changes. This program, Detecting Breakpoints and Estimating Segments in Trend (DBEST) uses a novel segmentation algorithm which simplifies the trend into linear segments using one of three user-defined parameters: a generalisation-threshold parameter, thelargest changes, or a thresholdfor the magnitude of changes of interest for detection. The outputs of DBEST are the simplified trend, the change type (abrupt or non-abrupt), and estimates for the characteristics (time and magnitude) of the change. DBEST was tested and evaluated using simulated Normalized Difference Vegetation Index (NDVI) data at two sites, which included different types of changes. Evaluation results demonstrate that DBEST quickly and robustly detects both abrupt and non-abrupt changes, and accurately estimates change time and magnitude.DBEST was also tested using data from the Global Inventory Modeling and Mapping Studies (GIMMS) NDVI image time series for Iraq for the period 1982–2006, and was able to detect and quantify major change over the area. This showed that DBEST is able to detect and characterize changes over large areas. We conclude that DBEST is a fast, accurate and flexible tool for trend detection, and is applicable to global change studies using time series of remotely sensed data sets.

DOI

[3]
Zhu Z, Woodcock C E.Continuous change detection and classification of land cover using all available Landsat data[J]. Remote sensing of Environment, 2014,144:152-171.A new algorithm for Continuous Change Detection and Classification (CCDC) of land cover using all available Landsat data is developed. It is capable of detecting many kinds of land cover change continuously as new images are collected and providing land cover maps for any given time. A two-step cloud, cloud shadow, and snow masking algorithm is used for eliminating "noisy" observations. A time series model that has components of seasonality, trend, and break estimates surface reflectance and brightness temperature. The time series model is updated dynamically with newly acquired observations. Due to the differences in spectral response for various kinds of land cover change, the CCDC algorithm uses a threshold derived from all seven Landsat bands. When the difference between observed and predicted images exceeds a threshold three consecutive times, a pixel is identified as land surface change. Land cover classification is done after change detection. Coefficients from the time series models and the Root Mean Square Error (RMSE) from model estimation are used as input to the Random Forest Classifier (RFC). We applied the CCDC algorithm to one Landsat scene in New England (WRS Path 12 and Row 31). All available (a total of 519) Landsat images acquired between 1982 and 2011 were used. A random stratified sample design was used for assessing the change detection accuracy, with 250 pixels selected within areas of persistent land cover and 250 pixels selected within areas of change identified by the CCDC algorithm. The accuracy assessment shows that CCDC results were accurate for detecting land surface change, with producer's accuracy of 98% and user's accuracies of 86% in the spatial domain and temporal accuracy of 80%. Land cover reference data were used as the basis for assessing the accuracy of the land cover classification. The land cover map with 16 categories resulting from the CCDC algorithm had an overall accuracy of 90%. (C) 2014 Elsevier Inc. All rights reserved.

DOI

[4]
Chen J, Jönsson P, Tamura M, et al.A simple method for reconstructing a high-quality NDVI time-series data set based on the Savitzky-Golay filter[J]. Remote sensing of Environment, 2004,91(3):332-344.Although the Normalized Difference Vegetation Index (NDVI) time-series data, derived from NOAA/AVHRR, SPOT/VEGETATION, TERRA or AQUA/MODIS, has been successfully used in research regarding global environmental change, residual noise in the NDVI time-series data, even after applying strict pre-processing, impedes further analysis and risks generating erroneous results. Based on the assumptions that NDVI time-series follow annual cycles of growth and decline of vegetation, and that clouds or poor atmospheric conditions usually depress NDVI values, we have developed in the present study a simple but robust method based on the Savitzky–Golay filter to smooth out noise in NDVI time-series, specifically that caused primarily by cloud contamination and atmospheric variability. Our method was developed to make data approach the upper NDVI envelope and to reflect the changes in NDVI patterns via an iteration process. From the results obtained by applying the newly developed method to a 10-day MVC SPOT VGT-S product, we provide optimized parameters for the new method and compare this technique with the BISE algorithm and Fourier-based fitting method. Our results indicate that the new method is more effective in obtaining high-quality NDVI time-series.

DOI

[5]
Jönsson P, Eklundh L.Seasonality extraction by function fitting to time-series of satellite sensor data[J]. IEEE Transactions on Geoscience and Remote Sensing, 2002,40(8):1824-1832.

[6]
Zhang X, Friedl M A, Schaaf C B, et al.Monitoring vegetation phenology using MODIS[J]. Remote sensing of environment, 2003,84(3):471-475.Accurate measurements of regional to global scale vegetation dynamics (phenology) are required to improve models and understanding of inter-annual variability in terrestrial ecosystem carbon exchange and climate鈥揵iosphere interactions. Since the mid-1980s, satellite data have been used to study these processes. In this paper, a new methodology to monitor global vegetation phenology from time series of satellite data is presented. The method uses series of piecewise logistic functions, which are fit to remotely sensed vegetation index (VI) data, to represent intra-annual vegetation dynamics. Using this approach, transition dates for vegetation activity within annual time series of VI data can be determined from satellite data. The method allows vegetation dynamics to be monitored at large scales in a fashion that it is ecologically meaningful and does not require pre-smoothing of data or the use of user-defined thresholds. Preliminary results based on an annual time series of Moderate Resolution Imaging Spectroradiometer (MODIS) data for the northeastern United States demonstrate that the method is able to monitor vegetation phenology with good success.

DOI

[7]
Welch P D.The use of fast Fourier transform for the estimation of power spectra: A method based on time averaging over short, modified periodograms[J]. IEEE Transactions on audio and electroacoustics, 1967,15(2):70-73.The use of the fast Fourier transform in power spectrum analysis is described. Principal advantages of this method are a reduction in the number of computations and in required core storage, and convenient application in nonstationarity tests. The method involves sectioning the record and averaging modified periodograms of the sections.

DOI

[8]
Martínez B, Gilabert M A.Vegetation dynamics from NDVI time series analysis using the wavelet transform[J]. Remote Sensing of Environment, 2009,113(9):1823-1842.A multi-resolution analysis (MRA) based on the wavelet transform (WT) has been implemented to study NDVI time series. These series, which are non-stationary and present short-term, seasonal and long-term variations, can be decomposed using this MRA as a sum of series associated with different temporal scales. The main focus of the paper is to check the potential of this MRA to capture and describe both intra- and inter-annual changes in the data, i.e., to discuss the ability of the proposed procedure to monitor vegetation dynamics at regional scale. Our approach concentrates on what wavelet analysis can tell us about a NDVI time series. On the one hand, the intra-annual series, linked to the seasonality, has been used to estimate different key features related to the vegetation phenology, which depend on the vegetation cover type. On the other hand, the inter-annual series has been used to identify the trend, which is related to land-cover changes, and a Mann-Kendall test has been applied to confirm the significance of the observed trends. NDVI images from the MEDOKADS (Mediterranean Extended Daily One-km AVHRR Data Set) imagery series over Spain are processed according to a per-pixel strategy for this study. Results show that the wavelet analysis provides relevant information about vegetation dynamics at regional scale, such as the mean and minimum NDVI value, the amplitude of the phenological cycle, the timing of the maximum NDVI and the magnitude of the land-cover change. The latter, in combination with precipitation data, has been used to interpret the observed land-cover changes and identify those subtle changes associated to land degradation.

DOI

[9]
Roerink G J, Menenti M, Verhoef W.Reconstructing cloudfree NDVI composites using Fourier analysis of time series[J]. International Journal of Remote Sensing, 2000,21(9):1911-1917.

[10]
李儒,张霞,刘波,等.遥感时间序列数据滤波重建算法发展综述[J].遥感学报,2009,13(2):335-341.遥感时间序列数据(MODIS,NOAA/AVHRR,SPOT/VEGETATION等)在植被生长监测、物候信息提取、土地利用类型监测等诸多领域得到了广泛应用,是生产研究的重要数据源之一.由于传感器、云层大气等影响,遥感时间序列数据存在着严重的噪声,应用前必须进行序列滤波重建工作.综述现有各类滤波重建方法,对研究中广为采用的3类主要方法(基于最小二乘的非对称高斯函数拟合、SavitZky-Golay滤波、基于离散傅里叶的系列分析方法)集中阐述其理论基础、应用步骤和优缺点.总结当前遥感时间序列滤波重建方法需要进一步改进之处.

DOI

[ Li R, Zhang X, Liu B, et al.Review on methods of remote sensing time-series data reconstruction[J].Journal of Remote Sensing, 2009,13(2):335-341. ]

[11]
Hird J N, McDermid G J. Noise reduction of NDVI time series: An empirical comparison of selected techniques[J]. Remote Sensing of Environment, 2009,113(1):248-258.Satellite-derived NDVI time series are fundamental to the remote sensing of vegetation phenology, but their application is hindered by prevalent noise resulting chiefly from varying atmospheric conditions and sun-sensor-surface viewing geometries. A model-based empirical comparison of six selected NDVI time series noise-reduction techniques revealed the general superiority of the double logisti...

DOI

[12]
Atkinson P M, Jeganathan C, Dash J, et al.Inter-comparison of four models for smoothing satellite sensor time-series data to estimate vegetation phenology[J]. Remote Sensing of Environment, 2012,123:400-417.Several models have been fitted in the past to smooth time-series vegetation index data from different satellite sensors to estimate vegetation phenological parameters. However, differences between the models and fine tuning of model parameters lead to potential differences, uncertainty and bias between the results amongst users. The current research assessed four techniques: Fourier analysis, asymmetric Gaussian model, double logistic model and the Whittaker filter for smoothing multi-temporal satellite sensor observations with the ultimate purpose of deriving an appropriate annual vegetation growth cycle and estimating phenological parameters reliably. The research used Level 3 Medium Resolution Imaging Spectrometer (MERIS, spatial resolution similar to 4.6 km) Terrestrial Chlorophyll Index (MTCI) data over the years 2004 to 2006 composited at eight day intervals covering the Indian sub-continent. First, the four models were fitted to representative sample time-series of the major vegetation types in India, and the quality of the fit was analysed. Second, the effect of noise on model fitting was analysed by adding Gaussian noise to a standard profile. Finally, the four models were fitted to the whole study area to characterise variation in the quality of model fitting as a function of single and double vegetation seasons. These smoothed data were used to estimate the onset of greenness (OG), a major phenological parameter. The models were evaluated using the root mean square error (RMSE), Akaike Information Criteria (AIC), and Bayesian Information Criteria (BIC). The first test (fitting to representative sample time series) revealed the consistently superior performance of the Whittaker and Fourier approaches in most cases. The second test (fitting after the addition of Gaussian noise) revealed the superior performance of the double logistic and Fourier approaches. Finally, when the approaches were applied to the whole study, thus, including vegetation with different phenological profiles and multiple growing seasons (third test), it was found that it was necessary to tune each of the models according to the number of annual growing seasons to produce reliable fits. The double logistic and asymmetric Gaussian models did not perform well for areas with more than one growing season per year. The mean absolute deviation in OG derived from these models was a maximum (3 to 4 weeks) within the dry deciduous vegetation type and minimum (1 week) in evergreen vegetation. All techniques yielded consistent results over the south-western and north-eastern regions of India characterised by tropical climate. (C) 2012 Elsevier Inc. All rights reserved.

DOI

[13]
曹云锋,王正兴,邓芳萍. 3 种滤波算法对NDVI高质量数据保真性研究[J].遥感技术与应用,2010,25(1):118-125.<p>标准MODIS NDVI产品时间序列仍然存在噪声,必须在利用前处理。理想的去除噪声算法,应该最大限度地去噪,同时最大限度地保留原数据中无噪声像元的真值。以往的研究大多关注不同滤波算法对噪声的处理能力,往往忽略不同算法在滤波处理时对原始高质量数据保真性的研究。基于Timesat 2.3时序滤波工具所提供的3个滤波算法,探讨了原始数据质量差异对滤波算法的保真性的影响以及不同滤波算法对原始高质量数据保真性的差异,通过对比分析发现非对称高斯算法(AG)对原始高质量数据保真性最高,双逻辑曲线拟合算法(DL)性能次之,SG算法拟合结果的保真性较差。</p>

[ Cao Y F, Wang Z X, Deng F P.Fidelity Performance of Three Filters for High Quality NDVI Time-series Analysis[J]. Remote Sensing Technology And Application, 2010,25(1):118-125. ]

[14]
宋春桥,游松财,柯灵红,等.藏北地区三种时序 NDVI 重建方法与应用分析[J].地球信息科学学报,2011,13(1):133-143.<p>遥感植被指数时间序列数据集,已广泛应用于陆地生态环境变化监测与模拟、植被覆盖动态变化分析、植被物候特征识别与信息提取等多方面的研究。但其因受遥感器采集与传输过程、大气条件、地面状况等诸多因素的影响,时序NDVI数据包含各种噪声,因此研究者们发展了一系列时间序列曲线重建方法。本文对近年来提出或改进的重建算法原理、优缺点进行阐述;然后,选择当前最为常用的3种方法,即非对称高斯函数(AG)拟合、双Logistic曲线(D-L)拟合和Savitzky-Golay(S-G)滤波法,以藏北地区不同土地覆被类型样点像元NDVI时间序列为实例,对算法的去噪效果、保真性能、生长峰值及细节处理效果等方面进行比较研究。结果表明,AG与D-L拟合两种算法具有较好的一致性,但对生长峰值模拟有所差异;3种方法对荒漠、荒漠草原、草原、灌丛、作物用地及林地等不同覆被类型各具优势,表现出区域、覆被类型和应用目的差异性。最后,基于AG拟合算法对整个藏北地区2007-2009年MODIS NDVI时间序列进行重建,处理后像元NDVI空间格局异质性减弱。</p>

DOI

[ Song C Q, You S C, Ke L H, et al.Analysis on Three NDVI Time-series Reconstruction Methods and Their Applications in North Tibet[J]. Journal of Geo-Information Science, 2011,13(1):133-143. ]

[15]
王乾坤,于信芳,舒清态,等.MODIS EVI 时序数据重建方法及拟合分析[J].地球信息科学学报,2015,17(6):732-741.<p>植被遥感监测中长时间序列数据择优的重建方法, 已成为当今一个研究热点。本文以东北地区5种主要植被覆盖类型为例, 在定性分析TIMESAT提供的3种常用重建方法对EVI(Enhanced Vegetation Index)时序曲线重建效果的基础上, 定量对比研究了各方法, 对原始高质量EVI点真实值的保真性, 及对原始曲线整体特征的保持度。结果表明:S-G(Savitzky-Golay)滤波对原始曲线生长季的峰值及宽度重建效果较好, 但容易因过度拟合保留过多噪声, 特别是草地和灌丛类型;非对称性高斯函数(AG)和双Logistic曲线(DL)方法相似, 对草地、灌丛和耕地的重建结果更接近真实值, 但AG拟合对波峰处异常值的处理结果较差, 重建后波峰表现低平。3种算法对原始EVI时序数据的保真性和对原始时序数据曲线特征的保持度, 都表现出与植被类型分布相关的空间分布格局。分析结果表明, 在东北地区, AG算法对草原和灌丛的重建效果最好, DL算法对耕地重建效果最优, S-G算法最适合对落叶阔叶林和落叶针叶林进行重建处理。</p>

DOI

[ Wang Q K, Yu X F, Shu Q T, et al.Comparison on Three Algorithms of Reconstructing Time-series MODIS EVI[J]. Journal of Geo-Information Science, 2015,17(6):732-741. ]

[16]
Beck P S A, Atzberger C, Høgda K A, et al. Improved monitoring of vegetation dynamics at very high latitudes: A new method using MODIS NDVI[J]. Remote sensing of Environment, 2006,100(3):321-334.Current models of vegetation dynamics using the normalized vegetation index (NDVI) time series perform poorly for high-latitude environments. This is due partly to specific attributes of these environments, such as short growing season, long periods of darkness in winter, persistence of snow cover, and dominance of evergreen species, but also to the design of the models. We present a new method for monitoring vegetation activity at high latitudes, using Moderate Resolution Imaging Spectroradiometer (MODIS) NDVI. It estimates the NDVI of the vegetation during winter and applies a double logistic function, which is uniquely defined by six parameters that describe the yearly NDVI time series. Using NDVI data from 2000 to 2004, we illustrate the performance of this method for an area in northern Scandinavia (35 x 162 km

DOI

[17]
杨辰,沈润平,郁达威,等.利用遥感指数时间序列轨迹监测森林扰动[J].遥感学报,2013,17(5):1246-1263.作为陆地生态系统的主体,森林的碳循环与碳蓄积对研究陆地生态系统起着重要作用,但目前森林扰动资料的缺乏在很大程度上影响着森林碳通量的估算精度。利用1986年-2011年共14期的Landsat TM/ ETM+影像,以江西武宁县为例,使用遥感指数时间序列轨迹分析方法,研究了适用于中国南方森林的扰动监测技术,该技术不仅可以识别森林的扰动变化,同时还可以监测植被的恢复信息。精度分析表明该方法得出的扰动产品的Kappa系数达到0.80,总体精度达到89.7%,表明该方法对武宁县森林扰动具有较好的监测能力。森林扰动特征分析表明武宁县森林在20世纪90年代受扰动最为剧烈,并且扰动主要发生在低海拔地区。

DOI

[ Yang C, Shen R P, Yu D W, et al.Forest disturbance monitoring based on the time-series trajectory of remote sensing index[J]. Journal of Remote Sensing, 2013,17(5):1246-1263. ]

[18]
Lunetta R S, Johnson D M, Lyon J G, et al.Impacts of imagery temporal frequency on land-cover change detection monitoring[J]. Remote Sensing of Environment, 2004,89(4):444-454.ABSTRACT An important consideration for monitoring land-cover (LC) change is the nominal temporal frequency of remote sensor data acquisitions required to adequately characterize change events. Ecosystem-specific regeneration rates are an important consideration for determining the required frequency of data collections to minimize change omission errors. Clear-cut forested areas in north central North Carolina undergo rapid colonization from pioneer (replacement) vegetation that is often difficult to differentiate spectrally from that previously present. This study compared change detection results for temporal frequencies corresponding to 3-, 7-, and 10-year time intervals for near-anniversary date Landsat 5 Thematic Mapper (TM) data acquisitions corresponding to a single path/row. Change detection was performed using an identical change vector analysis (CVA) technique for all imagery dates. Although the accuracy of the 3-year analysis was acceptable (86.3%, [kappa]=0.55), a significant level of change omission errors resulted (51.7%). Accuracies associated with both the 7-year (43.6%, [kappa]=0.10) and 10-year (37.2%, [kappa]=0.05) temporal frequency analyses performed poorly, with excessive change omission errors of 84.8% and 86.3%, respectively. The average rate of LC change observed over the study area for the 13-year index period (1987-2000) was approximately 1.0% per annum. Overall results indicated that a minimum of 3-4-year temporal data acquisition frequency is required to monitor LC change events in north central North Carolina. Reductions in change omission errors could probably best be achieved by further increasing temporal data acquisition frequencies to a 1-2-year time interval.

DOI

[19]
王正兴,刘闯,HUETE Alfredo.植被指数研究进展:从AVHRR-NDVI到MODIS-EVI[J].生态学报,2003,23(5):979-987.目前应用广泛的植被指数 AVHRR- NDVI仍有一些缺陷 ,主要表现在 :(1 )在植被高覆盖区容易饱和 ,这除了红光通道就容易饱和外 ,主要是基于 NIR/Red比值的 NDVI算式本身存在容易饱和的缺陷 ;(2 )没有考虑树冠背景对植被指数的影响 ;(3 ) NDVI的比值算式和最大值合成算法 (MVC)确实消除了某些内部和外部噪音 ,但最终的合成产品仍然有较多噪音 ;(4) MVC不能确保选择最小视角内的最佳像元。所有这些 AVHRR- NDVI的局限性 ,在基于“中分辨率成像光谱仪 (MODIS)”的“增强型植被指数 (EVI)”产品中 ,都有不同程度改善。MODIS- EVI改善表现在 :(1 )大气校正包括大气分子、气溶胶、薄云、水汽和臭氧 ,而 AVHRR- NDVI仅对瑞利散射和臭氧吸收做了校正 ;这样 MODIS- EVI可以不采用基于比值的方法 ,因为比值算式是以植被指数饱和为代价来减少大气影响 ;(2 )根据蓝光和红光对气溶胶散射存在差异的原理 ,采用“抗大气植被指数 (ARVI)对残留气溶胶做进一步的处理 ;(3 )采用“土壤调节植被指数(SAVI)”减弱了树冠背景土壤变化对植被指数的影响;(4)综合ARVI和SAVI的理论基础,形成“增强型植被指数(EVI)”,它可以同时减少来自大气和土壤噪音的影响;(5)采用“限定视角内最大值合成法(CV-MVC)”,选择最小视角内的最佳像元、此外,目前正在试验的“双向反射分布函数(BRDF)合成法”,首先把不同视角换算为星下点像元反射值,然后采用CV-MVC合成,目的是进一步提高EVI对植被季节性变化的敏感性。总之MODIS-EVI使植被指数与不同覆盖程度植被的线性关系得到明显改善,尤其在高覆盖区表现良好。

[ Wang Z X, Liu C, HUETE Alfredo.From AVHRR-NDVI to MODIS-EVI: Advances in vegetation index research[J]. Journal of Ecology, 2003,23(5):979-987. ]

文章导航

/