利用MODIS影像提取火烧迹地方法的研究

  • 肖潇 ,
  • 冯险峰 , * ,
  • 孙庆龄
展开
  • 1. 中国科学院地理科学与资源研究所,北京 100101
  • 2. 中国科学院大学,北京 100049
*通讯作者:冯险峰(1970-),女,河南新乡人,博士,副研究员,研究方向为植被遥感与全球变化。E-mail: fengxf@lreis.ac.cn

作者简介:肖潇(1993-),女,湖南衡阳人,硕士生,研究方向为生态遥感。E-mail:

收稿日期: 2015-12-16

  要求修回日期: 2016-03-04

  网络出版日期: 2016-11-20

基金资助

科技基础性工作专项(2013FY112800)

特色研究所培育建设服务项目“依托大数扬突发性公共安全事件预警与决策模拟平台”(TSYJS03)

Burned Area Detection in the Ecosystem Transition Zone Using MODIS Data

  • XIAO Xiao ,
  • FENG Xianfeng , * ,
  • SUN Qingling
Expand
  • 1. Institute of Geographic Sciences and Natural Resource Research, Chinese Academy of Sciences, Beijing 100101, China
  • 2. University of Chinese Academy of Sciences, Beijing 100049, China
*Corresponding author: FENG Xianfeng, E-mail:

Received date: 2015-12-16

  Request revised date: 2016-03-04

  Online published: 2016-11-20

Copyright

《地球信息科学学报》编辑部 所有

摘要

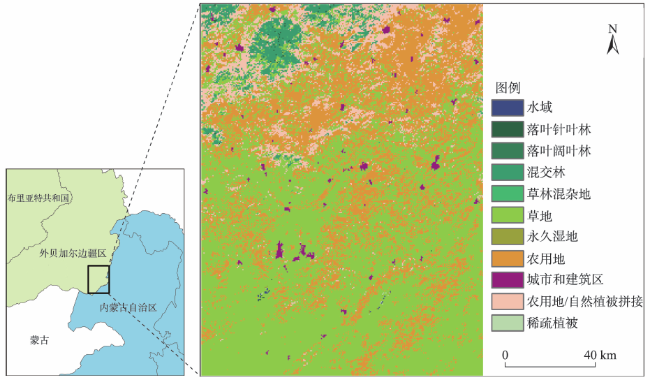
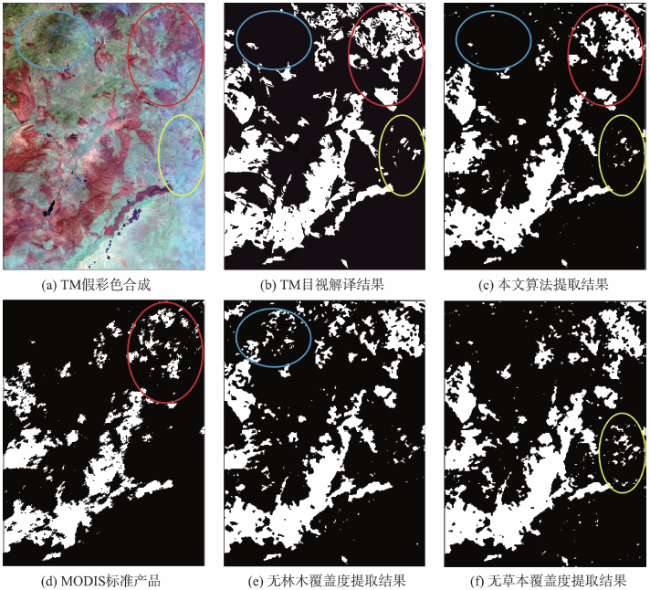
火烧迹地监测不仅可以反映火灾对生态系统的影响情况及损失信息,还能为全球碳循环研究提供重要的数据支持。本文利用MODIS地表反射率产品(MOD09A1)的近红外和短波红外波段构建的归一化燃烧率指数(NBR),计算前后2期影像的NBR差值,并在光谱指数差分法的基础上,结合MODIS植被数据产品(MOD44B)提供的植被覆盖度信息,设置规则提取火烧迹地。本文选择西伯利亚地区东南部的林地、草地、农田等不同生态系统的交界地带作为实验区,利用本文算法提取该区域的火烧迹地。实验结果表明:(1)本文算法的火烧迹地提取效果较好,优于MODIS火烧迹地产品(MCD45A1),kappa系数由0.70提高到0.75;(2)利用林木覆盖度、草本覆盖度数据,可以减少误判,提高火烧迹地提取的精度,kappa系数分别由0.69、0.73都提高到0.75。

本文引用格式

肖潇 , 冯险峰 , 孙庆龄 . 利用MODIS影像提取火烧迹地方法的研究[J]. 地球信息科学学报, 2016 , 18(11) : 1529 -1536 . DOI: 10.3724/SP.J.1047.2016.01529

Abstract

Fires belong to one of the main disturbance factors and play an important role in various ecosystems. Burned area detection not only indicates the impact of fires on ecosystems, but also provides a scientific support for the global carbon cycle studies. Traditional burned scar area detection approach mainly depends on ground survey and measurements, which still has several defects, such as the heavy workload, high cost, low efficiency, and poor timeliness etc. By applying remote sensing technology to map the burned area can produce burn scar information with greater spatial and temporal scale and effectively avoid the above-mentioned problems. Currently, many methods aiming to map the burned area on remote sensing images have been developed, and various global burned area products which provide the consistent assessments of fire activity at the global scale are also available; however, the efficiency of their performances differs within various ecosystems. In this study, we developed an algorithm to map the burned scar area in an ecosystem transition zone by using the Moderate Resolution Imaging Spectroradiometer (MODIS) data. This algorithm was developed based on the Normalized Burned Ratio differencing (dNBR) and the vegetation coverage data. The NBR index was originally developed specifically for mapping burned areas, and recently it has been used in the assessment of burning severity. Firstly, we used the near red and shortwave infrared bands of MODIS Surface Reflectance products (MOD09A1) to calculate the NBR values. Then, the differenced NBR (dNBR) calculated from the NBR values for a composite period with the previous 8-day range was calculated. The frequency distribution of dNBR maximum value in the burned scar area and the unburned region was analyzed. Since the change of NBR values in regions with different vegetation coverage was different, the tree cover and herbaceous cover data provided by the MODIS Vegetation Continuous Fields product (MOD44B) were also used for setting up rules to extract the burned scar area. A case study was carried out in an ecosystem transition zone within the southeast Siberia, where forest, grassland, farmland and other different ecosystems coexist. Comparison of the burned area detected by this algorithm with the adoption of high resolution burned scar information from Landsat ETM+ imagery shows a high accuracy. And the result obtained using this algorithm was better than the one using the MODIS Combined Burned Area product (MCD45A1), with the kappa coefficient increased from 0.70 to 0.75. To make a better comparison, we set up rules with the same threshold values of dNBR to extract the burned scar area, but without the usage of tree cover or herbaceous cover data. We found that the use of tree cover data as well as the herbaceous cover data can reduce mistakes during the process and improve the accuracy of burned area extraction, with the kappa coefficient increased from 0.69 and 0.73 respectively to 0.75.

1 引言

火灾是指在时间或空间上失去控制的燃烧所造成的灾害。在各种灾害中,火灾是威胁公众安全和社会发展的主要灾害之一。火烧迹地监测不仅可以反映火灾对生态系统的影响情况及损失信息,还能为全球碳循环研究提供重要的数据支持。传统的火烧迹地监测主要采用地面调查与测量的方法,存在工作量大、成本高、效率低和实效性差等问题,而利用遥感手段监测火烧迹地,则可以有效地避免这些问题,实现较大时空尺度的火烧迹地信息获取。
目前,利用遥感影像提取火烧迹地的方法很多,本文将目前常用的火烧迹地检测方法归纳为图像分类法[1-3]、图像处理法[4-7]、光谱指数法[8-10]、综合方法[11-12]4种。图像分类法是根据火灾前后影像的光谱差异,利用图像分类技术,如监督分类[13]、回归树分类[1]、面向对象分类[3]等方法,区分火烧迹地和非火烧迹地。图像处理法则是利用主成分分析法、HIS变换法、光谱混合分析法等图像处理技术,从影像中获取更有针对性的信息以提高火烧迹地监测的精度。光谱指数法是根据植被指数或火烧迹地指数的变化情况提取火烧迹地,常用的指数有归一化植被指数(Normalized Difference Vegetation Index,NDVI)、全球环境监测指数(Global Environment Monitoring Index,GEMI)、燃烧面积指数(Burned Area Index,BAI)、归一化燃烧率指数(Normalized Burn Ratio,NBR)、干扰指数(Disturbance Index,DI)[14]等。光谱指数因其概念清晰、计算效率高,是最广泛应用的方法。综合方法则是利用多源数据信息,如火点数据、地面数据、不同分辨率的遥感影像等,综合不同数据源的优势,以提高火烧迹地的检测精度。
在区域尺度下,为了能够长期监测火烧迹地信息,中空间分辨率且具有高时间分辨率的遥感影像被认为是最好的选择。当前应用最广泛的是AVHRR数据与MODIS数据。早期NOAA卫星以其时效性高、覆盖面积大、图像易获取等优势,在林火监测研究方面应用较广。2000年以后,随着MODIS数据的不断积累,研究者转而更多地利用光谱、空间分辨率更高的MODIS数据进行火灾监测。有研究指出MODIS数据比AVHRR数据更适合于提取火烧迹地,而且在构建光谱组合指数时,应该选取最敏感的波段,综合利用火灾引起的光谱和时序变化特征[15]。NASA推出的MODIS标准火烧迹地产品MCD45,是利用前一段时间的观测值模拟BRDF模型的系数,再根据卫星观测的当前角度信息,反演预期的反射率数据,将预期反射率值与卫星实际观测值进行对比,若其差异超过一定阈值则判定为过火区[16]。MCD45产品考虑了光谱反射率的时序变化特征,但缺乏对光谱植被光谱组合指数的应用。针对该缺点,本文利用MODIS影像近红外波段和短波红外波段构建的归一化燃烧率指数(NBR)作为火烧迹地的判别指数。NBR指数最早利用TM影像的第4波段(0.76~0.90 μm)和第7波段(2.08~2.35 μm)作归一化差值运算[17]提出的,因为火灾发生后这2个波段的地表反射率会发生变化且相互独立。MODIS影像也可以利用该指数,对应波段为第2波段(0.841~0.876 μm)和第7波段(2.105~2.155 μm)[18]。构建NBR指数的最初目的就是用于提取火烧迹地,后来也有研究将该指数运用于火烧强度评级[19-20]。本文以西伯利亚地区的生态交错带为例,通过计算前后2期影像的NBR差值,在光谱指数差分法的基础上再结合植被覆盖度信息,设置规则提取火烧迹地。

2 研究区和数据源

2.1 研究区概况

本文的研究区位于俄罗斯外贝加尔边疆区与中国内蒙古自治区交界处,面积约211万km2。该区域属温带大陆性气候,冬季漫长寒冷,夏季温和短暂,降水主要集中在夏季。春秋两季,由于大陆性气候的影响,该区域森林火灾频繁发生。有研究表明外贝加尔边疆区是俄罗斯西伯利亚联邦区的火灾高发区[21]。该区域的土地覆被状况如图1所示,北部有小部分林地,以混交林为主,南部是农用地、草地。在农用地与林地、草地的交接地带,还有部分的农用地/自然植被拼接地。城市和建筑区只有很少的一部分散落在研究区内。
Fig. 1 The location and land cover map of the study area

图1 研究区位置及土地覆被图

2.2 数据源与预处理

(1)MODIS全球土地覆被数据
图1的土地覆盖数据来源于MODIS土地覆盖产品MCD12Q1,空间分辨率为500 m。MCD12Q1是根据一年的Terra和Aqua观测所得的数据,利用监督决策树分类算法,得到土地覆盖的类型[22]。该土地覆盖数据集中共有5种不同的土地覆盖分类方案,包含了17个主要土地覆盖类型。本文选取国际地圈生物圈计划(International Geosphere-Biosphere Program,IGBP)的全球植被分类系统。
MCD12Q1的投影方式为正弦等积投影,为了减小投影产生的变形,将其转换为Albers双标准纬线等积圆锥投影,双标准纬线分别设置为45°N和70°N,中央经线为110°E,基准面为WGS84。下文提及的所有影像均转换为此投影。
(2)MODIS地表反射率数据
MOD09A1(MODIS Terra卫星500 m地表反射率8 d合成数据产品)提供了波段1-7的反射率值、质量评价数据等信息,投影方式为正弦等积投影。每个MOD09A1的像元包含了8 d之内最有可能的L2G观测数值,尽量考虑高观测覆盖、低视角、无云及云的阴影以及低气溶胶浓度的影像[23]
本文选用2012年儒略日第89天至第129天(共6期)的MOD09A1数据,选择该时段的影像数据是因为4月至5中上旬是西伯利亚地区火灾易发季节,而且据俄罗斯林业署外贝加尔林业局统计数据,2012年火灾季初期边疆区共发生613起火灾,总面积为20.7万hm2。通过对该区域的影像进行初步目视解译,也可发现该时段内区域受灾严重。
(3)MODIS植被覆盖度数据
MOD44B是MODIS Terra卫星250 m植被连续区域(Vegetation Continuous Field,VCF)年际产品。该产品利用机器学习软件,人为控制训练样本的输入,半自动生成回归树,得到3个层次的陆地表面覆盖信息:林木覆盖百分比、非林木(草本)覆盖百分比、裸露百分比[24]
在火烧迹地提取过程中,该数据为重要的数据源之一。为了保证MODIS影像空间分辨率的一致性,将MOD44B产品重采样为500 m。
(4)TM影像
本文利用儒略日第129天的TM影像,作为对MODIS影像火烧迹地提取结果的验证数据。选择TM影像是因为其空间分辨率为30 m,能够比MODIS影像提供更为丰富的细节信息,不论是目视解译还是监督分类的结果作为验证数据都更为可靠。为了保证TM影像和MODIS影像空间位置的一致性,将TM影像和MODIS影像进行了几何配准。
对TM影像,利用目视解译法提取了火烧迹地的位置信息。在后续的分析中,为了保证空间分辨率的一致性,将TM影像的火烧迹地提取结果重采样为500 m。
(5)MODIS火烧迹地产品
MCD45A1是MODIS标准火烧迹地产品(Burnt Areas Product),空间分辨率为500 m,合成的时间窗口为1月。产品中包含每个像元的火灾发生时间信息以及质量信息,数据中“0”表示未燃烧的区域,“1-366”表示火灾发生的儒略日。
对MCD45A1产品,提取2012年儒略日为1-129之间的像元,最早发生火灾的儒略日为94,也就是说实际发生火灾的儒略日为94-129之间,即4月至5月中旬。利用MODIS标准火烧迹地产品提取出来的火烧迹地,与本文算法提取结果进行对比。

3 研究方法

3.1 火烧迹地指数计算

通过比较火灾发生前后的光谱特征变化,选用归一化燃烧率指数(NBR)作为判别指数。NBR指数最早提出来是利用TM影像的第4波段(0.76~0.90 μm)和第7波段(2.08~2.35 μm)[17],火灾发生后这2个波段的地表反射率会发生变化且相互独立。MODIS影像也可以利用该指数,对应波段为第2波段(0.841~0.876 μm)和第7波段(2.105~2.155 μm),计算公式如式(1)所示。
NBR = band 2 - band 7 band 2 + band 7 (1)
火灾发生后,NBR值表现出显著的下降。利用式(2)可计算MODIS前后2期影像的NBR指数差值dNBR
dNBR = NB R t - 1 - NB R t (2)
式中:t为时间。
在计算dNBR差值时,还利用到MOD09A1产品中的质量评价数据。MOD09A1产品中包含2个质量评价数据:描述波段数据质量和地表反射率状态。本文利用地表反射率状态数据,以减小云阴影、气溶胶、卷云的影响,并排除水、雪/冰覆盖的干扰。该数据共有16位,利用其中10位数据的信息,筛选出48种符合质量的情况,其具体含义以及选择标准如表1所示。
对影像中的每一个像元,如果前后2期影像的质量评价数据不属于表1中的48种情况,则将dNBR值赋值为-10,在提取火烧迹地的时候将此值排除即可。
Tab. 1 MOD09A1 surface reflectance QA data set bits

表1 MOD09A1质量评价数据取值

位数 参数名称 可取值 含义
2 云阴影(Cloud shadow) 0 无(No)
3-5 陆地/水(Land/water flag) 001 陆地(Land)
6-7 气溶胶(Aerosol quality) 01 少(Low)
10 平均(Average)
8-9 卷云(Cirrus detected) 00 无(No)
01 少(Low)
10 平均(Average)
10 内部云算法(Internal cloud algorithm flag) 0 无云(No cloud)
12 MOD35 雪/冰(snow/ice flag) 0 无(No)
15 内部雪掩膜(Internal snow mask) 0 无雪(No snow)

3.2 火烧迹地提取方法

本文通过对火烧迹地和非火烧迹地NBR指数的变化情况进行分析,结合植被覆盖度数据,设置规则来提取火烧迹地。
3.2.1 火烧迹地分布情况
首先,利用TM影像监督分类提取出的火烧迹地,结合MODIS土地覆盖数据,统计不同土地覆盖类型的火烧迹地像元数,以及占火烧迹地总像元的百分比(表2)。统计结果表明,草地和农田的火灾占整个研究区的绝大部分,比例分别为45.93%和44.15%,农用地/自然植被拼接所占比例为8.91%。除了这3个主要的土地覆被类型,混交林、草林混杂地、城市和建筑区所占比例非常小。因此,该研究区主要需要提取的是草地火烧迹地和农田火烧迹地,以及这2个不同生态系统交界地带的火烧迹地。
Tab. 2 The pixel number and proportion of the burned scar area in different land cover types

表2 不同土地覆盖类型的火烧迹地像元个数及所占比例

土地覆被类型 像元个数 所占比例/(%)
水域 0 0
落叶针叶林 0 0
落叶阔叶林 0 0
混交林 91 0.56
草林混杂地 42 0.26
草地 7447 45.93
永久湿地 0 0
农用地 7158 44.15
城市和建设区 32 0.20
农用地/自然植被拼接地 1444 8.91
稀疏植被 0 0
3.2.2 dNBR最大值分析
对89-129共6期的MOD09A1数据,可计算得到5组dNBR数据。为了反映NBR值最明显的变化,特别是火烧迹地火烧前后的变化情况,对这5组dNBR数据取最大值,并将dNBR最大值放大1000倍,分别对火烧迹地和非火烧迹地的dNBR最大值进行分段频数统计分析,结果如图2所示。
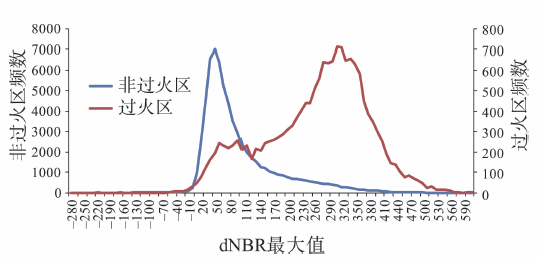
Fig. 2 Frequency distribution of the maximum dNBRvalue in the burned scar area and unburned region

图2 火烧迹地和非火烧迹地dNBR最大值的频数统计

图2可知,非火烧迹地的dNBR最大值近似于高斯分布,主要集中在0-150之间,往两边有较长的延展,其中正值部分的频数高于负值部分。火烧迹地的dNBR最大值主要分布在0-440之间:在0~150之间有个小峰值,该范围跟非火烧迹地恰好有重合;在150-440之间有个大峰值,绝大部分火烧迹地像元还是分布在150-440之间。
火烧迹地和非火烧迹地dNBR最大值重合的部分,可以从2个方面进行解释:① 在计算NBR时,有利用MOD09A1的质量评价数据去除了质量不好的数据,虽然可以保证火烧迹地提取的准确性,但也导致了有些像元可能连续几期都得不到正确的NBR值,这样计算出来的NBR差值,即使取了最大值,也无法反映火灾前后的NBR变化情况;② 将TM影像提取结果重采样过程中,由于分辨率变粗,会造成小部分误差,尤其是火烧迹地边缘很容易将火烧迹地和非火烧迹地混淆,所以也要考虑到这种情况的可能性。
3.2.3 规则设置
在对土地覆被类型和dNBR最大值频数统计的分析基础上,结合植被覆盖度数据,设置规则提取火烧迹地。
研究区的火灾集中发生于草地和农田,这2种生态系统的植被覆盖主要是非林木覆盖,可以利用MOD44B产品中的非林木覆盖度,即草本覆盖度(herbaceous cover percent)数据,将火烧迹地的草本覆盖度、dNBR最大值组合成二维坐标的形式,利用k均值聚类法进行聚类分析。k均值聚类的过程如下:
(1)从N个点中随机选取k个点作为质心;由图2可知,火烧迹地的dNBR值有2个明显的峰值,因此可以将类别数目设置为2。
(2)对剩余的每个点计算其到每个质心的欧式距离,把它归到最近的质心的类;
(3)重新计算已经得到的各个类别的质心;
(4)迭代步骤(2)、(3)直至新的质心与原质心相等或小于指定阈值,迭代结束。
利用k均值聚类得到2个类别的聚类中心分别是(73.22%,123.74)和(75.50%,326.14)。dNBR最大值的2个中心分别为123.74和326.14,正好对应了图2中的2个峰值。草本覆盖度的2个中心分别为73.22%和75.50%,因此,将草本覆盖度为74%作为分界线,设置如下2条规则:① 对草本覆盖度小于74%的区域,dNBR的阈值设置为150,因为从图2可以看出非火烧迹地的dNBR值主要集中在0-150之间;② 对草本覆盖度大于等于74%的区域,dNBR阈值设置为200。此外,考虑到林地火烧迹地的林木覆盖度高,草本覆盖度低,如果按照以上标准,林地将会被划分到草本覆盖度小于74%区域,但是林地火烧迹地的NBR变化很明显,需要设置一个较高的阈值。因此,针对林地,增设一条规则,对林木覆盖度大于等于10%的区域,dNBR阈值设 置为280。综上,火烧迹地提取规则描述如式(3) 所示。
Tree Cover 10 时, dNBR × 1000 > 280 Tree Cover < 10 时, Herbaceous Cover 74 dNBR × 1000 > 200 Herbaceous Cover < 74 dNBR × 1000 > 150 (3)
3.2.4 提取火烧迹地
本文的火烧迹地提取算法归纳如下:
(1)对MOD09A1地表反射率数据、MOD44B植被覆盖度数据进行预处理(重投影、重采样、裁 剪等);
(2)计算每2期影像的NBR差值dNBR;
(3)利用MOD09A1产品中的质量评价数据,将质量不好的像元对应的dNBR值设为-10;
(4)利用上文的提取规则,逐像元进行判断:符合规则的即为火烧迹地,否则为非火烧迹地;
(5)将多期影像提取的火烧迹地合成,得到某一时段的火烧迹地分布图。

4 精度验证与结果分析

本文选择30 m空间分辨率的TM影像、MODIS标准火烧迹地产品MCD45A1在该地区的检测结果、不利用植被覆盖度数据的算法提取结果,与本文算法的火烧迹地检测结果比较,定性评价本文算法效果。
图3(a)是利用TM影像的第1、5、7波段假彩色合成的影像,通过目视解译可以看出研究区的火烧迹地在影像上的特征非常明显,正在燃烧的区域还有烟雾。目视解译的结果如图3(b)所示,本文算法结果如图3(c)所示,火烧迹地提取效果较好。与图3(d)的MODIS标准产品相比,二者结果在空间位置和分布上具有较强的一致性,但在红色椭圆内,MODIS标准产品提取出来的火烧迹地零散,反映不出火烧迹地本来的地理位置和分布特征,而本文算法的提取结果明显优于MODIS标准产品。
图3(e)则是同样采用dNBR阈值法,仅利用草本覆盖度数据、没有利用林木覆盖度数据的对照结果,可以看出蓝色椭圆内,误判现象非常明显,而蓝色椭圆的主要土地覆盖类型是混交林。图3(f)是利用林木覆盖度、没有利用草本覆盖度数据的对照结果,对林木覆盖度小于10%的区域,dNBR阈值设置为150,该提取结果在黄色椭圆内的误判现象明显,而且在火烧迹地的边缘部分,将一些非火烧迹地像元误判为火烧迹地。由图3(e)和图3(f)的对比可知,利用植被覆盖度数据,可以提高火烧迹地提取的精度。
本文算法、不利用草本覆盖度、不利用林木覆盖度、MODIS产品的kappa系数分别为0.75、0.73、0.69和0.70。即精度高低顺序为:本文算法>不利用草本覆盖度>MODIS产品>不利用林木覆盖度。本文算法仍然存在一些误判、漏判现象:误判主要体现在一些小斑块上;漏判则主要包括正在发生或刚发生不久的火灾(NBR指数的变化没有及时体现出来)、面积较小的火灾(受500 m空间分辨率的限制,难以检测出小火灾)、因质量不好被剔除而无法被检测到的火烧迹地域。
Fig. 3 Comparison of the extracted burned scar results from different data sources for the study area

图3 研究区的火烧迹地提取结果对比

5 结论与讨论

本文利用归一化燃烧率差分阈值法,并结合植被覆盖度(林木覆盖度、草本覆盖度)数据,设置规则提取火烧迹地。算法中的阈值选择并不是全自动的,但它并不依赖于分析者对区域特征的先验知识,消除了阈值选择的主观性。本文选择西伯利亚地区东南部的林地、草地、农田交界地带作为实验区,实验结果表明:(1)本文算法的火烧迹地提取效果较好,提取结果优于MODIS火烧迹地产品, kappa系数由0.70提高到0.75;(2)利用林木覆盖度、草本覆盖度数据,可以减少误判,提高火烧迹地提取的精度,kappa系数分别由0.69、0.73都提高到0.75。
本文算法火烧迹地提取结果的主要问题来源于输入数据:(1)由于MODIS产品空间分辨率为500 m,在火烧迹地边缘容易产生误差,即边缘的一个像元既包括火烧迹地,也包括非火烧迹地,如果空间分辨率不够精细,可能会导致过火面积估算值偏大;(2)对云覆盖度较高、燃烧导致烟雾释放的区域像元,利用MOD09A1产品的质量评价数据,会将这部分像元排除在外,可能导致火烧迹地的漏判;此外,MODIS表面反射率产品所用的质量评价算法,会漏掉一些低质量的像元。针对混合像元问题,可以利用混合像元分解技术,提高过火面积估算精度。针对地表反射率产品的质量问题,可以利用从Aqua卫星上获取的数据作补充,具体方法还有待进一步研究。

The authors have declared that no competing interests exist.

[1]
Pereira J M C, Sousa A M O, Sá A C L, et al. Regional-scale burnt area mapping in Southern Europe using NOAA-AVHRR 1 km data[A]. In: Remote Sensing of Large Wildfires[M]. Berlin: Springer Berlin Heidelberg, 1999:139-155.

[2]
周小成,汪小钦,高中灵.基于知识的多时相 TM 图像森林火烧迹地快速提取方法[J].灾害学,2005,20(2):22-26.本文以覆盖福州市及周边地区的五期TM图像为例,进行森林火烧迹 地的自动提取研究.分别对TM图像上火烧迹地及其背景地物采样,分析火烧迹地在TM图像6个波段及PC变换、TC变换、多时相植被指数(MTVI)上的光 谱特征,发现了火烧迹地与背景地物区分的光谱知识.其次,利用DEM数据分析火烧迹地在地形上的分布特点,发现了火烧迹地空间分布的知识规则.在此基础上 建立了基于知识的多时相TM图像上森林火烧迹地提取模型,从而解决了快速识别和提取森林火灾信息的问题.

DOI

[ Zhou X C, Wang X Q, Gao Z L.Method of fast extracting fire scars from multi-temporal TM images on the basis of knowledge available[J]. Journal of Catastrophology, 2005,20(2): 22-26. ]

[3]
Mitri G H, Gi tas I Z. Fire type mapping using object-based classification of Ikonos imagery[J]. International Journal of Wildland Fire, 2006,15(4):457-462.

[4]
Koutsias N, Karteris M, Chuvico E.The use of intensity-hue-saturation transformation of Landsat-5 Thematic Mapper data for burned land mapping[J]. Photogrammetric Engineering and Remote Sensing, 2000,66(7):829-840.Several techniques have been developed to detect and map burned areas using Landsat Thematic Mapper data, ranging from simple ones, such as visual analysis, to more complex, such as spectral mixture analysis. However, the Intensity-Hue-Saturation [IHS] transformation, a method mainly used for merging multiresolution and multispectral data and for contrast-stretching applications, has never been...

DOI

[5]
陈本清,徐涵秋.遥感技术在森林火灾信息提取中的应用[J].福州大学学报:自然科学版,2001,29(2):23-26.利用森林火灾后的TM影像,应用最佳波段监督分类法、第三主成分 分量(PC3)滤波阈值法和IHS变换法对罗源县境内的历年森林火灾信息进行提取.通过对比发现最佳波段监督分类法和PC3滤波阈值法的森林火灾信息提取 精度较高,而IHS变化法效果较差.同时还分析了影响精度的原因,提出利用地形、地理特征来提高火烧迹地信息提取精度的观点.

DOI

[ Chen B Q, Xu H Q.The application of remote sensing in extraction of forest burnt scar information[J]. Journal of Fuzhou University (Natural Science), 2001,29(2):23-26. ]

[6]
刘诚,李亚军,赵长海,等.气象卫星亚像元火点面积和亮温估算方法[J].应用气象学报,2004,15(3):273-280.该文给出了利用极轨气象卫星AVHRR多个红外通道资料在不同火点强度条件下估算亚像元火点面积和温度的方法,包括利用牛顿迭代法求解不同红外波段(如:中红外3.7um通道和热红外11um通道,或短波红外1.6um通道和热红外11um通遭)混合像元表达式建立的二元非线性方程组,得到亚像元火点面积和温度;通过建立亚像元火点面积和温度与11um混合像元亮温增量和11um与12um混合像元亮温增量差异的关系,以查表方式获得对于相同红外波段不同通道(如11um和12um通道)亚像元火点面积和温度估算值。

DOI

[ Liu C, Li Y J, Zhao C H, et al. The method of evaluation sub-pixel size and temperature of fire spot in AVHRR data[J]. Journal of Applied Meteorological Science, 2004,15(3):273-280. ]

[7]
张顺谦,郭海燕,卿清涛.利用遥感监测亚像元分解遗传算法估算森林火灾面积[J].中国农业气象,2007,28(2):198-200.牛顿迭代法是林火亚像元分解的常用算法,但其火区面积计算精度取决于背景温度的估算精度,遗 传算法具有全局寻优能力,本文尝试以火区面积百分比Af、火区温度Tf、背景温度Tbg为优化变量,采用RAGA遗传算法对林火亚像元辐射率平衡方程全局 寻优求解。结果表明:用RAGA遗传算法比牛顿迭代法计算的结果更符合实际,迭代误差低2个数量级,用此方法对2005年四川省木里县三处森林火灾某时刻 燃烧区面积进行估算,其结果对火情通报和火灾扑救工作具有重要的参考价值。

DOI

[ Zhang S Q, Guo H Y, Qing Q T.Estimate of forest fire area by using RAGA genetic algorithms in sub-pixel decompound based on remote sensing monitoring[J]. Chinese Journal of Agrometeorology, 2007,28(2):198-200. ]

[8]
Martín M P, Gómez I, Chuvieco E. Burnt Area Index (BAIM) for burned area discrimination at regional scale using MODIS data[J]. Forest Ecology and Management, 2006,234:S221.burnt area index (baim) for burned area discrimination at regional scale using modis data

DOI

[9]
Key C H, Benson N C.Measuring and remote sensing of burn severity[C]. US Geological Survey wildland fire workshop. Washington, DC: US Geological Survey, 2002,31:2-11.

[10]
Quintano C, Fernández-Manso A, Stein A, et al. Estimation of area burned by forest fires in Mediterranean countries: a remote sensing data mining perspective[J]. Forest Ecology and Management, 2011,262(8):1597-1607.Forest fires throughout the world result in tree mortality that can cause substantial timber and losses. There is a critical need to map the areas burned by such fires to guide forest management decisions. Moderate Resolution Imaging Spectroradiometer (MODIS) satellite imagery provides inexpensive and frequent coverage over large areas, facilitating forest health monitoring. In this study a MODIS post-fire image at a spatial resolution of 250m serves as the starting point of an image mining based method. It involves three algorithms: modeling as a sum of Gaussian functions, kernel based smoothing, and adaptive thresholding. Adaptive thresholding serves as the reference to be compared to the image mining based method. Three spectral indices specifically designed for burned area identification have been used: the Burned Area Index (BAI), the Burned Area Index adapted to MODIS bands (BAIM), and the Normalized Burn Ratio (). The κ statistic is applied to quantify the accuracy of the burned areas estimations by relating the estimated area with burned area perimeters measured on the ground by Global Positioning System (GPS). In addition, the κ statistic allows us to identify both the optimal spectral index and the optimal algorithms’ parameters. In this work, an accurate estimation (κ>0.8) of areas burned by forest fires in Mediterranean countries is achieved, in particular if the BAIM index is used. The accuracy of these estimates is compared with the accuracy obtained by using the reference method by a McNemar’s test. Results show that our image mining based method allows a higher accuracy (the average increase of κ equals to 16%) than the reference method. We conclude that this method adequately maps burned areas, and that it may help management agencies to better understand of landscape-scale burn patterns.

DOI

[11]
Hilker T, Wulder M A, Coops N C, et al. A new data fusion model for high spatial-and temporal-resolution mapping of forest disturbance based on Landsat and MODIS[J]. Remote Sensing of Environment, 2009,113(8):1613-1627.Investigating the temporal and spatial pattern of landscape disturbances is an important requirement for modeling ecosystem characteristics, including understanding changes in the terrestrial carbon cycle or mapping the quality and abundance of wildlife habitats. Data from the Landsat series of satellites have been successfully applied to map a range of biophysical vegetation parameters at a 30...

DOI

[12]
Mouillot F, Schultz M G, Yue C, et al. Ten years of global burned area products from spaceborne remote sensing—a review: analysis of user needs and recommendations for future developments[J]. International Journal of Applied Earth Observation and Geoinformation, 2014,26:64-79.Early global estimates of carbon emissions from biomass burning were based on empirical assumptions of fire return interval in different biomes in the 1980s. Since then, significant improvements of spaceborne remote sensing sensors have resulted in an increasing number of derived products characterizing the detection of active fire or the subsequent burned area (GFED, MODIS MCD45A1, L3JRC, Globcarbon, GBS, GLOBSCAR, GBA2000). When coupled with global land cover and vegetation models allowing for spatially explicit fuel biomass estimates, the use of these products helps to yield important information about the spatial and the temporal variability of emission estimates. The availability of multi-year products (>10 years) leads to a better understanding of uncertainties in addition to increasing accuracy. We surveyed a wide range of users of global fire data products whilst also undertaking a review of the latest scientific literature. Two user groups were identified, the first being global climate and vegetation modellers and the second being regional land managers. Based on this review, we present here the current needs covering the range of end-users. We identified the increasing use of BA products since the year 2000 with an increasing use of MODIS as a reference dataset. Scientific topics using these BA products have increased in diversity and area of application, from global fire emissions (for which BA products were initially developed) to regional studies with increasing use for ecosystem management planning. There is a significant need from the atmospheric science community for low spatial resolution (gridded, 1/2 degree cell) and long time series data characterized with supplementary information concerning the accuracy in timing of the fire and reductions of omission/commission errors. There is also a strong need for precisely characterizing the perimeter and contour of the fire scar for better assimilation with land cover maps and fire intensity. Computer and earth observation facilities remain a significant gap between ideal accuracies and the realistic ones, which must be fully quantified and comprehensive for an actual use in global fire emissions or regional land management studies.

DOI

[13]
Cahoon D R, Stocks B J, Levine J S, et al. Satellite analysis of the severe 1987 forest fires in northern China and southeastern Siberia[J]. Journal of Geophysical Research: Atmospheres (1984-2012), 1994,99(D9):18627-18638.CiteSeerX - Document Details (Isaac Councill, Lee Giles): Abstract. Meteorological conditions, extremely conducive to fire development and spread in the spring of 1987, resulted in forest fires burning over extremely large areas in the boreal forest zone in northeastern China and the southeastern region of Siberia. The great China fire, one of the largest and most destructive forest fires in recent history, occurred during this period in the Heilongjiang Province of China. Satellite imagery is used to examine the development and areal distribution of 1987 forest fires in this region. Overall trace gas emissions to the atmosphere from these fires are determined using a satellite-derived estimate of area burned in combination with fuel consumption figures and carbon emission ratios for boreal forest fires.

DOI

[14]
尤慧,刘荣高,祝善友,等.加拿大北方森林火烧迹地遥感分析[J].地球信息科学学报,2013,15(4):597-603.森林火灾是加拿大北方森林地区最主要的扰动因素,对北方生态系统起着主导作用。基于MODIS数据,采用全球扰动指数算法(MGDI),对加拿大萨斯喀彻温省和亚伯达省2004-2011年的森林火烧迹地进行检测和分析。通过与MODIS标准火烧迹地产品以及加拿大林业局数据进行比较,扰动指数算法检测的火烧迹地面积比MODIS标准产品更接近于林业局的统计数据。分析表明,在2004-2011年间,由于火灾原因,整个研究区森林面积平均每年减少76.36万hm2,占该区域森林总面积的3.36%。萨斯喀彻温省平均每年燃烧的森林面积为46.83万hm2,亚伯达省为29.53万hm2。其中,2006、2008、2010和2011年是火灾的高峰年份。火烧迹地主要集中在生态交错带的北方保护区、针叶林保护区、针叶林平原区,以及北方平原东北部的伍德布法罗国家森林保护区。

DOI

[ You H, Liu R G, Zhu S Y, et al. Burned area detection in the Canadian boreal forest using MODIS imagery[J]. Journal of Geo-Information Science, 2013,15(4):597-603. ]

[15]
Martín M P, Díaz Delgado R, Chuvieco E, et al. Burned land mapping using NOAA-AVHRR and TERRA-MODIS[C]. IV International Conference on Forest Fire Research, 2002:45.

[16]
Roy D P, Boschetti L, Justice C O, et al. The collection 5 MODIS burned area product - global evaluation by comparison with the MODIS active fire product[J]. Remote Sensing of Environment, 2008,112(9):3690-3707.The results of the first consecutive 12months of the NASA Moderate Resolution Imaging Spectroradiometer (MODIS) global burned area product are presented. Total annual and monthly area burned statistics and missing data statistics are reported at global and continental scale and with respect to different land cover classes. Globally the total area burned labeled by the MODIS burned area product is 3.6602×0210 6 km 2 for July 2001 to June 2002 while the MODIS active fire product detected for the same period a total of 2.7802×0210 6 km 2 , i.e., 24% less than the area labeled by the burned area product. A spatio-temporal correlation analysis of the two MODIS fire products stratified globally for pre-fire leaf area index (LAI) and percent tree cover ranges indicate that for low percent tree cover and LAI, the MODIS burned area product defines a greater proportion of the landscape as burned than the active fire product; and with increasing tree cover (>0260%) and LAI (>025) the MODIS active fire product defines a relatively greater proportion. This pattern is generally observed in product comparisons stratified with respect to land cover. Globally, the burned area product reports a smaller amount of area burned than the active fire product in croplands and evergreen forest and deciduous needleleaf forest classes, comparable areas for mixed and deciduous broadleaf forest classes, and a greater amount of area burned for the non-forest classes. The reasons for these product differences are discussed in terms of environmental spatio-temporal fire characteristics and remote sensing factors, and highlight the planning needs for MODIS burned area product validation.

DOI

[17]
Garcia M J L, Caselles V. Mapping burns and natural reforestation using Thematic Mapper data[J]. Geocarto International, 1991,6(1):31-37.ABSTRACT Remote sensing techniques are specially suitable to detect and to map areas affected by forest fires. In this work, Landsat 5 Thematic Mapper (TM) data has been used to study a number of forest fires that occurred in the province of Valencia (Spain) and to monitor the vegetation regeneration over burnt areas.A reference area (non‐burnt forest) was established to assess the change produced by fire. The radiance in the thermal band (10.4&ndash;12.5 μm) and the normalized difference in reflectance between near 1R (0.76&ndash;0.90 μm) and middle IR (2.08&ndash;2.35 μm) were the most suitable parameters to map burnt areas. This index can also be used for monitoring vegetation regeneration in burnt areas. About a month after the fire, the burns show temperatures of 5&ndash;6 °C higher than those found in the reference area, and the vegetation index shows negative values whereas the reference area values remain positive. The differences between the burns and the reference area for the vegetation index decrease with time as vegetation regenerates.

DOI

[18]
Loboda T, O'Neal K J, Csiszar I. Regionally adaptable dNBR-based algorithm for burned area mapping from MODIS data[J]. Remote Sensing of Environment, 2007,109(4):429-442.Recent advances in instrument design have led to considerable improvements in wildfire mapping at regional and global scales. Global and regional active fire and burned area products are currently available from various satellite sensors. While only global products can provide consistent assessments of fire activity at the global, hemispherical or continental scales, the efficiency of their performance differs in various ecosystems. The available regional products are hard-coded to the specifics of a given ecosystem (e.g. boreal forest) and their mapping accuracy drops dramatically outside the intended area. We present a regionally adaptable semi-automated approach to mapping burned area using Moderate Resolution Imaging Spectroradiometer (MODIS) data. This is a flexible remote sensing/GIS-based algorithm which allows for easy modification of algorithm parameterization to adapt it to the regional specifics of fire occurrence in the biome or region of interest. The algorithm is based on Normalized Burned Ratio differencing (dNBR) and therefore retains the variability of spectral response of the area affected by fire and has the potential to be used beyond binary burned unburned mapping for the first-order characterization of fire impacts from remotely sensed data. The algorithm inputs the MODIS Surface Reflectance 8-Day Composite product (MOD09A1) and the MODIS Active Fire product (MOD14) and outputs yearly maps of burned area with dNBR values and beginning and ending dates of mapping as the attributive information. Comparison of this product with high resolution burn scar information from Landsat ETM+ imagery and fire perimeter data shows high levels of accuracy in reporting burned area across different ecosystems. We evaluated algorithm performance in boreal forests of Central Siberia, Mediterranean-type ecosystems of California, and sagebrush steppe of the Great Basin region of the US. In each ecosystem the MODIS burned area estimates were within 15% of the estimates produced by the high resolution base with the R

DOI

[19]
Epting J, Verbyla D, Sorbel B.Evaluation of remotely sensed indices for assessing burn severity in interior Alaska using Landsat TM and ETM+[J]. Remote Sensing of Environment, 2005,96(3-4):328-339.We evaluated 13 remotely sensed indices across four wildfire burn sites in interior Alaska. The indices included single bands, band ratios, vegetation indices, and multivariate components. Each index was evaluated with post-burn and differenced pre/post-burn index values. The indices were evaluated by examining the correlation between each remotely sensed index and field-based Composite Burn Index (CBI) values. Radiant temperature was strongly correlated with field-based CBI when a post-fire image from autumn was used. Indices that used red and near-infrared bands performed poorly relative to indices that incorporated mid-infrared bands. The Normalized Burn Ratio (NBR), which incorporates near- and mid-infrared bands, was ranked within the top three indices for each of the four burns using post-burn images, and for three of the four burns using pre- and post-burn images. When indices were summed based on ranked correlations, the NBR was highest for both the post-burn and pre/post-burn approaches. The NBR had high correlations with the field-based CBI in closed needleleaf, mixed, and broadleaf forest classes. However, the NBR was useful as an index of burn severity only for forested sites. The correlation between NBR and field-based CBI was low in non-forested classes such as woodland, scrub, and herb land cover classes.

DOI

[20]
Wagtendonk J W V, Root R R, Key C H. Comparison of AVIRIS and Landsat ETM+ detection capabilities for burn severity[J]. Remote Sensing of Environment, 2004,92(3):397-408.Our study compares data on burn severity collected from multi-temporal Airborne Visible and Infrared Imaging Spectrometer (AVIRIS) with similar data from the Enhanced Thematic Mapper Plus (ETM+) using the differenced Normalized Burn Ratio (dNBR). Two AVIRIS and ETM+ data acquisitions recorded surface conditions immediately before the Hoover Fire began to spread rapidly and again the following year. Data were validated with 63 field plots using the Composite Burn Index (CBI). The relationship between spectral channels and burn severity was examined by comparing pre- and post-fire datasets. Based on the high burn severity comparison, AVIRIS channels 47 and 60 at wavelengths of 788 and 913 nm showed the greatest negative response to fire. Post-fire reflectance values decreased the most on average at those wavelengths, while channel 210 at 2370 nm showed the greatest positive response on average. Fire increased reflectance the most at that wavelength over the entire measured spectral range. Furthermore, channel 210 at 2370 nm exhibited the greatest variation in spectral response, suggesting potentially high information content for fire severity. Based on general remote sensing principles and the logic of variable spectral responses to fire, dNBR from both sensors should produce useful results in quantifying burn severity. The results verify the band鈥搑esponse relationships to burn severity as seen with ETM+ data and confirm the relationships by way of a distinctly different sensor system.

DOI

[21]
胡海清,周振宝,焦燕.俄罗斯森林火灾现状统计分析[J].世界林业研究,2006,19(2):74-78.文中分阶段统计了1950~2000年俄罗斯森林火灾发生的次数和面积,详细分析了1990~2003年森林火灾状况,并且讨论了森林火灾产生的原因.森林火灾分级、特点、防火组织机构、研究现状和林火管理的改进措施也在文中进行了介绍.

DOI

[ Hu H Q, Zhou Z B, Jiao Y.Statistical analysis on current status of forest fire in Russian Federation[J]. World Forest Research, 2006,19(2):74-78. ]

[22]
Friedl M A, Sulla-Menashe D, Tan B, et al. MODIS collection 5 global land cover: algorithm refinements and characterization of new datasets[J]. Remote Sensing of Environment, 2010,114(1):168-182.Information related to land cover is immensely important to global change science. In the past decade, data sources and methodologies for creating global land cover maps from remote sensing have evolved rapidly. Here we describe the datasets and algorithms used to create the Collection 5 MODIS Global Land Cover Type product, which is substantially changed relative to Collection 4. In addition to using updated input data, the algorithm and ancillary datasets used to produce the product have been refined. Most importantly, the Collection 5 product is generated at 500-m spatial resolution, providing a four-fold increase in spatial resolution relative to the previous version. In addition, many components of the classification algorithm have been changed. The training site database has been revised, land surface temperature is now included as an input feature, and ancillary datasets used in post-processing of ensemble decision tree results have been updated. Further, methods used to correct classifier results for bias imposed by training data properties have been refined, techniques used to fuse ancillary data based on spatially varying prior probabilities have been revised, and a variety of methods have been developed to address limitations of the algorithm for the urban, wetland, and deciduous needleleaf classes. Finally, techniques used to stabilize classification results across years have been developed and implemented to reduce year-to-year variation in land cover labels not associated with land cover change. Results from a cross-validation analysis indicate that the overall accuracy of the product is about 75% correctly classified, but that the range in class-specific accuracies is large. Comparison of Collection 5 maps with Collection 4 results show substantial differences arising from increased spatial resolution and changes in the input data and classification algorithm.

DOI

[23]
Vermote E F, El Saleous N Z, Justice C O. Atmospheric correction of MODIS data in the visible to middle infrared: first results[J]. Remote Sensing of Environment, 2002,83(1):97-111.The MODIS instrument provides major advances in moderate resolution earth observation. Improved spatial resolution for land observation at 250 and 500 m and improved spectral band placement provide new remote sensing opportunities. NASA has invested in the development of improved algorithms for MODIS, which will provide new data sets for global change research. Surface reflectance is one of the key products from MODIS and is used in developing several higher-order land products. The surface reflectance algorithm builds on the heritage of the Advanced Very High Resolution Radiometer (AVHRR) and SeaWiFS algorithms, taking advantage of the new sensing capabilities of MODIS. Atmospheric correction by the removal of water vapor and aerosol effects provides improvements over previous coarse resolution products and the basis for a new time-series, which will extend through to the NPOESS generation imagers. This paper summarizes the first evaluation of the MODIS surface reflectance product accuracy, in comparison with other data products and in the context of the MODIS instrument performance since launch. The MODIS surface reflectance product will provide an important time-series data set for quantifying global environmental change.

DOI

[24]
Hansen M C, DeFries R S, Townshend J R G, et al. Global percent tree cover at a spatial resolution of 500 meters: first results of the MODIS vegetation continuous fields algorithm[J]. Earth Interactions, 2003,7(10):1-15.

Options
文章导航

/