
基于PS-InSAR和GIS的北京平原区建筑荷载对地面沉降的影响
作者简介:周朝栋(1989-),男,硕士生,主要从事微波遥感、城市地面沉降方面研究。E-mail: giszcd@yeah.net
收稿日期: 2016-06-14
要求修回日期: 2016-08-31
网络出版日期: 2016-11-20
基金资助
国家自然科学基金重点项目“北京地区地面沉降三维形变及演化机理研究”(41130744)
国家自然科学基金面上项目“地下水降落漏斗区动静载荷演化诱发地面沉降机理研究”(41171335)
国家自然科学基金项目“地下水流场稳定区动静载荷差异模式下地面沉降响应机理”(4140010982)
The Influence of Building Load to Land Subsidence in Beijing Plain based on PS-InSAR and GIS
Received date: 2016-06-14
Request revised date: 2016-08-31
Online published: 2016-11-20
Copyright
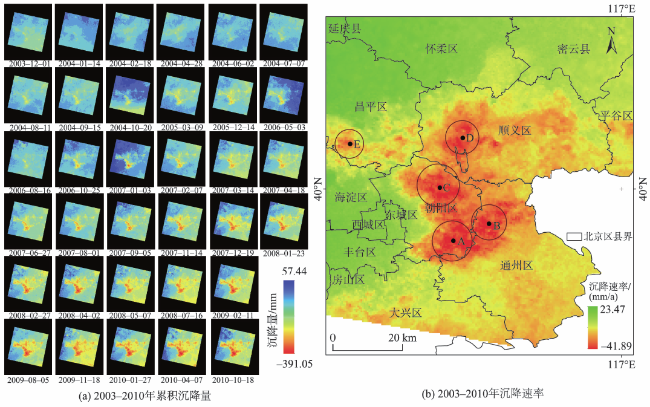
北京平原区地面沉降问题日益突出,成因复杂,既包括人为地下水开采和城市建筑荷载作用,又包括自然土体固结和活动构造影响。地下水开采和建筑荷载是重要的驱动因素。如何提取区域尺度建筑载荷,评价其对地面沉降影响,是地面沉降灾害防治工作需要开展的重要环节。本文以简化后的容积率表征建筑载荷,首先利用PS-InSAR技术获取研究区地面沉降信息,然后使用GIS空间分析的方法提取出同等地下水开采影响下的不均匀沉降分布,其次采用阴影长度法提取了研究区建筑体高度,最终结合空间分析和回归分析方法研究建筑容积率与地面沉降之间的关系。主要研究结论:① 北京地区地面沉降比较严重,沉降速率大于30 mm/a的区域占比21.08%;② 地下水开采同等影响下的不均匀沉降区呈H形分布于平原区中部和北部;③ 阴影长度法能够较准确的评估出建筑容积率,可用于区域尺度静载荷的提取与分析;④ 在地质条件相似、水位变化相同的局部区域内,地面沉降速率与建筑容积率具有一定相关性,但相关系数较低。
周朝栋 , 宮辉力 , 张有全 , 段光耀 . 基于PS-InSAR和GIS的北京平原区建筑荷载对地面沉降的影响[J]. 地球信息科学学报, 2016 , 18(11) : 1551 -1562 . DOI: 10.3724/SP.J.1047.2016.01551
Land subsidence in Beijing plain is becoming increasingly acute. The causes of land subsidence are complicated, including artificial over-exploration of groundwater and building load as well as natural soil consolidation and the influence of active structure. Over-exploration of groundwater and building load are the two important driving factors in the land subsidence of Beijing Plain. What we have focused on is how regional scale building load should be extracted and evaluated. In this paper, the simplified plot ratio stands for the building load and the land subsidence information of the study area is measured by PS-InSAR technique. We get the uneven subsidence distribution under the same groundwater exploration by the way of GIS spatial analysis. Meanwhile, building height is extracted by the way of Shadow's Length Method with high-resolution optical images. At last, the relationship between building load and land subsidence is studied by spatial analysis and regression analysis. The main conclusions obtained are as follows: (1) Land subsidence in Beijing is very serious during 2003-2010, the percentage of 30mm/a-41.89mm/a area is 21.08%. (2) The uneven subsidence distribution under the same groundwater exploration is located in the central and northern Beijing as an H shape. (3) Shadow's Length Method can accurately estimate the plot ratio, which can be used to extract regional scale building load. (4) Land subsidence rate has a correlation with building plot ratio in similar geological condition and ground water level changing area but the correlation coefficient is small.
Key words: land subsidence; PS-InSAR; building load; plot ratio; GIS
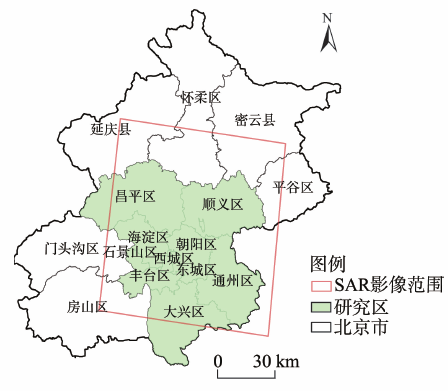
Fig. 1 Location of study area图1 研究位置 |
Tab. 1 Main data types and sources表1 研究区主要数据类型及来源 |
| 序号 | 轨道号 | 影像时间 | 序号 | 轨道号 | 影像时间 | 序号 | 轨道号 | 影像时间 |
|---|---|---|---|---|---|---|---|---|
| 1 | 09290 | 2003-12-10 | 17 | 25322 | 2007-01-03 | 33 | 34340 | 2008-09-24 |
| 2 | 09791 | 2004-01-14 | 18 | 25823 | 2007-02-07 | 34 | 34841 | 2008-10-29 |
| 3 | 10292 | 2004-02-18 | 19 | 26324 | 2007-03-14 | 35 | 35342 | 2008-12-03 |
| 4 | 10793 | 2004-03-24 | 20 | 26825 | 2007-04-18 | 36 | 35843 | 2009-01-07 |
| 5 | 11294 | 2004-04-28 | 21 | 27827 | 2007-06-27 | 37 | 36344 | 2009-02-11 |
| 6 | 11795 | 2004-06-02 | 22 | 28328 | 2007-08-01 | 38 | 36845 | 2009-03-18 |
| 7 | 12296 | 2004-07-07 | 23 | 28829 | 2007-09-05 | 39 | 38348 | 2009-07-01 |
| 8 | 12797 | 2004-08-11 | 24 | 29330 | 2007-10-10 | 40 | 38849 | 2009-08-05 |
| 9 | 13298 | 2004-09-15 | 25 | 29831 | 2007-11-14 | 41 | 39350 | 2009-09-09 |
| 10 | 13799 | 2004-10-20 | 26 | 30332 | 2007-12-19 | 42 | 39851 | 2009-10-14 |
| 11 | 14801 | 2004-12-29 | 27 | 30833 | 2008-01-23 | 43 | 40352 | 2009-11-18 |
| 12 | 15803 | 2005-03-09 | 28 | 31334 | 2008-02-27 | 44 | 40853 | 2009-12-23 |
| 13 | 19811 | 2005-12-14 | 29 | 31835 | 2008-04-02 | 45 | 41354 | 2010-01-27 |
| 14 | 21815 | 2006-05-03 | 30 | 32336 | 2008-05-07 | 46 | 41855 | 2010-03-03 |
| 15 | 23318 | 2006-08-16 | 31 | 33338 | 2008-07-16 | 47 | 42356 | 2010-04-07 |
| 16 | 24320 | 2006-10-25 | 32 | 33839 | 2008-08-20 | 48 | 45133 | 2010-10-18 |
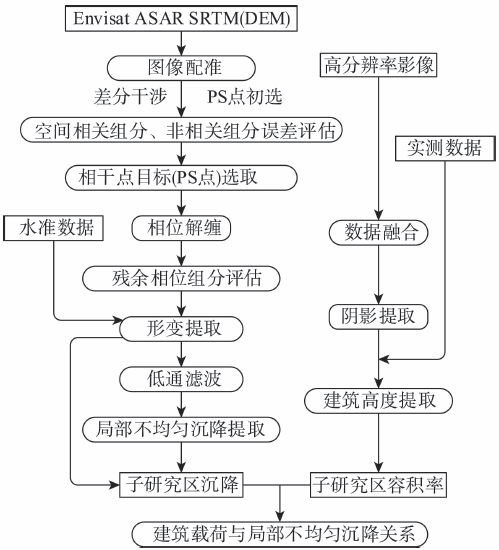
Fig. 2 Technique flow chart图2 研究技术流程图 |
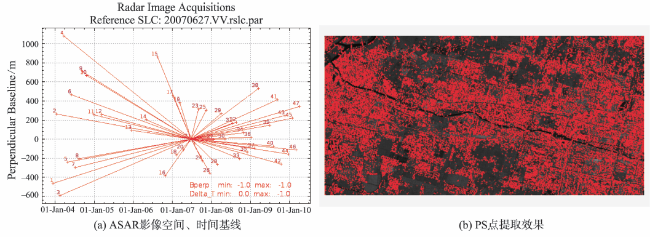
Fig. 3 PS-InSAR data processing procedures图3 PS-InSAR数据处理过程图 |
Fig. 4 The computation of uneven subsidence图4 不均匀沉降区域计算 |
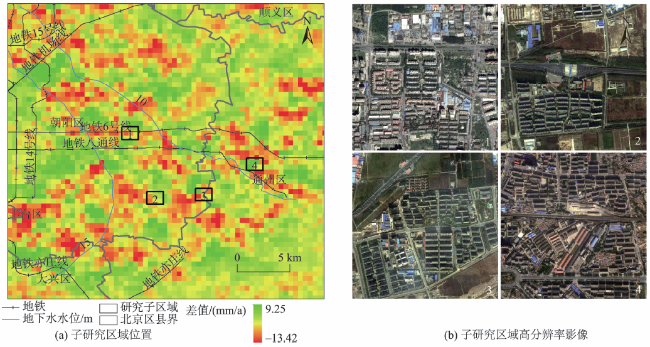
Fig. 5 Sub study area图5 子研究区域 |
Tab. 2 The parameters of high resolution image表2 高分辨率影像参数 |
| 影像 类型 | 太阳方位角/° | 太阳高度角/° | 卫星方位角/° | 卫星高度角/° | 时间 |
|---|---|---|---|---|---|
| QuickBird GeoEye | 171.30 142.89 | 34.40 60.97 | 236.20 177.52 | 68.60 73.63 | 2008-11-04 2009-08-11 |
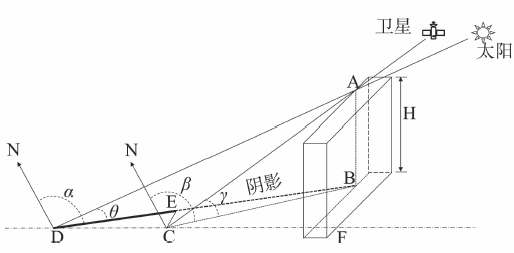
Fig. 6 The relationship between building shadow, sun and satellite’s altitude and azimuth angles图6 太阳和卫星高度角、方位角与地面建筑阴影的关系 |
Fig. 7 The result of land subsidence图7 沉降结果图 |
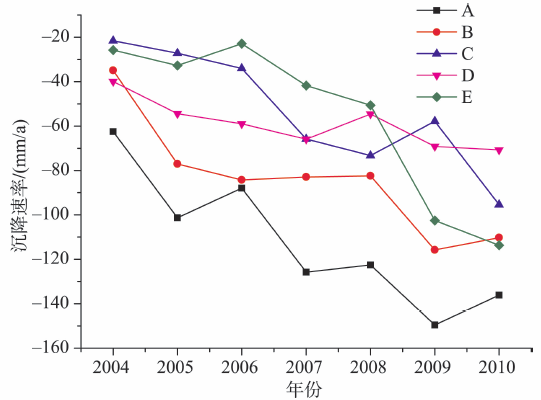
Fig. 8 Timeseriesof subsidence rate of the funnel center图8 漏斗中心时序沉降速率图 |
Tab. 3 Comparison between leveling and PS-InSAR measurements表3 水准结果与PS-InSAR测量结果对比 |
| 水准测点 | 纬度/° | 经度/° | 水准形变/mm | PS-视线向形变/mm | 差值/mm | 时间 |
|---|---|---|---|---|---|---|
| 天竺 | 40.06674 | 116.58833 | -32.91 | -34.36 | 1.45 | 2010-01-27至2010-10-18 |
| 新建村 | 39.92544 | 116.65795 | -37.50 | -35.83 | 1.67 | 2009-10-14至2010-10-18 |
| 龙旺庄 | 39.92245 | 116.68558 | -30.50 | -30.55 | 0.05 | 2009-10-14至2010-10-18 |
注:水准测量值为与SAR影像监测同期的水准测量结果 |
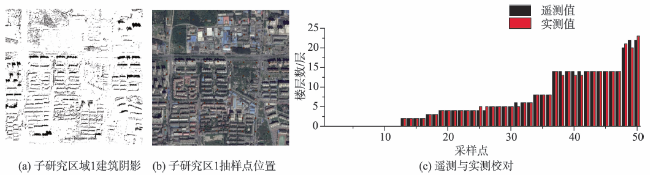
Fig. 9 The floors’ acquisition and proof图9 楼层提取与校对 |
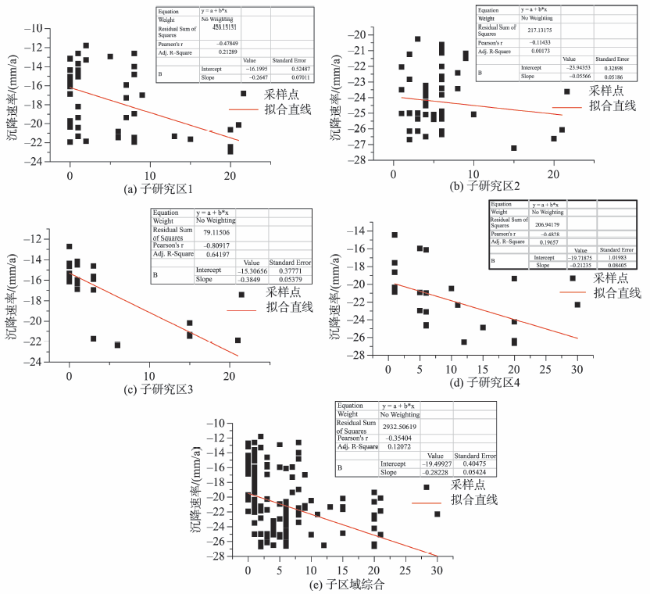
Fig. 10 The result of regression analysis图10 回归分析结果 |
The authors have declared that no competing interests exist.
| [1] |
|
| [2] |
[
|
| [3] |
|
| [4] |
[
|
| [5] |
[
|
| [6] |
[
|
| [7] |
|
| [8] |
|
| [9] |
|
| [10] |
[
|
| [11] |
Devin L G. Thomas J B.Review: regional land subsidence accompanying groundwater extraction. Hydrogeology Journal, 2011,19:1459-1486.
|
| [12] |
|
| [13] |
|
| [14] |
[
|
| [15] |
[
|
| [16] |
[
|
| [17] |
[
|
| [18] |
[
|
| [19] |
[
|
| [20] |
[
|
| [21] |
[
|
| [22] |
[
|
| [23] |
[
|
| [24] |
[
|
| [25] |
[
|
| [26] |
|
| [27] |
[
|
| [28] |
[
|
| [29] |
|
| [30] |
[
|
| [31] |
[
|
| [32] |
中华人民共和国建设部.中华人民共和国国家标准住宅建筑规范GB 50386-2005.
[
|
/
| 〈 |
|
〉 |
