
京津唐地区细菌性痢疾社会经济影响时空分析
作者简介:李媛媛(1990-),女,山西人,硕士生,研究方向为空间分析。E-mail:lyy@lreis.ac.cn
收稿日期: 2016-07-30
要求修回日期: 2016-10-15
网络出版日期: 2016-12-20
基金资助
中科院战略先导专项子题: 应对气候变化的碳收支认证及相关问题/100年来区域年均温估算(XDA05090102)
国家“973”计划项目:气候变化对人类健康的影响与适应机制/气候—健康脆弱人群识别和风险区划(2012CB955503)
Spatial-temporal Analysis of Social-economic Factors of Bacillary Dysentery inBeijing-Tianjin-Tangshan, China
Received date: 2016-07-30
Request revised date: 2016-10-15
Online published: 2016-12-20
Copyright
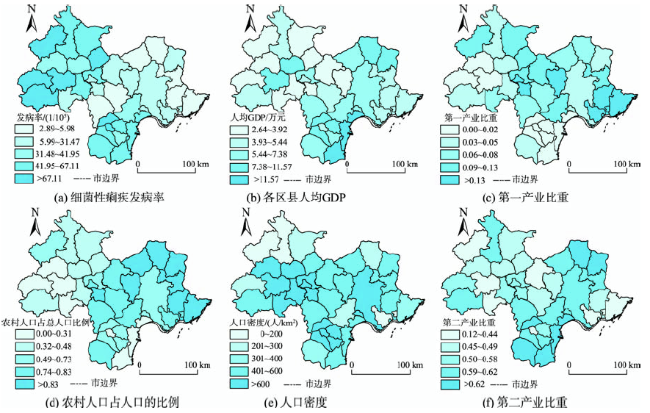
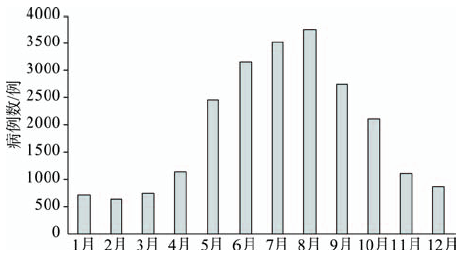
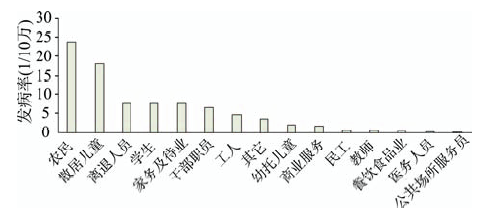
细菌性痢疾是常见疾病,也是备受关注的公共健康问题。近年来,京津唐地区的细菌性痢疾发病率相对较高。本文首先分析了2012年京津唐地区细菌性痢疾的季节性和人群特征;其次,使用热点分析模型,探索了京津唐地区细菌性痢疾发病率的时空聚集性;最后,运用地理探测器模型研究了细菌性痢疾的发生和社会经济因素之间的量化关系。结果表明:① 细菌性痢疾发病的峰值时间是8月;发病率最高的年龄段是0-9岁,其次是80岁以上;农民群体发病率最高,其次是散居儿童。② 京津唐地区细菌性痢疾在空间和时间上都存在聚集性。空间上,细菌性痢疾发病率的高聚集区主要分布于北京市的房山区及门头沟区和天津市的滨海新区,低聚集区主要分布于唐山市的滦县,时间上,细菌性痢疾发病率的高聚集区在12个月均有发生,低聚集区主要发生在1-4月以及6月。③ 影响细菌性痢疾发病率空间分布的主要社会经济因素为农村人口占总人口的比例、人口密度和各区县的人均GDP,它们的解释力分别为61%,37%和20%,并且发现它们的交互作用都大于独自影响的作用。本研究通过对京津唐地区细菌性痢疾发病情况的人群特征、时空特征以及影响因素的分析,为本地区细菌性痢疾的预防和控制提供理论依据。
李媛媛 , 徐成东 , 肖革新 , 罗广祥 . 京津唐地区细菌性痢疾社会经济影响时空分析[J]. 地球信息科学学报, 2016 , 18(12) : 1615 -1623 . DOI: 10.3724/SP.J.1047.2016.01615
Bacillary dysentery is a common disease as well as a public health problem with much attention. In recent years, the incidence of bacterial dysentery is rather prevalent in Beijing-Tianjin-Tangshan region. This paper analyzed the seasonal and population characteristics of bacillary dysentery in Beijing-Tianjin-Tangshan region in 2012 firstly. Then, we explored the spatial and temporal clustering of the incidence of bacillary dysentery by using hotspot analysis model. We also investigated the quantitative relationship between the incidence of bacterial dysentery and the social-economic factors by using geographical detector model. The results showed that: (1) the peak attack time of bacillary dysentery was August. The age range that had the highest incidence was 0-9 years old, followed by those above 80 years old. The population that had the highest incidence was farmers, followed by the scattered children. (2) The incidence of bacterial dysentery clustered in both space and time in Beijing-Tianjin-Tangshan region. In space, the high clustering regions for incidence of bacillary dysentery are mainly located in Fangshan District and Mentougou District of Beijing and Binhai New Area of Tianjin;the low clustering regions are mainly located in Luan county of Tangshan. In time, the disease occurred in all the 12 months in 2012 in the high clustering regions, but mainly occurred in January, February, March, April and June in the low clustering regions. (3) The major socio-economic factors affecting the spatial distribution of incidence of bacterial dysentery included the proportion of rural population, population density and per capita GDP of each district or county, which explanatory power was 61%, 37% and 20%, respectively. The interactive effects were stronger than their individual effects. This study analyzed the population characteristics, spatial and temporal characteristics and influencing factors of incidence of bacillary dysentery in Beijing-Tianjin-Tangshan region and provided a theoretical basis for the prevention and control of bacterial dysentery in these regions.
Fig. 1 The geographical distribution of bacillary dysentery morbidity and social-economy indices图1 细菌性痢疾发病率和社会经济指标的地理分布图 |
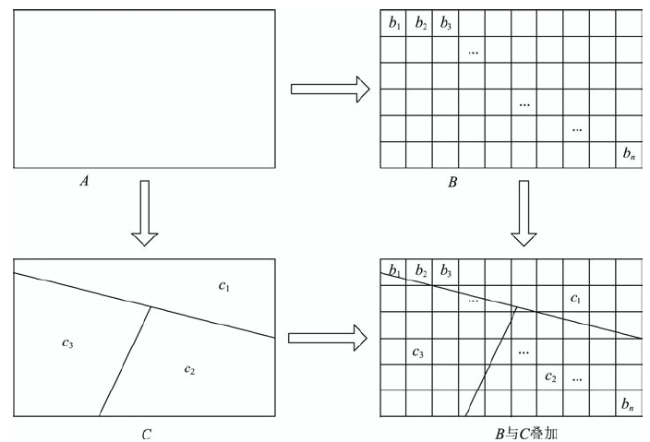
Fig. 2 Overlay of bacillary dysentery morbidity stratum and influencing factors stratum图2 细菌性痢疾发病率层与影响因素层的叠加 |
Fig. 3 The distribution of the cases of bacillary dysentery in Beijing-Tianjin-Tangshan in 2012图3 2012年京津唐地区各月细菌性痢疾的病例数分布 |
Fig. 4 The morbidity of bacillary dysentery ofdifferent professions图4 不同职业细菌性痢疾的发病率 |
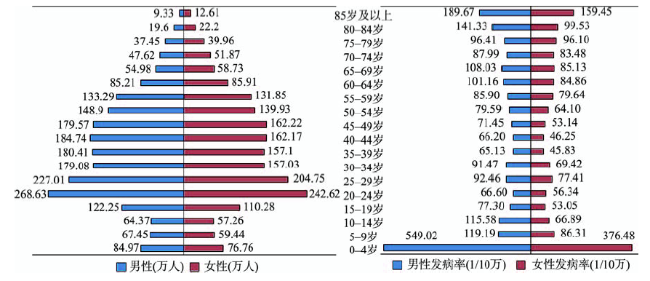
Fig. 5 The distribution of population and bacillary dysentery morbidity of male and female, respectively, at each age group图5 各年龄组男性和女性的人口数和细菌性痢疾发病率在各年龄组的分布 注:各年龄段男(女)性的细菌性痢疾发病率=该年龄段男(女)细菌性痢疾发病数/该年龄段男(女)的人口数 |
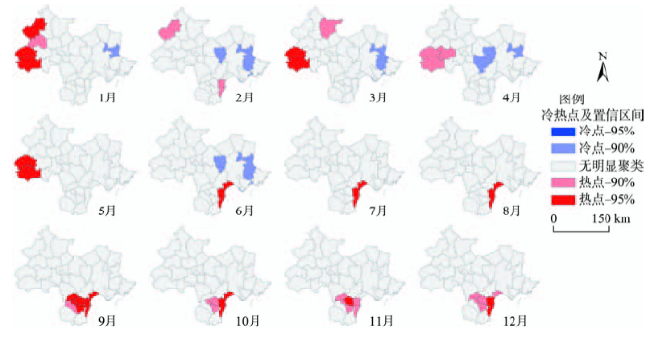
Fig. 6 The monthly hotspot analysis of bacillary dysentery morbidity in Beijing-Tianjing-Tanshan图6 京津唐地区细菌性痢疾发病率的热点分析 注:90%、95%分别代表置信度为90%、95%的统计显著性 |
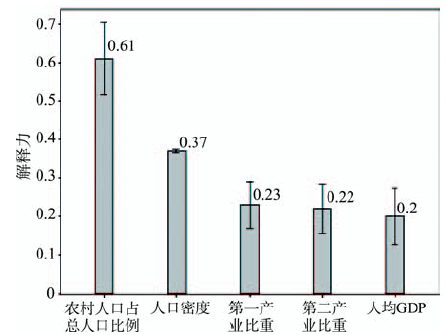
Fig. 7 The power of determinant of risk factors to the incidence of bacillary dysentery图7 各影响因子对细菌性痢疾发病的解释力 |
Tab. 1 Statistical significance difference of the q value between different risk factors表1 不同影响因素的q值之间的统计显著性差异 |
| 人口密度 | 第一产业比重 | 第二产业比重 | 农村人口占总人口的比例 | 各区县的人均GDP | |
|---|---|---|---|---|---|
| 第一产业比重 | N | ||||
| 第二产业比重 | N | N | |||
| 农村人口占总人口的比例 | Y | Y | Y | ||
| 各区县人均GDP | Y | Y | N | Y |
注:Y表示2个影响因素的解释力之间存在显著性差异(置信度为95%);N表示没有显著性差异 |
Tab. 2 The results of interaction detector表2 交互作用探测器结果 |
| 人口 密度 | 第一产 业比重 | 第二产 业比重 | 农村人口占总人口的比例 | 各区县的 人均GDP | |
|---|---|---|---|---|---|
| 人口密度 | 0.37 | ||||
| 第一产业比重 | 0.79 | 0.23 | |||
| 第二产业比重 | 0.68 | 0.52 | 0.22 | ||
| 农村人口占总 人口的比例 | 0.87 | 0.85 | 0.87 | 0.61 | |
| 各区县的 人均GDP | 0.59 | 0.83 | 0.56 | 0.84 | 0.20 |
The authors have declared that no competing interests exist.
| [1] |
|
| [2] |
|
| [3] |
|
| [4] |
|
| [5] |
|
| [6] |
|
| [7] |
[
|
| [8] |
[
|
| [9] |
[
|
| [10] |
[
|
| [11] |
[
|
| [12] |
|
| [13] |
|
| [14] |
|
| [15] |
|
| [16] |
[
|
| [17] |
|
| [18] |
[
|
| [19] |
|
| [20] |
[
|
| [21] |
|
| [22] |
[
|
| [23] |
[
|
| [24] |
|
| [25] |
|
| [26] |
|
| [27] |
|
| [28] |
|
| [29] |
|
| [30] |
|
| [31] |
|
| [32] |
[
|
| [33] |
[
|
/
| 〈 |
|
〉 |