
基于植被状态指数的云南省农业干旱状况时空分析
作者简介:吕潇然(1993-),女,硕士生,研究方向为土壤水分反演与旱灾。E-mail:201421480013@mail.bnu.edu.cn
收稿日期: 2016-02-29
要求修回日期: 2016-06-29
网络出版日期: 2016-12-20
基金资助
国土资源部公益性行业科研专项项目(201411003)
中央高校基本科研业务费专项项目
Temporal and Spatial Analysis of Agricultural Drought in Yunnan Provincebased on Vegetation Condition Index
Received date: 2016-02-29
Request revised date: 2016-06-29
Online published: 2016-12-20
Copyright
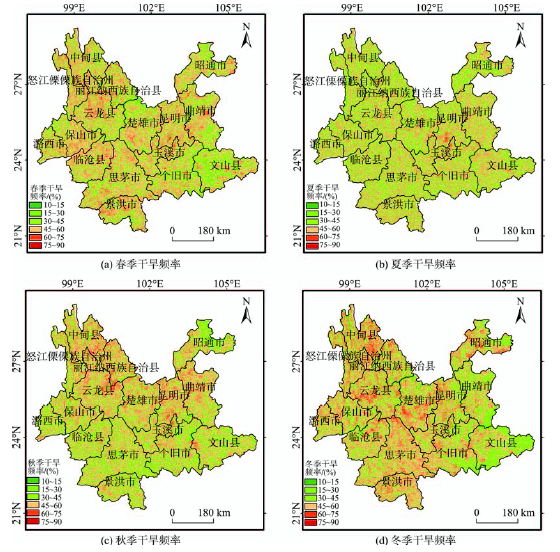
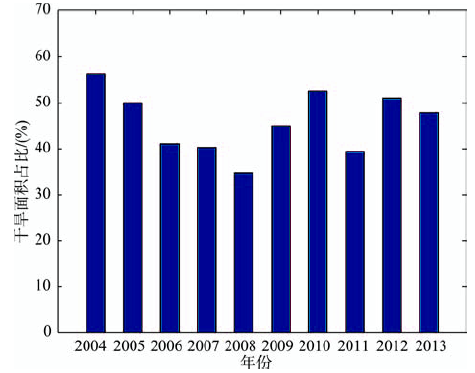
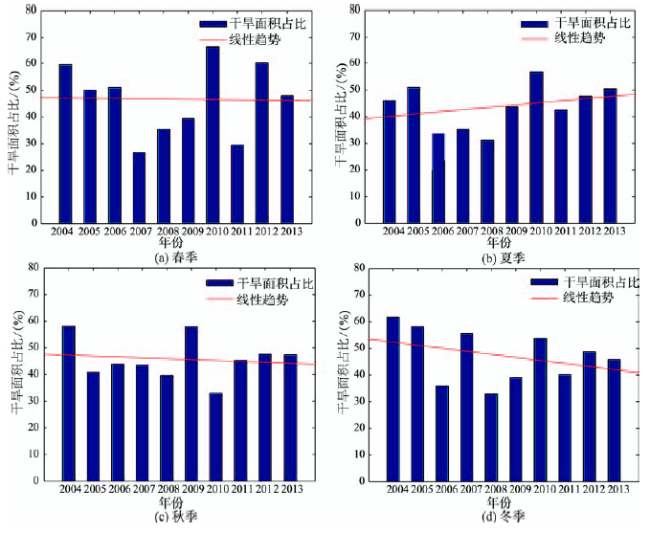
本文首先计算了云南省2004-2013年农业干旱指数VCI,然后使用Pearson相关系数评价降水与VCI的相关性,基于VCI识别云南省2004-2013年农业干旱事件,最后,与SPEI气象干旱识别结果进行对比分析,在VCI农业干旱识别的基础上,使用干旱频率和干旱面积占比指标分析了云南省2004-2013年农业干旱时空特征。结果表明:降水只是影响VCI指数的关键因素之一;VCI和SPEI指数均能够较好对干旱进行监测并识别典型干旱,但两者的识别结果存在差异;云南省农业干旱频率在春冬两季较高,夏季较低,秋季介于夏季和春冬季之间;春夏冬三季农业干旱频率空间分布较为均匀,秋季农业干旱频率呈南低北高的分布态势,整体上北部干旱频率高于南部;2004-2013年云南省整体干旱面积占比呈现先减小后增加再波动的趋势,春冬两季整体干旱面积占比最高,分别为46.63%和47.18%,呈现下降趋势,夏季整体干旱面积占比最低,为43.81%,呈现上升趋势,秋季整体干旱面积占比介于冬春季和夏季之间,为45.74%,呈现下降趋势。总之,云南省农业干旱春冬易发性最高,影响范围最大,夏季易发性最低,影响范围最小。
关键词: 植被状态指数(VCI); 农业干旱; 云南省; 时空特征; MODIS
吕潇然 , 尹晓天 , 宫阿都 , 王前锋 , 李静 , 张慧 . 基于植被状态指数的云南省农业干旱状况时空分析[J]. 地球信息科学学报, 2016 , 18(12) : 1634 -1644 . DOI: 10.3724/SP.J.1047.2016.01634
Considering the normalization characteristic of drought in Yunnan Province during recent years, it’s very significant to study the drought in Yunnan province. Nowadays, major studies focus on the meteorological drought in Yunnan Province and the studies focus on agricultural drought in Yunnan Province are few. But the data used in the study methods of meteorological drought can’t represent vegetation growth state. Also they cannot be used to evaluate the effect of drought on vegetation or analyze temporal and spatial distribution of agricultural drought in Yunnan Province. Because of these disadvantages, this paper calculated the vegetation condition index(VCI) of Yunnan Province during 2004-2013, identified agriculture drought events and analyzed temporal and spatial distribution of agricultural drought. Before the temporal and spatial distribution was analyzed, agricultural drought events identified by VCI were compared with meteorological drought events identified by the standardized precipitation evapotranspiration index (SPEI) and the Pearson correlation coefficient was calculated between VCI and precipitation to evaluate the capability of VCI index.We found the similarities and differences between these two types of drought events and analyzed the possible reasons. The results revealed that there were differences between drought events identified by these two indices because drought events identified by SPEI index are based on meteorological elements such as precipitation and temperature while drought events identified by VCI index are based on vegetation growth state which is not only affected by meteorological elements. The low Pearson correction coefficient also demonstrates precipitation is just one of the key factors which affect vegetation growth state. Though there are differences between these two types of drought events, VCI and SPEI can both monitor drought and identify classical drought events well. Based on this conclusion, temporal and spatial distribution characteristics of agricultural drought in Yunnan Province were analyzed using drought frequency index and drought-area-ration index. The results showed that: drought frequency of spring and winter is higher than that of autumn and the drought frequency of summer is the lowest. The spatial distribution of drought frequency during spring, summer and winter is relatively uniform while the drought frequency of northern Yunnan during autumn is higher than that of southern Yunnan. Overall, the drought frequency of northern Yunnan is higher than southern Yunnan and drought-area-ratio of Yunnan during 2004-2013 shows a decreasing-increasing and fluctuating trend. Drought-area-ratio index of spring and winter is the highest whose values are 46.63% and 47.18%, respectively. Both of them show a decreasing trend. Drought-area-ratio index of summer is the lowest whose value is 43.81% and shows an increasing trend. The value of drought-area-ratio index of autumn is between spring and summer and has a decreasing tendency. Based on these results, agricultural drought of spring and winter is most prone to happen and the extent is the maximum while the agricultural drought of summer is least prone to happen and the extent is the minimum. Since vegetation growth state is not only affected by drought but also can be affected by plant diseases and insect pests, irrigation, frozen injury and improper fertilization, this study monitoring agricultural drought based on VCI index has some limitations. Future work should focus on the physical mechanism of agricultural drought and the biophysical response of vegetation to drought in order to monitor and forecast agricultural drought more accurately.
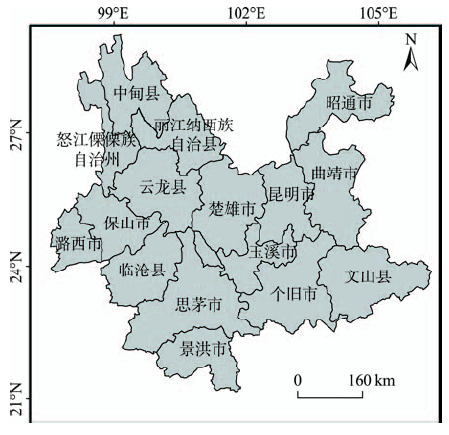
Fig. 1 Map of Study area图1 研究区(云南省)概况图 |
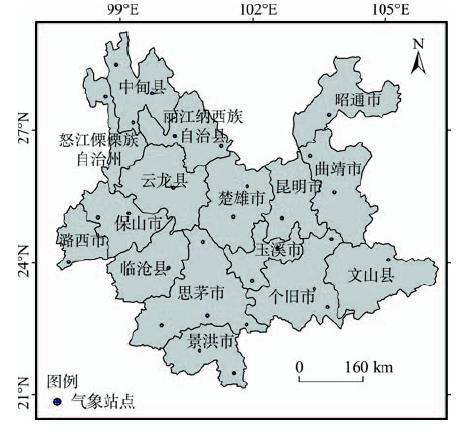
Fig. 2 Distribution of meteorologicalstations in Yunnan Province图2 云南省气象站点分布 |
Tab. 1 Discrimination standard of agriculture drought表1 农业干旱判别标准 |
| VCI指数 | 干旱状态 |
|---|---|
| ≤0.35 | 干旱 |
| >0.35 | 非干旱 |
Tab. 2 Discrimination standard of meteorological drought表2 气象干旱判别标准 |
| SPEI指数 | 干旱状态 |
|---|---|
| ≤-0.5 | 干旱 |
| >-0.5 | 非干旱 |
Tab. 3 Pearson correlation analysis of VCI and precipitation of meteorological stations in Yunnan Province表3 云南省气象站点VCI与降水Pearson相关分析 |
| 站点名称 | VCI与当月 降水相关 系数 | VCI与前2个月累积降水 相关系数 | VCI与前3个月累积降水 相关系数 | VCI与前4个月累积降水 相关系数 |
|---|---|---|---|---|
| 德钦 | 0.0110 | 0.0390 | 0.0195 | 0.0433 |
| 贡山 | -0.0890 | -0.0838 | -0.0645 | -0.0373 |
| 中甸 | -0.0600 | -0.0794 | -0.0579 | -0.0679 |
| 维西 | -0.0230 | -0.0162 | -0.0741 | -0.0841 |
| 昭通 | 0.0856 | 0.0594 | -0.0126 | -0.0653 |
| 丽江 | 0.1067 | 0.1542 | 0.1798 | 0.1942* |
| 华坪 | 0.0425 | 0.0075 | -0.0397 | -0.0635 |
| 会泽 | 0.1517 | 0.1738 | 0.1680 | 0.1566 |
| 腾冲 | -0.0844 | -0.0453 | -0.0311 | -0.0430 |
| 保山 | 0.1214 | 0.1548 | 0.1889* | 0.1894* |
| 大理 | 0.0415 | 0.0400 | 0.0706 | 0.0709 |
| 元谋 | 0.0778 | 0.1768 | 0.1382 | 0.0815 |
| 楚雄 | -0.0207 | 0.0044 | 0.0308 | 0.0596 |
| 昆明 | 0.0999 | 0.0638 | -0.0076 | -0.0833 |
| 沾益 | 0.1050 | 0.2498** | 0.2240* | 0.2235* |
| 瑞丽 | 0.1300 | 0.1608 | 0.1879* | 0.2012* |
| 景东 | 0.0100 | -0.0373 | -0.0425 | -0.0396 |
| 玉溪 | 0.0350 | 0.0984 | 0.1059 | 0.0957 |
| 泸西 | -0.0126 | -0.0379 | 0.0026 | 0.0458 |
| 临沧 | -0.0228 | 0.0022 | -0.0153 | -0.0469 |
| 澜沧 | -0.0863 | -0.0372 | 0.0567 | 0.0907 |
| 景洪 | 0.1079 | 0.0635 | 0.0259 | 0.0081 |
| 思茅 | -0.0536 | -0.1290 | -0.1518 | -0.1239 |
| 元江 | 0.0775 | 0.0967 | -0.0081 | 0.0294 |
| 勐腊 | 0.0369 | 0.0861 | 0.0983 | 0.0964 |
| 江城 | 0.0871 | 0.0911 | 0.1078 | 0.1145 |
| 蒙自 | -0.0367 | -0.0459 | -0.0467 | -0.0016 |
| 屏边 | -0.1179 | -0.1282 | -0.0768 | -0.0626 |
| 广南 | -0.1081 | -0.0648 | -0.0138 | 0.0134 |
注:**表示双尾检验显著性水平为0.01;*表示双尾检验显著性水平为0.05 |
Tab. 4 Correlation coefficients betweenVCI and SPIE_3、SPEI_6表4 VCI与SPEI_3、SPEI_6相关系数 |
| SPEI指数 | 相关系数 |
|---|---|
| SPEI_3 | 0.1699 |
| SPEI_6 | 0.1457 |
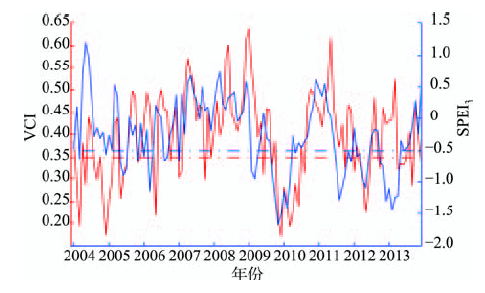
Fig. 3 Time series of VCI and SPEI_3 from2004 to 2013 in Yunnan province图3 2004-2013年云南省VCI和SPEI_3时间序列图 |
Tab. 5 Statistics of agriculture drought events and meteorological drought events during 2004-2013表5 2004-2013年农业干旱事件与气象干旱事件统计表 |
| 共同识别的干旱 | VCI识别 SPEI_3未识别 | SPEI_3识别 VCI未识别 |
|---|---|---|
| 2004年3月 | 2004年2月 | 2006年1月 |
| 2004年12月 | 2004年5月 | 2009年2-4月 |
| 2005年5-7月 | 2004年8-9月 | 2011年7-9月 |
| 2005年11月 | 2004年11月 | 2011年11-12月 |
| 2006年3-5月 | 2005年1-2月 | 2012年11-12月 |
| 2006年8-10月 | 2007年10月 | 2013年1-3月 |
| 2007年1-2月 | 2009年6月 | |
| 2009年9-12月 | 2010年8月 | |
| 2010年1-5月 | 2013年9月 | |
| 2011年10月 | 2013年12月 | |
| 2012年1-6月 | ||
| 2012年10月 | ||
| 2013年4-7月 | ||
| 共计35个月 | 共计12个月 | 共计14个月 |
Fig. 4 Maps of drought frequency of each season during 2004-2013 in Yunnan Province图4 云南省2004-2013年不同季节干旱频率图 |
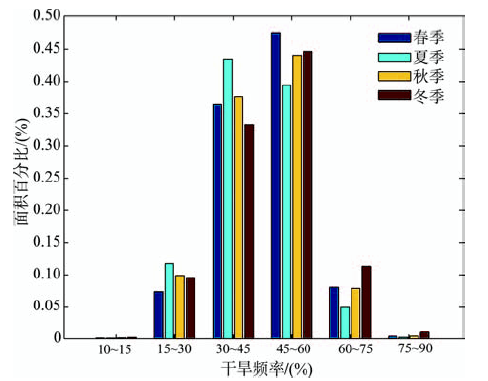
Fig. 5 Area percentage of different droughtfrequency in Yunnan Province图5 云南省干旱频率面积百分比 |
Tab. 6 Area percentage of different droughtfrequency in Yunnan province表6 云南省干旱频率面积百分比 |
| 区间 | 春季/(%) | 夏季/(%) | 秋季/(%) | 冬季/(%) |
|---|---|---|---|---|
| 10%~15% | 0.108 | 0.097 | 0.141 | 0.192 |
| 15%~30% | 7.420 | 11.758 | 9.900 | 9.531 |
| 30%~45% | 36.493 | 43.478 | 37.618 | 33.305 |
| 45%~60% | 47.523 | 39.465 | 44.052 | 44.656 |
| 60%~75% | 8.092 | 4.997 | 7.906 | 11.340 |
| 75%~90% | 0.364 | 0.205 | 0.382 | 0.976 |
Fig. 6 Interannual variation of drought-area-ratioin Yunnan province图6 云南省干旱面积占比年际变化图 |
Fig. 7 Time series of drought-area-ratio in Yunnan province by seasons图7 云南省不同季节干旱面积占比时间序列 |
Tab. 7 Average drought-area-ratio in Yunnan Province by seasons during 2004-2013表7 云南省2004-2013年不同季节平均干旱面积占比 |
| 季节 | 干旱面积占比/(%) |
|---|---|
| 春季 | 46.63 |
| 夏季 | 43.81 |
| 秋季 | 45.74 |
| 冬季 | 47.18 |
The authors have declared that no competing interests exist.
| [1] |
[
|
| [2] |
|
| [3] |
[
|
| [4] |
[
|
| [5] |
|
| [6] |
|
| [7] |
|
| [8] |
|
| [9] |
|
| [10] |
[
|
| [11] |
[
|
| [12] |
[
|
| [13] |
[
|
| [14] |
[
|
| [15] |
[
|
| [16] |
|
| [17] |
|
| [18] |
|
| [19] |
[
|
| [20] |
[
|
| [21] |
[
|
| [22] |
|
| [23] |
|
| [24] |
|
| [25] |
|
| [26] |
[
|
| [27] |
|
| [28] |
|
| [29] |
|
| [30] |
|
| [31] |
[
|
| [32] |
[
|
| [33] |
[
|
| [34] |
[
|
| [35] |
[
|
/
| 〈 |
|
〉 |