
城市地表要素的地表能量响应特征及其关系研究
作者简介:王 蕾(1989-),女,河北人,硕士生,研究方向为城市地表要素类型变化对环境的影响。 E-mail:wangleilei0719@163.com
收稿日期: 2016-03-25
要求修回日期: 2016-05-05
网络出版日期: 2016-12-20
Urban Surface Energy’s Responses to Land Surface ElementTypes and Interactive Relationship
Received date: 2016-03-25
Request revised date: 2016-05-05
Online published: 2016-12-20
Copyright
遥感地表能量信息可揭示城市地表要素的地表能量综合响应特征和作用关系特征,客观地反映了城市实体空间、开敞空间及其开放空间网络的格局和变化。本文从重庆城市地表能量响应的基本网格单元和研究区尺度,分析城市地表要素对城市热环境的贡献,并结合与“国际宜居城市”——西雅图的对比,探讨城市化过程中地表要素类型改变对城市热环境的影响及其变化和规律。结果表明:① 在基本网格单元和区域尺度层面,城市地表能量的平衡取决于地表要素中实体空间和开敞空间布局的合理性与稳定性;② 在城市大规模的硬质化区域,建筑实体的垂直体量相对于其水平体量及其组团格局,对于地表能量的聚集、改变具有较高的敏感性;③ 地表要素对城市热环境的影响若达到同等贡献指数(绝对值)程度,基本网格单元的开敞空间比例需要高于实体空间;④ 开敞空间基本网格单元的林地和水体类型所占比例达到20%时,地表能量的减幅明显;⑤ 实体空间基本网格单元的在建/工业用地要素类型所占比例超过5%,以及高密度建设用地所占比例达到30%时,地表能量的增幅明显。本研究旨在从城市地物实体地表能量的体量与空间关系角度,为建设基于城市更新的城市规划和城市设计提供科学依据。
王蕾 , 关燕宁 , 郭杉 , 姚武韬 , 蔡丹路 , 张春燕 , 肖寒 . 城市地表要素的地表能量响应特征及其关系研究[J]. 地球信息科学学报, 2016 , 18(12) : 1684 -1697 . DOI: 10.3724/SP.J.1047.2016.01684
Remote sensing based urban surface energy information sufficiently reveals the interactive relationship between urban surface energy and land surface element types, which objectively reflect the structures and variations of the high surface energy areas, the open urban fields and the open urban space networks. To attribute the changing urban thermal environment to different combinations of land surface element types, the study area is divided into 154 grids. Seattle of USA, one of the international livable cities, is included as a reference city to further investigate how urban surface energy responses to different processes of urbanization. The following results are noted: (1) planning/designing the high surface energy areas and open urban fields with a better arrangement of land surface element types could benefit the balance of urban surface energy at both the grid scale and the regional scale; (2) for the massively expanded urban hard landscape, the vertical volume of the construction entities is more sensitive to the urban surface energy concentration and change, with respect to their horizontal distribution and group combination; (3) the percentage of open fields in grids will be higher than the high surface energy areas, when the impact of different surface element types on urban thermal environment shows an equality with the same absolute contribution index; (4) an significant decrease in urban surface energy will be found when forest and water occupies more than 20% of the grids; (5) contrarily, a remarkable increase in urban surface energy will appear when the under construction/industrial surface element types accounted for more than 5% of the grids, or when the proportion of high density construction land has reached up to 30% of the grids. In general, this study considers the spatial relationship between urban surface energy and land surface element types and thus to provide scientific references for urban planning and design.
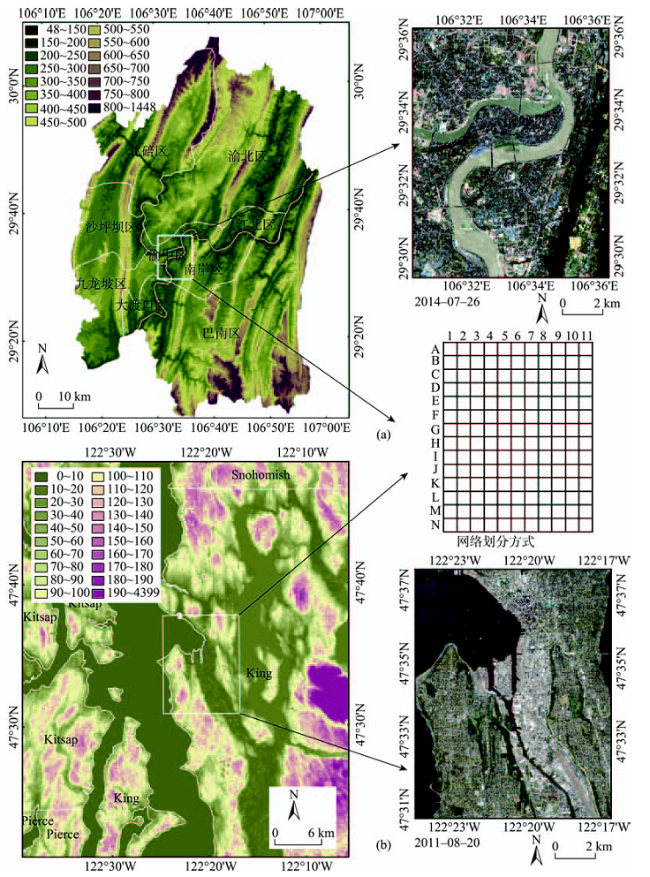
Fig. 1 The geographical distribution of the study area, the gradation of DEM and the grid division图1 研究区位置、网格划分和数字高程模型 |
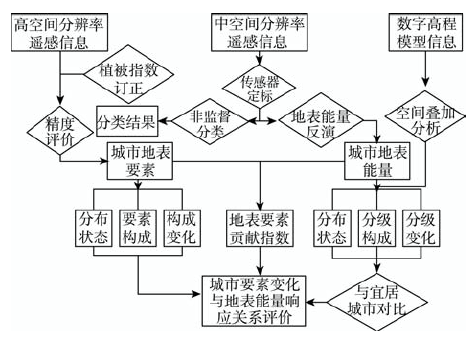
Fig. 2 Framework showing the responses of urban surface energy to land surface element types图2 研究方案技术实施流程 |
Tab. 1 The description of the surface element types表1 地表要素类型指标 |
| 城市要素类型 | 类型内容描述 |
|---|---|
| 建设用地A | 植被覆盖率较低,高建筑密度区 |
| 建设用地B | 规模植被分布,低建筑密度区 |
| 在建/工业用地 | 正在建设过程中,工业等聚集区 |
| 林地 | 规模乔木、灌木和其他林 |
| 城市绿地/耕地 | 规模绿化、草坪和耕地 |
| 水体 | 主要河流、湖泊、水库、坑塘 |
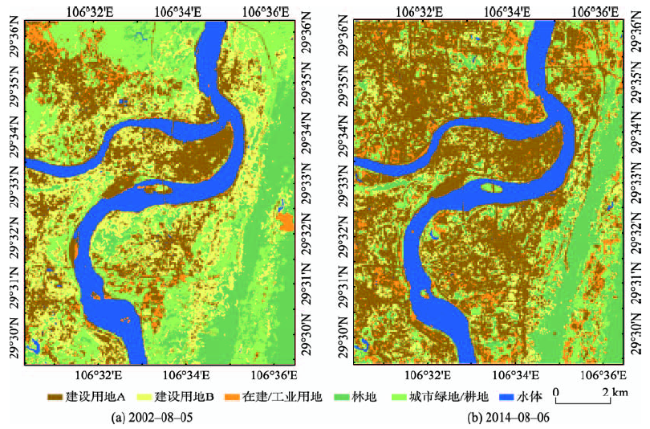
Fig. 3 The geographical distribution of surface element types in the study area图3 重庆研究区地表要素类型分布 |
Tab. 2 The proportional distribution and percentage change of surface element types from 2002 to 2014表2 重庆研究区2002-2014年地表要素类型分布和变化 |
| 百分比/(%) | ||||||
|---|---|---|---|---|---|---|
| 建设用地A | 建设用地B | 在建/工业用地 | 林地 | 城市绿地/农田 | 水体 | |
| 2002年 | 23.90 | 18.99 | 4.18 | 14.60 | 25.33 | 12.99 |
| 2014年 | 38.19 | 12.40 | 9.34 | 13.52 | 13.99 | 12.50 |
| 变化 | 14.30 | 6.60 | 5.10 | 1.10 | 11.30 | 0.50 |
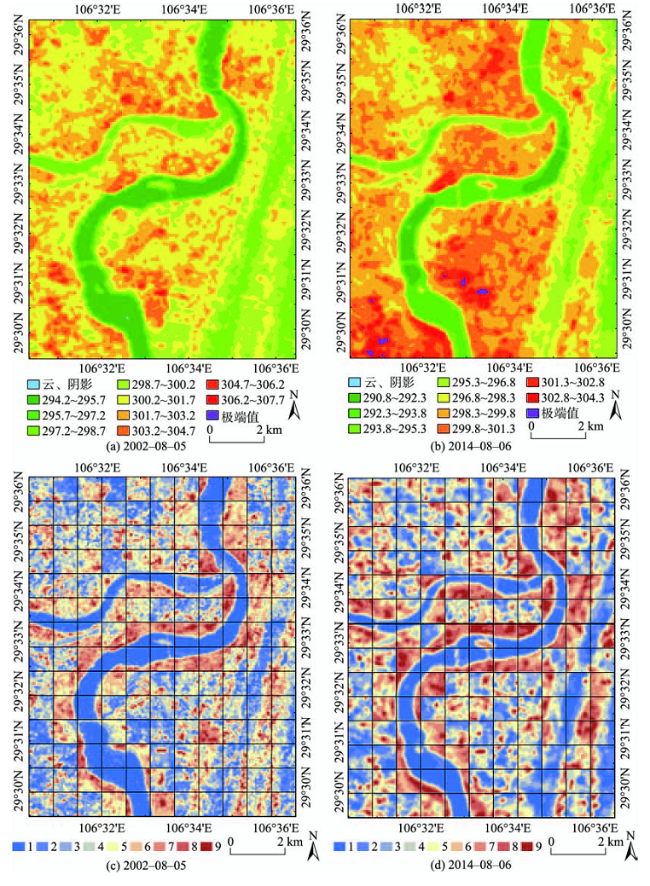
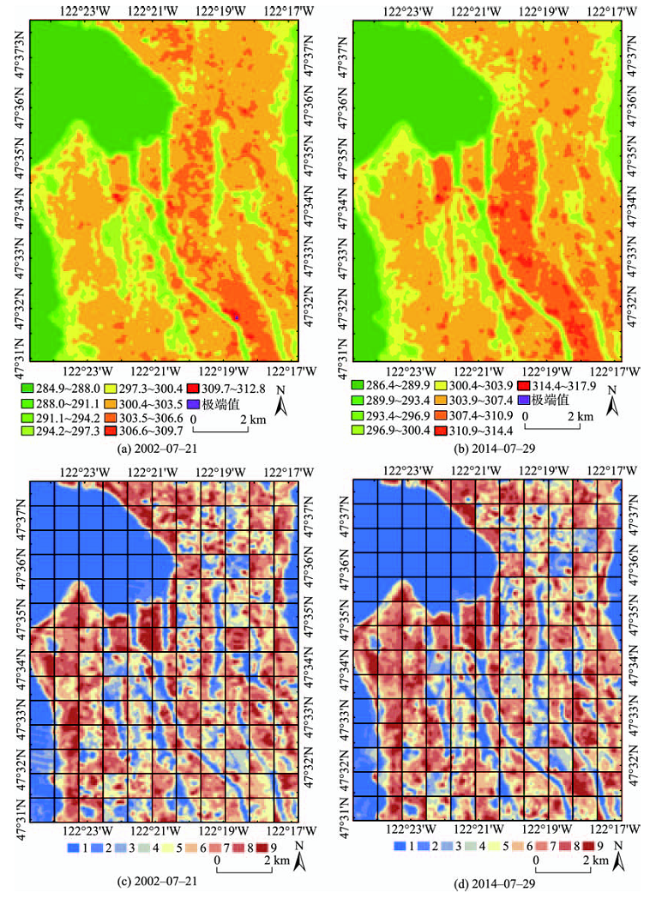
Fig. 4 The geographical distribution of relative surface energy in the study area and under the grids of Chongqing图4 重庆研究区和基本网格相对地表能量分布对比 注:a.b.基于研究区亮度温度;c.d.基于网格亮度温度 |
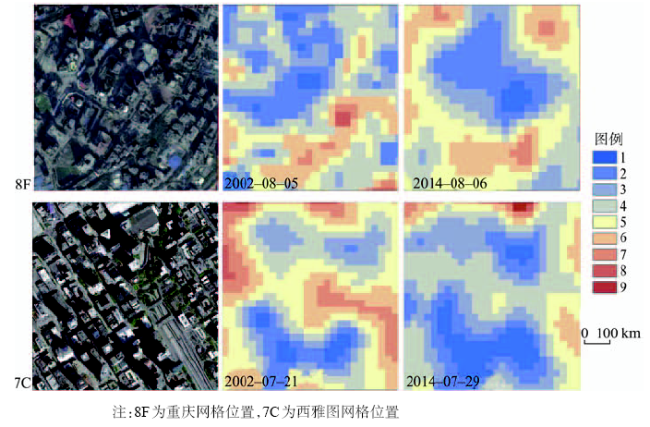
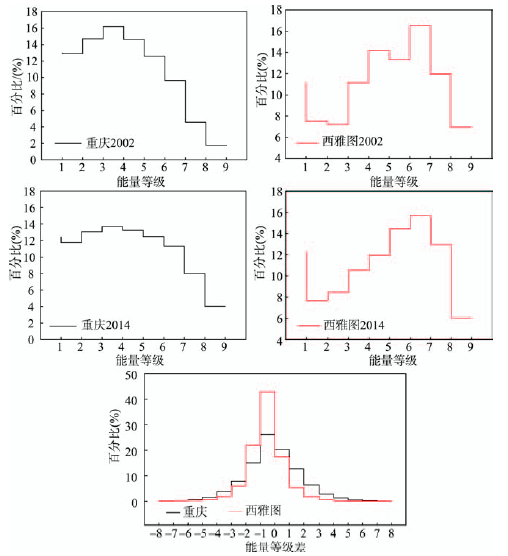
Fig. 5 Typical girds图5 重庆与西雅图典型网格 |
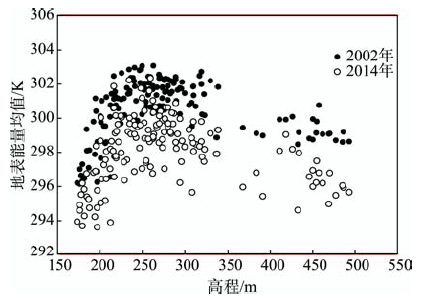
Fig. 6 Vertical geographical distribution ofland surface energy图6 高程与地表能量均值分布关系 |
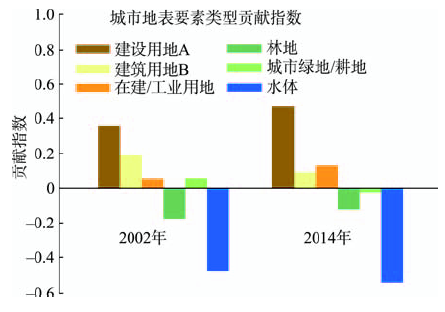
Fig. 7 The contribution index of surface elements图7 地表要素贡献指数变化对比 |
Tab. 3 Standard deviation and mean value of the contribution index in 2014表3 2014年地表要素类型贡献指数的标准差与均值 |
| 建设用地A | 建设用地B | 在建/工业用地 | 林地 | 城市绿地/耕地 | 水体 | |
|---|---|---|---|---|---|---|
| 贡献指数标准差 | 0.28 | 0.09 | 0.09 | 0.14 | 0.11 | 0.51 |
| 贡献指数均值 | 0.23 | 0.02 | 0.08 | -0.10 | 0.04 | -0.58 |
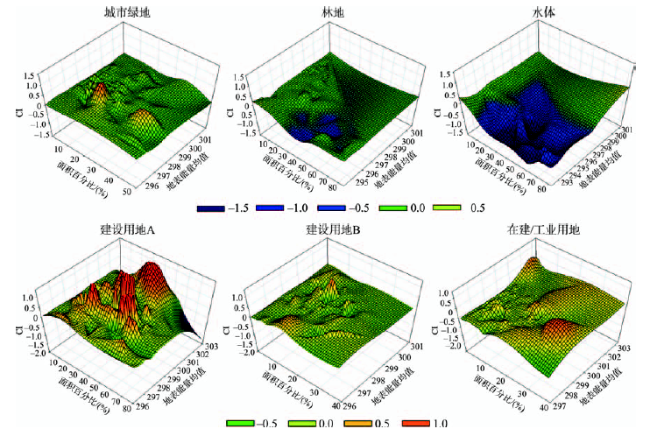
Fig. 8 The distribution of surface energy, area proportion and contribution index of surface element types at the scale of grid图8 网格尺度地表要素能量均值、面积比例与贡献指数的空间分布 |
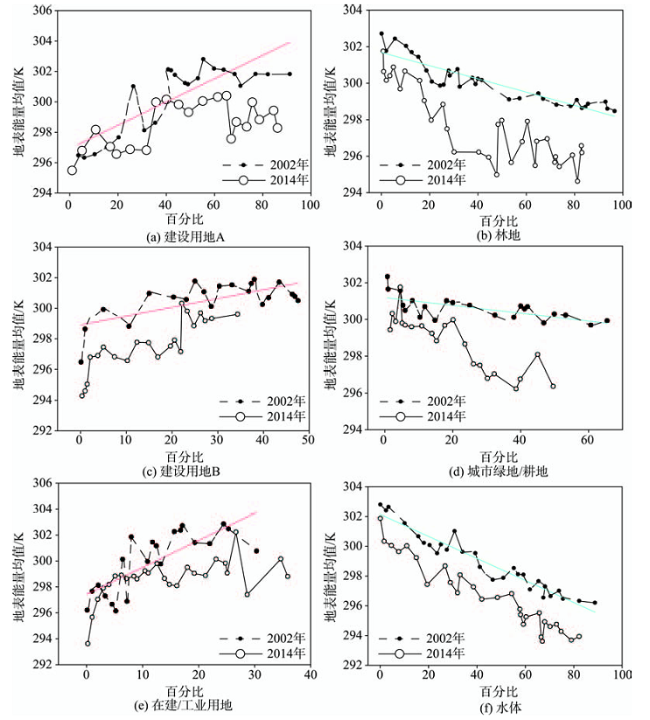
Fig. 9 Relationship between the proportion of surface element type and the mean value of surface energy图9 地表要素类型比例与网格地表能量均值分布 |
Fig. 10 Geographical distribution of relative surface energy in the study area and under grids of Seattle图10 西雅图研究区和基本网格相对地表能量分布对比 |
Fig. 12 The distribution of pixel relative energy level and its change in grid图12 基于网格的相对地表能量差值变化对比 |
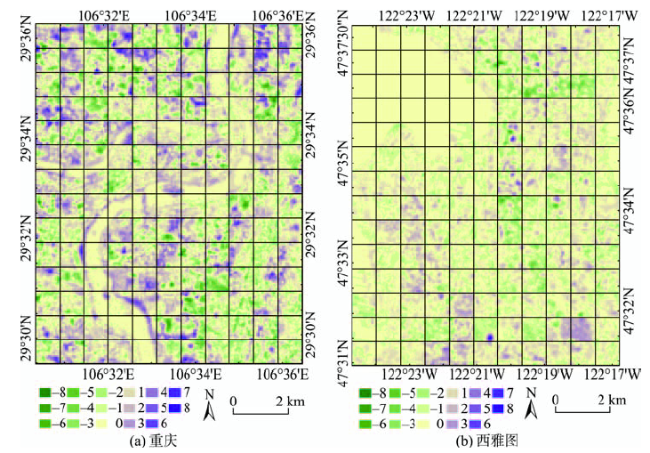
Fig. 11 Geographical distribution of relative energy level change based on the grids of 2002-2014图11 2002-2014年重庆、西雅图基于网格的相对地表能量差值分布 |
The authors have declared that no competing interests exist.
| [1] |
[
|
| [2] |
[
|
| [3] |
[
|
| [4] |
|
| [5] |
|
| [6] |
[
|
| [7] |
[
|
| [8] |
[
|
| [9] |
[
|
| [10] |
[
|
| [11] |
|
| [12] |
[
|
| [13] |
[
|
| [14] |
[
|
| [15] |
[
|
| [16] |
[
|
| [17] |
[
|
| [18] |
|
| [19] |
[
|
| [20] |
[
|
| [21] |
[
|
| [22] |
中国科学院西南资源开发考察队.重庆地貌与经济建设[M].北京:中国科学技术出版社,1992.
[ Investigation Team of Chinese Academy of Sciences of Resource Exploiting in Southwest China. Chongqing landforms and economic construction[M]. Beijing: China Science and Technology Publishing House, 1992. ]
|
| [23] |
[
|
| [24] |
[
|
| [25] |
|
/
| 〈 |
|
〉 |