
基于Landsat-8 TIRS的大气参数快速估算方法
作者简介:高文升(1989-),男,山东潍坊人,硕士生,主要从事热红外地表温度反演。E-mail: gaowensheng501@163.com
收稿日期: 2016-04-05
要求修回日期: 2016-06-14
网络出版日期: 2017-01-13
基金资助
国家自然科学基金面上项目(41471297、41571352)
国家自然科学基金重点项目(41231170)
A Fast Estimation Method of Atmospheric Parameters for Landsat-8 TIRS Data
Received date: 2016-04-05
Request revised date: 2016-06-14
Online published: 2017-01-13
Copyright
Landsat-8卫星设计有2个热红外波段,但由于第11波段存在定标问题,无法用于定量研究,所以基于Landsat-8的地表温度反演算法目前仍以单通道为主。单通道算法反演地表温度需先已知地表比辐射率并完成大气校正的工作。在大气校正方面,现有的算法主要以传统方法为主,即通过大气辐射传输模型或经验-半经验公式的方式获取大气参数。但是,传统的经验-半经验的方法并不建立在物理机制上,其自身存在一定局限性;而大气辐射传输模型的方法虽然精度更高,但执行效率较低,不适用于业务化的产品生产。本文针对现有大气估算方法的不足,提出了一种基于Landsat-8单通道地表温度反演的大气参数快速估算方法。在水汽范围0~6 g/cm2内,大气参数快速估算方法的精度与MODTRAN精度相当,大气透过率RMSE为0.003;大气上行辐亮度RMSE为0.0004;大气下行辐亮度RMSE为0.0004。相较于传统的大气参数估算方法,本文提出的大气参数快速估算方法,不仅可以脱离大气辐射传输模型使用,而且具有与其相当的估算精度,执行效率更高,适用性更广。
关键词: 大气参数; 热红外遥感; 地表温度反演; Landsat-8 TIRS
高文升 , 张雨泽 , 房世峰 , 杨锋杰 , 吴骅 . 基于Landsat-8 TIRS的大气参数快速估算方法[J]. 地球信息科学学报, 2017 , 19(1) : 110 -116 . DOI: 10.3724/SP.J.1047.2017.00110
Landsat-8 satellite was designed to have two thermal infrared bands, TIRS band 10 and band 11. But USGS (United States Geological Survey) pointed out that some calibration errors would be found with the band 11. It is recommended to use only the TIRS band 10 in quantitative research rather than using two channels. When using a single channel algorithm in retrieving land surface temperature (LST), we must priorly have the surface emissivity and have the atmospheric correction processed. The traditional methods used in the atmospheric correction depend on the empirical relationships or atmospheric radiative transfer model. However, both of the two methods have deficiencies, for example, as the empirical method depends highly on the training data, it is incapable under certain conditions. On the other hand, the method that based on the atmospheric radiative transfer model has to run the designated codes each time, which is not an appropriate choice for producing LST. In this paper, we propose a new atmospheric correction model applied to the single channel method with Landsat-8 TIRS band 10 data. The results show that the RMSE (Root Mean Squared Error) of the total transmission is 0.003, the RMSE of the upwelling radiance is 0.0004 and the RMSE of the downwelling radiance is 0.0004. Compare with the traditional methods, the proposed model bases on the physical mechanism of atmospheric radiative transfer model and has a higher accuracy. Moreover, the proposed model could also be used without the help of any atmospheric radiative transfer model. That is, this model will have a better prospect of application.
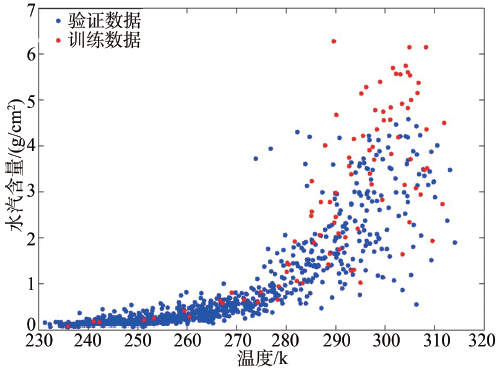
Fig. 1 Temperature and water vapor information of the validation data and training data图1 验证数据与训练数据温度、水汽信息 |
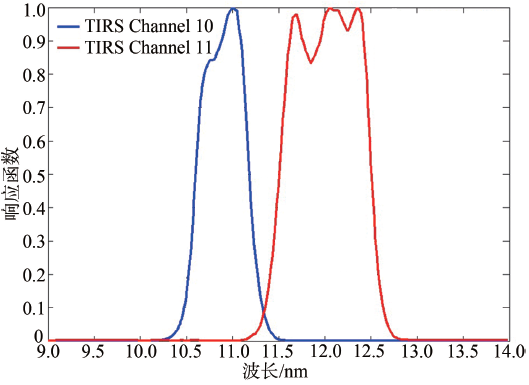
Fig. 2 Channel response function of Landsat-8 TIRS图2 Landsat-8 TIRS通道响应函数 |
Tab. 1 Spectral ranges and pixel sizes of TIRS bands表1 TIRS通道参数 |
| 波段名称 | 中心波长 /μm | 最小波段 边界/μm | 最大波段 边界/μm | 空间 分辨率/m |
|---|---|---|---|---|
| Band 10 TIRS 1 | 10.9 | 10.6 | 11.2 | 100 |
| Band 11 TIRS 2 | 12.0 | 11.5 | 12.5 | 100 |
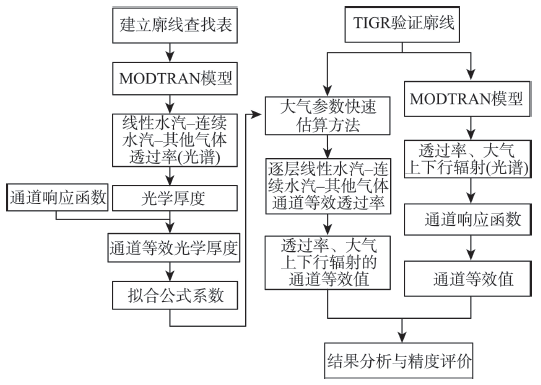
Fig. 3 The establishment and verificationprocess of the proposed algorithm图3 算法的建立与验证流程 |
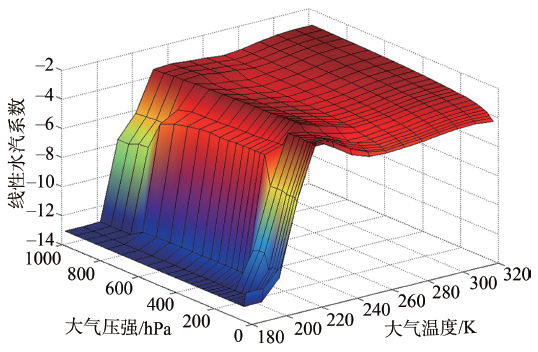
Fig. 4 H2O absorption coefficient图4 线性水汽系数 |
Tab. 2 Atmospheric layer configuration表2 大气廓线层数配置 |
| 压强/hPa | 温度/K | 层底高度/km | 相对湿度范围/% | |||
|---|---|---|---|---|---|---|
| 层底压强 | 层顶压强 | 范围 | 步长 | |||
| 37.04 | 24.79 | 180~320 | 10 | 24.46 | 0,10, 30, 50, 70, 90 | |
| 45.73 | 37.04 | 180~320 | 10 | 22.83 | ||
| 56.46 | 45.73 | 180~320 | 10 | 21.20 | ||
| 69.71 | 56.46 | 180~320 | 10 | 19.59 | ||
| 86.07 | 69.71 | 180~320 | 10 | 18.01 | ||
| 106.27 | 86.07 | 180~320 | 10 | 16.47 | ||
| 131.20 | 106.27 | 180~320 | 10 | 14.98 | ||
| 161.99 | 131.20 | 180~320 | 10 | 13.48 | ||
| 200.00 | 161.99 | 180~320 | 10 | 11.98 | ||
| 222.65 | 200.00 | 180~320 | 10 | 11.22 | ||
| 247.87 | 222.65 | 180~320 | 10 | 10.46 | ||
| 275.95 | 247.87 | 180~320 | 10 | 9.71 | ||
| 307.20 | 275.95 | 180~320 | 10 | 8.97 | ||
| 341.99 | 307.20 | 180~320 | 10 | 8.22 | ||
| 380.73 | 341.99 | 180~320 | 10 | 7.47 | ||
| 423.85 | 380.73 | 180~320 | 10 | 6.71 | ||
| 471.86 | 423.85 | 180~320 | 10 | 5.94 | ||
| 525.00 | 471.86 | 180~320 | 10 | 5.15 | ||
| 584.80 | 525.00 | 180~320 | 10 | 4.35 | ||
| 651.04 | 584.80 | 180~320 | 10 | 3.53 | ||
| 724.78 | 651.04 | 180~320 | 10 | 2.69 | ||
| 800.00 | 724.78 | 180~320 | 10 | 1.91 | ||
| 848.69 | 800.00 | 180~320 | 10 | 1.44 | ||
| 900.33 | 848.69 | 180~320 | 10 | 0.96 | ||
| 955.12 | 900.33 | 180~320 | 10 | 0.48 | ||
| 1013.00 | 955.12 | 180~320 | 10 | 0.00 | ||
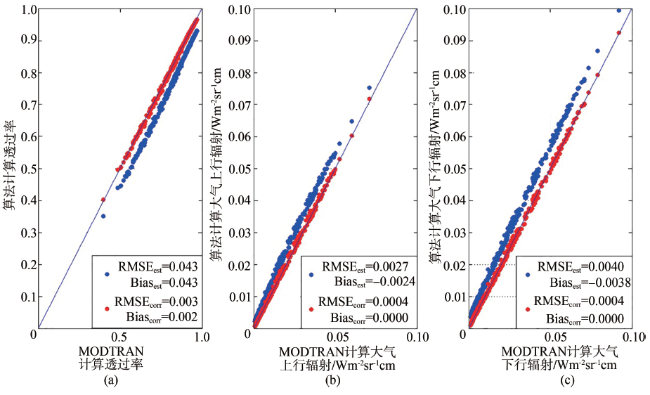
Fig. 5 The comparison of the atmospheric parameters calculated by the original and the revised method according to MODTRAN图5 校正前后模型估算值与MODTRAN计算值对比 |
The authors have declared that no competing interests exist.
| [1] |
[
|
| [2] |
|
| [3] |
|
| [4] |
|
| [5] |
|
| [6] |
|
| [7] |
|
| [8] |
|
| [9] |
|
| [10] |
|
| [11] |
|
| [12] |
USGS. January 29, 2014-Landsat 8 reprocessing to begin February 3, 2014[EB/OL]. , 2015-04-26.
|
| [13] |
|
| [14] |
|
| [15] |
|
| [16] |
|
| [17] |
|
| [18] |
|
| [19] |
|
/
| 〈 |
|
〉 |