
南水北调中线核心区土地利用变化及其生态环境响应研究
作者简介:殷格兰(1992-),女,四川眉山人,硕士生,主要从事水土保持与生态建设研究。E-mail: 772889196@qq.com
收稿日期: 2016-07-10
要求修回日期: 2016-09-12
网络出版日期: 2017-01-13
基金资助
国家自然科学基金重大国际合作基金项目(41161140352)
教育部人文社科青年基金项目(10YJCZH122)
Study of Land Use Change and Eco-environmental Response in the Core Area ofMid-route of South-to-north Water Transfer Project
Received date: 2016-07-10
Request revised date: 2016-09-12
Online published: 2017-01-13
Copyright
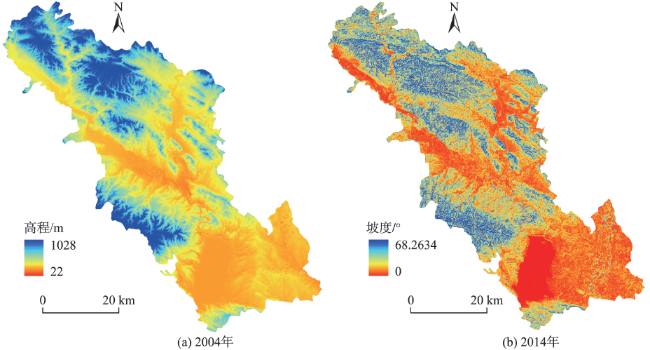
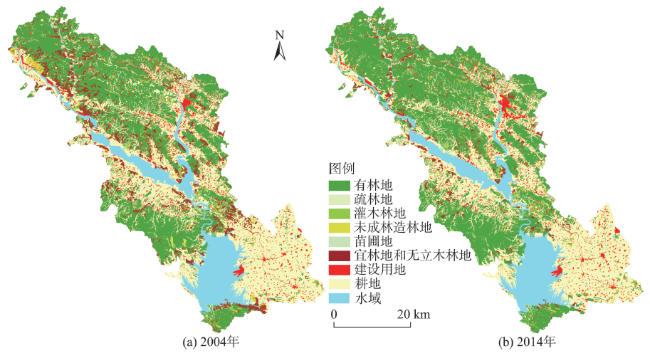
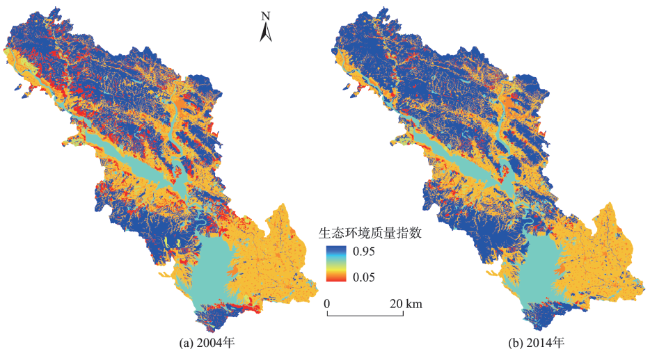
本文以南水北调中线工程核心水源区淅川县为例,选取2004年TM、2014年GF1号影像等数据,解译获取了淅川县土地利用数据,对2004-2014年淅川县土地利用变化进行定量分析。通过选用区域生态环境质量模型,对研究期内淅川县土地利用变化的生态环境效应进行评估,并采用灰色关联法对导致淅川县生态环境质量变化的驱动因素进行分析。研究结果表明:① 2004-2014年,林地、建设用地和水域面积增加,耕地面积减少。在林地资源演化趋势上,有林地、疏林地、灌木林地和苗圃地与林地资源的整体演化格局一致,而宜林地和无立木林地、未成林造林地呈减少的趋势;② 在空间分布上,林地主要分布在海拔高、坡度较陡的北部山区,耕地和建设用地密集分布于海拔低、相对平缓的东南部地区;③ 2004年和2014年2期生态环境质量均在县域内表现出明显的空间差异,呈现出北高南低的分布趋势。研究期内淅川县区域生态环境质量指数从0.5443上升至0.6039,生态环境质量提高,其中宜林地和无立木林地转化为有林地、退耕还林对区域生态环境改善贡献最大;④ 局部地区生态环境呈负向发展,其中对森林资源采取掠夺式开采和粗放型管理、毁林开地对县域生态环境产生的负面影响最为深刻。⑤ 2004-2014年县域生态环境质量变化主要由政策和居民追求利益最大化的行为所驱动。
殷格兰 , 邵景安 , 郭跃 , 党永峰 , 徐新良 . 南水北调中线核心区土地利用变化及其生态环境响应研究[J]. 地球信息科学学报, 2017 , 19(1) : 59 -69 . DOI: 10.3724/SP.J.1047.2017.00059
Taking Xichuan in the core water source area of the middle route of south-to-north water diversion project as a case, this study obtained land use data of Xichuan by interpreting TM(2004) and GF1(2014) image data and quantitatively analyzed land use change of Xichuan from 2004 to 2014. The effects of land use change on ecological environment in Xichuan during the study period were evaluated by using the model of ecological environment quality at regional scale. Moreover, the driving factors of the change in ecological environment quality in Xichuan were analyzed using the gray correlation method. The results showed that: during 2004 to 2014, the area of forest land, construction land and water increased, and the area of farmland decreased. Also, the evolution trend of forest land, woodland, shrub land and nursery garden was consistent with the overall evolution pattern of forest resources. However, suitable land for forest, non timber forest land, unwoodland showed a decreasing trend. In the spatial distribution, forest land was mainly distributed in the northern mountainous area, with the high altitude, the steep slope. Farmland and construction land were mostly distributed in southeast area, with the low altitude, the relatively gentle slope. In the 2004 and 2014, the ecological environment quality of Xichuan both showed obvious spatial difference, and showed the distribution trend of north high and south low. During the study period, the regional ecological environment quality index of Xichuan increased from 0.5443 to 0.6039, and the quality of ecological environment was improved. Moreover, the contribution of suitable land for forest and non timber forest land being converted into forest land, and returning farmland to forests to the improvement of regional ecological environment was the most greatest. The ecological environment in some areas was the negative development. The negative impact of predatory exploitation, extensive management and deforestation on the ecological environment was the most profound. During 2004 to 2014, the change of ecological environment quality in Xichuan was mainly driven by the policy and the resident' pursuit of maximizing the benefits.
Tab. 1 Classification of land use types and evaluation of ecological environment index表1 土地利用类型分类及其生态环境赋值 |
| 一级分类 | 二级分类 | 生态质量赋值 |
|---|---|---|
| 林地 | 有林地 | 0.95 |
| 疏林地 | 0.45 | |
| 灌木林地 | 0.65 | |
| 未成林造林地 | 0.40 | |
| 苗圃地 | 0.40 | |
| 宜林地和无立木林地 | 0.05 | |
| 非林地 | 建设用地 | 0.20 |
| 耕地 | 0.28 | |
| 水域 | 0.61 |
Fig. 1 Topography and slope in the study site图1 研究区高程和坡度图 |
Tab. 2 The main types of land use change in the study area during 2004-2014表2 研究区2004-2014年土地利用变化主要类型 |
| 地类 | 2004年 | 2014年 | 2004-2014年 | ||||||
|---|---|---|---|---|---|---|---|---|---|
| 面积/hm2 | 比例/% | 面积/hm2 | 比例/% | 面积变化/hm2 | 面积变化幅度/% | 比例/% | |||
| 有林地 | 100 989.56 | 35.84 | 120 646.00 | 42.81 | 19 656.44 | 19.46 | 6.97 | ||
| 疏林地 | 2313.66 | 0.82 | 2335.00 | 0.83 | 21.34 | 0.92 | 0.01 | ||
| 灌木林地 | 4625.65 | 1.64 | 4674.87 | 1.66 | 49.22 | 1.06 | 0.02 | ||
| 未成林造林地 | 2334.04 | 0.83 | 801.08 | 0.28 | -1532.96 | -65.68 | -0.55 | ||
| 苗圃地 | 180.00 | 0.06 | 201.21 | 0.07 | 21.21 | 11.78 | 0.01 | ||
| 宜林地和无立木林地 | 25 261.09 | 8.96 | 8895.92 | 3.16 | -16 365.17 | -64.78 | -5.80 | ||
| 建设用地 | 16 691.69 | 5.92 | 16 894.00 | 5.99 | 202.31 | 1.21 | 0.07 | ||
| 耕地 | 94 360.94 | 33.49 | 92 180.23 | 32.71 | -2180.71 | -2.31 | -0.78 | ||
| 水域 | 35 055.75 | 12.44 | 35 184.07 | 12.49 | 128.32 | 0.37 | 0.05 | ||
Tab. 3 land use type area transfer matrix of Xichuan in 2004-2014 (hm2)表3 2004-2014年淅川县土地利用面积转移矩阵(hm2) |
| 土地利用类型 | 有林地 | 疏林地 | 灌木林地 | 未成林 造林地 | 苗圃地 | 宜林地和无立木林地 | 建设用地 | 耕地 | 水域 |
|---|---|---|---|---|---|---|---|---|---|
| 有林地 | 100 550.66 | 2.71 | 229.69 | 34.03 | 171.09 | 1.38 | |||
| 疏林地 | 14.82 | 2298.18 | 0.16 | 0.50 | |||||
| 灌木林地 | 4625.65 | ||||||||
| 未成林造林地 | 1713.33 | 3.46 | 481.50 | 0.43 | 135.32 | ||||
| 苗圃地 | 180.00 | ||||||||
| 宜林地和无立木林地 | 15 224.38 | 30.14 | 37.87 | 195.34 | 21.21 | 8665.46 | 25.07 | 1015.39 | 46.23 |
| 建设用地 | 79.16 | 0.77 | 16 545.52 | 55.79 | 10.45 | ||||
| 耕地 | 3054.10 | 6.68 | 5.18 | 124.24 | 288.67 | 90 798.05 | 84.02 | ||
| 水域 | 9.55 | 0.12 | 4.09 | 35 041.99 |
Fig. 2 Spatial pattern of land use type of Xichuan in 2004 and 2014图2 淅川县2004年和2014年各土地利用类型空间格局 |
Tab. 4 Ecological environment qualityindex of land use type表4 各土地利用类型的生态环境质量指数 |
| 土地利用类型 | 2004年生态环境 质量指数 | 2014年生态环境 质量指数 |
|---|---|---|
| 有林地 | 0.3404 | 0.4067 |
| 疏林地 | 0.0037 | 0.0037 |
| 灌木林地 | 0.0107 | 0.0108 |
| 未成林造林地 | 0.0033 | 0.0011 |
| 苗圃地 | 0.0003 | 0.0003 |
| 宜林地和无立木林地 | 0.0045 | 0.0016 |
| 建设用地 | 0.0118 | 0.0120 |
| 耕地 | 0.0938 | 0.0916 |
| 水域 | 0.0759 | 0.0762 |
| 汇总 | 0.5443 | 0.6039 |
Fig. 3 Spatial pattern of ecological environment quality of Xichuan in 2004 and 2014图3 淅川县2004年和2014生态环境质量空间格局 |
Tab. 5 Main land use change and contribution rate to influence study area ecological environment表5 致使淅川县生态环境改善和恶化的主要土地利用变化类型及生态贡献率 |
| 主要土地利用变化类型 | 生态贡献率 | 占贡献率的百分比/% | 主要土地利用变化类型 | 生态贡献率 | 占贡献率的百分比% | ||
|---|---|---|---|---|---|---|---|
| 致使 生态 环境 改善 | 宜林地和无立木林地-有林地 | 0.04862 | 79.82 | 致使 生态 环境 恶化 | 有林地-宜林地和无立木林地 | 0.00073 | 53.15 |
| 宜林地和无立木林地-未成林造林地 | 0.00024 | 0.40 | 有林地-建设用地 | 0.00009 | 6.56 | ||
| 宜林地和无立木林地-耕地 | 0.00083 | 1.36 | 有林地-耕地 | 0.00041 | 29.47 | ||
| 耕地-有林地 | 0.00726 | 11.92 | 未成林造林地-耕地 | 0.00006 | 4.17 | ||
| 未成林造林地-有林地 | 0.00334 | 5.49 | 耕地-建设用地 | 0.00008 | 5.93 | ||
| 汇总 | 0.06030 | 98.99 | 汇总 | 0.00137 | 99.28 |
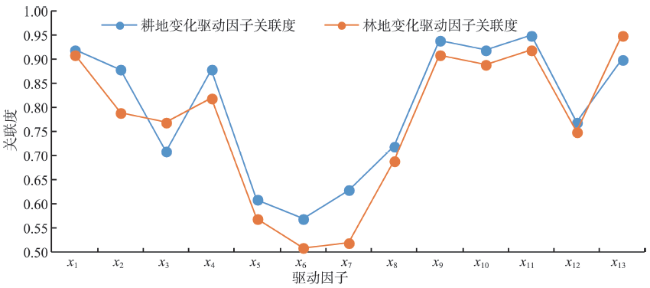
Tab. 6 The analysis of driving factors of degraded primary forest evolution in the study site表6 研究区生态环境质量变化的驱动因素指标体系 |
| 因素 | 指标 |
|---|---|
| 人口 | 年末总人口 x1 |
| 乡村从业人口 x2 | |
| 从事农林牧渔的人口 x3 | |
| 社会经济 | GDP x4 |
| 第一产业增加值 x5 | |
| 第二产业增加值 x6 | |
| 规模以上工业企业个数 x7 | |
| 城乡居民储蓄存款 x8 | |
| 农民人均纯收入 x9 | |
| 劳均耕地量变化 x10 | |
| 全国平均非农工资水平 x11 | |
| 城市化水平 | 城镇化率 x12 |
| 政策 | 林业工程建设面积(包括退耕还林、 生态公益林等工程建设) x13 |
Fig. 4 Driving factors correlation degree of ecological environment quality change in Xichuan图4 导致淅川县生态环境质量变化的主要土地利用类型变化驱动因子关联度 |
The authors have declared that no competing interests exist.
| [1] |
|
| [2] |
|
| [3] |
|
| [4] |
[
|
| [5] |
|
| [6] |
|
| [7] |
[
|
| [8] |
|
| [9] |
[
|
| [10] |
|
| [11] |
[
|
| [12] |
|
| [13] |
[
|
| [14] |
|
| [15] |
[
|
| [16] |
[ Pan P P, Yang G S, Su W Z. Progress on effects of land use change on land productivity[J]. Progress in Geography, 2012,31(5):539-550. ]
|
| [17] |
[
|
| [18] |
[
|
| [19] |
[
|
| [20] |
[
|
| [21] |
[
|
| [22] |
[ Zhang Y, Liu Y F, Gu J P, et al. Land use / land cover change and its environmental effects in Wuhan city[J]. Scientia Geographica Sincia, 2011,31(10):1280-1285. ]
|
| [23] |
|
| [24] |
[
|
| [25] |
[
|
| [26] |
[
|
| [27] |
[
|
| [28] |
[
|
| [29] |
[
|
| [30] |
[
|
| [31] |
[
|
/
| 〈 |
|
〉 |