地理空间分析综合应用

小城市居民出行行为时空动态及驱动机制研究

  • 吴健生 , 1, 2 ,
  • 李博 , 1, * ,
  • 黄秀兰 1
展开
  • 1. 北京大学城市规划与设计学院 城市人居环境科学与技术重点实验室,深圳 518055
  • 2. 北京大学城市与环境学院 地表过程分析与模拟教育部重点实验室,北京 100871
*通讯作者:李博(1991-),男,硕士生,研究方向为城市与区域规划,时空数据分析与挖掘。E-mail:

作者简介:吴健生(1965-),男,博士生导师,教授,研究方向为遥感与GIS、景观生态学与土地利用、数字城市与城市安全。E-mail:

收稿日期: 2016-02-24

  要求修回日期: 2016-04-15

  网络出版日期: 2017-02-17

基金资助

国家自然科学基金项目(41271101)

Spatio-temporal Dynamics and Driving Mechanisms of Resident Trip in Small Cities

  • WU Jiansheng , 1, 2 ,
  • LI Bo , 1, * ,
  • HUANG Xiulan 1
Expand
  • 1. Key Laboratory for Urban Habitant Environmental Science and Technology, School of Urban Planning & Design, Peking University, Shenzhen 518055, China;
  • 2. Laboratory for Earth Surface Processes, Ministry of Education, College of Urban and Environmental Sciences, Peking University, Beijing 100871, China
*Corresponding author: LI Bo, E-mail:

Received date: 2016-02-24

  Request revised date: 2016-04-15

  Online published: 2017-02-17

Copyright

《地球信息科学学报》编辑部 所有

摘要

相比于大城市,中小城市在新型城镇化中至关重要,具有独特的居民出行行为特征,但以往的研究并没有得到足够的关注。目前研究主要使用浮动车数据分析特大城市居民的出行行为,但考虑到小城市土地开发强度低、公共交通不发达、研究空间尺度精细等特点,这些研究方法不能完全适用于针对小城市的研究。因此,本文使用小城市出租车GPS轨迹数据识别上下客事件,沿道路生成随机样点采样得到了分时段的上下客密度,并对其时空动态进行描述和表达;筛选出显著影响上下客密度时空分布的9类设施,建立出租车上下客事件的地理加权回归模型;分析了小城市出租车上下客时空动态与各类城市设施的时空关系,发现在工作日与双休日和一天中不同时段中,不同城市设施对上下客事件的影响具有不同的分布规律及其驱动机制。研究结果可为小城市的城市规划和交通需求精细化管理提供参考。

本文引用格式

吴健生 , 李博 , 黄秀兰 . 小城市居民出行行为时空动态及驱动机制研究[J]. 地球信息科学学报, 2017 , 19(2) : 176 -184 . DOI: 10.3724/SP.J.1047.2017.00176

Abstract

Taxi is an indispensable urban traffic mode in small cities. However, there are limited efforts focusing on explaining traffic congestion or resident commuting from a perspective of land use in small cities. This study attempts to reveal the spatio-temporal dynamics of resident trip activities from the aspect of urban functional features. Based on the GPS taxi data, we build a set of temporal GWR models on an hourly basis, which indicates that urban facilities have various effects on the pick-up and drop-off events during different daytime periods. Nine facilities, including coach station, supermarket, restaurant, residential area, karaoke, hotel, hospital, bank and administrative center, have been observed to be the critical elements to explain the ridership variations. A spatio-temporal mechanism has been proposed based on the discovery that facilities with different urban functions have different impacts on resident trip demands. In contrast to the large cities, the trip activities of residents are spatially and temporally various in the small cities. The primary traffic demands are commuting activities, commerce, entertainment and intercity transfers. More rush hours, especially the “noon rush” and “midnight rush”, are revealed in small cities. The results provide valuable insights for quantitatively predicting the taxi demand as a function of the spatio-temporal variables, which may have implications on the traffic demand management and the urban planning of small cities.

1 引言

城市交通系统与城市空间结构相互影响、相互塑造。理解城市中的交通系统动态和经济社会活动空间分布之间的相互作用关系,有益于城市规划和交通需求管理。城市交通发生在城市空间相互作用过程中,土地利用和区位关系决定了居住、工作、购物、制造和消费等活动的空间分布和出行需要。个体的空间流动从居住地点经过特定的空间和路径到达另外的活动地点,再从活动地点回到居住地点,个体的出行汇聚起来就形成整体的交通需求。随着城市化进程的持续加速,城市空间结构发生了重大变化[1],道路机动性恶化带来的环境污染[2-4]、时间浪费[5-6]和交通事故[7-8]等城市交通问题日益凸显,亟需理清城市资源的空间配置及其时空属性对城市交通网络的影响机制。
随着空间分析技术的发展,应用浮动车数据等“大数据”来揭示城市交通动态,空间精确度高,获取成本更低,比问卷调查等传统方法更具优势[9]。当前已有大量研究借助出租车的行驶状态或上下客事件的识别,对出租车GPS轨迹进行挖掘和分析。张希瑞等[10]和鞠伟奇等[11]分别以通行车辆数和通行速度为基础建立道路通行状况的定量评估模型,分析了深圳市路网通行状况的时空分异规律;唐炉亮等[12]根据交叉口的不同通行模式建立了交叉口通行时间的模糊回归模型,实现了武汉市道路交叉口通行时间的准确探测;孙飞等[13]用出租车空载率来评价出租车运营效率,得到了出租车优质客源的时空分布;桂智明等[14]识别出租车轨迹中的上下车停靠点,并识别了不同时段的交通热点区域;乐阳等[15]基于K-mean算法提出了上客点的时空聚类方法,生成了武汉市各时段的载客热点区域;刘瑜等[16]借助“源-汇”模型,将上下客人次差值聚类来识别用地类型,并探讨了上海市的城市结构;唐炉亮等[17]提出一维网络空间的核密度估计方法,并分析了武汉市道路网络和出租车上客事件的时空动态;潘纲等[18]提出改进的DBSCAN模型,利用出租车上下车点的时空特征识别土地利用类型,分类结果达到95%的识别精度。
这些研究主要关注出行行为对交通特征和城市结构的反演,鲜有考虑城市地理环境与居民出行行为的相互作用,难以解释现象背后的深层机理;另外,这些研究主要关注人口百万级以上的大城市,尚无以小城市为对象的相关研究。现阶段中国小城市土地开发强度低、城市用地布局分散、政府财政收入少、交通基础设施落后,不利于发展地铁、公共汽车、有轨电车等常规公共交通[19]。而出租车可以提供机动灵活、随叫随到的全天候交通服务,比公共汽车等公共交通方式更具可达性和灵敏性,在小城市的公共交通系统中占有更重要的地位。
本文利用2014年7月到9月连续13个星期的广东省台山市100辆出租车GPS轨迹数据,识别研究区出租车上客点和下客点,结合土地利用、道路网络及地理兴趣点的空间分布,建立了地理加权回归模型,模拟居民出行行为时空动态及驱动机制研究,探讨城市交通动态与社会经济功能之间的时空影响机制。

2 研究区域与数据来源

2.1 研究区概况

台山市位于广东省南部,隶属于江门市管辖,曾是近代珠江三角洲西南部地区最重要的商业中心。主城区台城街道常住人口24.7万人,根据2014年10月调整后的城市规模划分标准,属于典型的小城市。研究区域为台山市主城区的建成范围,包括台城街道下属的10个社区,总面积17.62 km2。研究区内仅有公共汽车线路8条,分担率不足7%,出租车是城市交通系统的重要组成部分。

2.2 数据来源与预处理

研究使用台山市出租车公司收集的出租车行驶GPS轨迹数据。数据包含出租车编号、GPS坐标、行驶状态、计价状态、实时车速、累计里程,每隔10 s左右记录一次。为了保证数据的时间平稳性,考虑到出租车乘车数量受到天气、节假日等特殊事件的极大影响,选择2014年7月1日(周二)到2014年9月29日(周一)间的13个星期的轨迹数据,识别出533 122个有效的出租车的上下客事件对,作为研究对象进入模型。
为了进一步的空间统计,需要对上下客事件分别进行采样。有关出租车轨迹的文献中选取的采样方式主要有行政区划、邮政分区或规则网格。当研究对象为大城市的主城区或中小城市时,包含行政区划或邮政分区的数量通常较少,建立统计模型所需的样本量不足。如果按照规则网格,则会出现大量没有事件点或事件点非常少的空白网格,样本分布的正态性不佳,极大影响统计模型精度。由于上下客点绝大多数分布在道路附近100 m以内,为了解决上述问题,本研究沿道路选取380个随机点进行采样,并要求点之间的最小距离大于100 m,以保证随机点的分布具有广泛性。统计随机采样点附近100 m以内上下客点总数的时平均密度,用来检验解释变量的有效性并对其进行筛选;将上下客点分为4类(工作日上客、工作日下客、休息日上客、休息日下客),计算随机采样点附近100 m内4类点的时均密度,作为地理加权回归模型中的被解释变量。
研究用到的资料还有台山市2013年土地利用数据,从中提取非建设用地和住宅用地,该数据与道路数据均来源于台山市城乡规划局。兴趣点位置数据主要抓取自百度地图,包括餐馆、商场、酒店、KTV;其余的兴趣点位置数据也来源于台山市城乡规划局,包括医院、学校、观光景点、行政部门。兴趣点被处理为矢量点格式,属性包含了其空间坐标、名称等。对生成的随机点做以20、50、100、200和500 m为半径的五级缓冲区,分别统计缓冲区内的土地利用面积与兴趣点密度,作为模型中的解释变量。

3 研究方法

3.1 筛选解释变量

解释变量之间的多重共线性问题会对地理加权回归模型的有效性产生负面影响。为避免多重共线性的影响,建立多元逐步回归模型对预处理后的解释变量进行筛选。
Tab. 1 Attribute data after identifying pick-up/drop-off events

表1 识别提取出的上下客事件属性数据

EID PU_TIME PU_Lg PU_Lt DO_TIME DO_Lg DO_Lt
376 546 0903161726 112.786117 22.251945 0903162136 112.7769 22.25272
376 547 0903161733 112.778965 22.265247 0903162138 112.7835 22.25649
376 548 0903161602 112.803337 22.250797 0903162142 112.7840 22.25627
376 549 0903161516 112.778955 22.265227 0903162216 112.7927 22.25392
376 550 0903161632 112.779172 22.265202 0903162217 112.7775 22.25241
376 551 0903161621 112.797722 22.258127 0903162251 112.7929 22.25197
376 552 0903161437 112.771000 22.259725 0903162312 112.7891 22.25273
首先,将全部解释变量与被解释变量的相关程度按照相关性绝对值的大小从大到小排序,在每个类别缓冲区半径不同的解释变量当中,确定与被解释变量相关程度最高(即排序最高)的解释变量。其次,对解释变量进行Pearson相关系数分析,系数大于0.7表示这些解释变量间有很高的共线性,仅需保留其中一个变量。最后,移除在 α = 0.05 显著水平下不满足T检验、不满足模型先验假定的和方差膨胀因子大于10的解释变量。
Tab. 2 Explanatory variables after variable selection

表2 通过筛选的解释变量

变量名 兴趣点类型 缓冲区范围/m
resi_200 居住小区 200
ktv_200 歌厅 200
rest_200 餐馆 200
sta_200 长途车站 200
bank_200 银行网点 200
hos_200 医疗设施 200
shop_100 大型超市 100
hot_100 酒店 100
adm_500 行政办公 500
经过逐步回归,共筛选出9个解释变量进入到最终的多元线性回归模型,包括resi_200、ktv_200、rest_200、sta_200、bank_200、hos_200、shop_100、hot_100、adm_500。最优模型的修正R2达到0.809,表示模型能解释的被解释变量的百分比分别为80.9%。方差膨胀因子(VIF)在1和2之间,表示模型中的解释自变量间不存在明显的共线性。t统计量均大于1.966,表示在0.05的置信水平下解释变量具有显著性。

3.2 建立分层地理加权回归模型

地理加权回归模型(Geographically Weighted Regression, GWR)是将数据的空间位置嵌入到回归参数中,引入地理距离权重进行最小二乘法逐点参数估计,来分析空间数据非平稳性的统计回归模型。其不仅能在从机理方面解释自变量的时空分布特征,而且往往对因变量的解释程度优于常规回归模型,在流行病学、区域经济和城市研究的空间模拟上均有很好表现。地理加权回归模型允许回归参数在局部随地理位置变化,因而可以反映空间非平稳性。
本文结合GWR 4.0软件,选取24 h的时间截面逐时建立地理加权回归模型,进行时空动态及驱动力研究。其表达式如式(1)所示。
y i , t = β 0 , t u i , v i + β k , t u i , v i x k , i , t + ε i , t (1)
式中: ( u i , v i ) 为观测点的地理坐标;t为上客事件的发生时间; β k k=0,1,2,…,n)为第i个观测点的第k个回归参数,用邻近观测点i的数据建立独立的局部回归模型,以加权最小二乘法进行参数估计,使更近的观测点对i点具有更高的权重。权重 w i , j 由式(2)的高斯核函数确定。
w i , j = exp - 0.5 d i , j b 2 , d i , j < b 0 , d i , j b (2)
式中:距离 d i , j 表示观测点j与点i的欧式距离;带宽b表示距离阈值,当b增大时地理加权回归模型将趋近于多元线性回归模型,当b接近0时会导致模型过度拟合。由于点j的分布并不均匀,为确定最佳带宽,使用AICc准则作为确定每个点i带宽的标准。

4 上下客的时空动态

4.1 上下客点的空间分异特征

按照10 m×10 m网格分别统计上客点与下客点的空间分布,初步探讨居民出行行为的空间分异特征,如图1所示。研究区上客点与下客点的空间分布总体呈现为沿道路集中分布、随距离衰减的特点,并在远离道路的地方存在既无上客点也无下客点的空白区域。上下客点随道路远离呈负指数分布而减少,超过90%的上下客点发生在道路两侧 50 m以内。如果采用细网格建立统计模型,上述空白区域会影响模型精度。
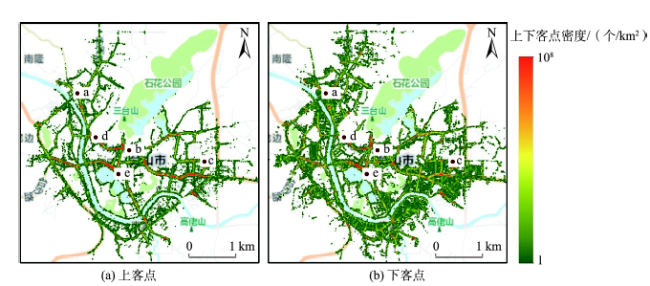
Fig. 1 The spatial distribution of pick-up points and drop-off points

图1 上客点与下客点密度空间分布格局

对比图1(a)与图1(b),上客点的空间分布比下客点更加集中,这与所处道路的等级有关。小城市出租车在实际运营中,乘客往往选择到过往车辆更多的城市主干道叫车,当出租车空载时,会倾向于在客源更充足的城市主干道接客,因此上客事件在城市主干道附近发生得更加频繁;而当出租车上客后,乘客通常选择距离目的地尽可能近的地方下车,由于乘客的目的地具有多样性,下客点会更加分散于城市的次干路和支路。
研究区形成5个典型的上客、下客热点区域, 如图1中的a、b、c、d、e区域。a区域在环市西路、桥湖路与站西路交叉路口北侧,这里有台山汽车总站,是台山市最重要的对外交通运输区,也是产生市内交通客流的重点区域。b区域在环北大道与健康路交叉路口一带,台山市人民医院与台山市妇幼保健院均在200 m范围内,其中台山市人民医院是台山市最大的医疗机构,拥有全市1732张病床中的900张。由于出租车能提供较细致的交通服务,就诊探病是出租车的主要目标客源之一。c区域位于东门白石路附近,分布有主城区最大的居住社区侨雅花苑,该社区定位高端,居民消费能力较高,更经常乘坐出租车出行。d区域位于环北大道、桥湖路与西南路的三叉路口,e区域位于健康路与通济路的路口,二者分别在台城西宁市街区的两端。西宁市街区是广东省历史文化街区,是台山市的传统商业中心,不仅集聚着综合商场、服装店铺,还涉及到酒店、餐馆和娱乐场所。上述分布特点,充分说明了出租车上下客事件的空间集聚,与周边交通站场、公共服务与商业集聚等因素密切相关。

4.2 上客点与下客点的时间变化特征

分别统计研究区中每天每小时内上客事件与下客事件的发生总数,由此得到日变化趋势。如图2所示,曲线分别表示工作日或双休日的时均值,阴影部分表示与时均值相距一个标准差的范围。上客的变化趋势整体上与下客的变化趋势基本相同,下客相比上客有略微的滞后。上下客的次数在凌晨五点钟最少,早高峰后迅速上升,到上午9时后基本稳定。上午10时上下客次数达到小高峰,从11-12时逐渐回落,这与午休的时间基本吻合。下午1时后上下客次数再次增加,而后比较平稳,一直持续到下午5时后开始减少,这时在小城市通常是晚饭时间。下午7时上下客次数快速升高,晚上9-10时达到全天的最高点,11时后迅速减少,直到凌晨。
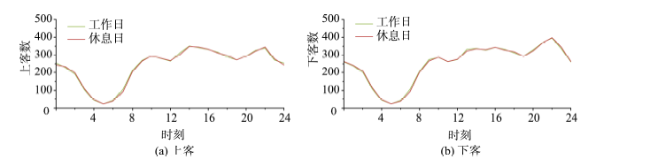
Fig. 2 Variation trends of pick-up events and drop-off events in the study area

图2 研究区上客事件与下客事件总数的变化趋势

图3表示5个典型地点周边100 m范围内上下客数的日变化情况,研究区内不同区域的上客和下客具有不同的活跃时段。其中,a区域主要活跃于早8时到晚7时,这与附近长途车站的运营时间相同;b区域在上午8-10时和下午1-4时下客量较多,乘客到此的主要目的可能是就诊,而上客活跃的时段要比下客晚1 h;c区域在上午7-9时和中午1-2时存在明显的上班乘车高峰,在晚8时还有外出娱乐的乘车高峰,而晚9-11时是该处的返程高峰期;d区域地处商业中心,于下午1时到晚上10时比较活跃,下客高峰出现在下午2时和晚上8时,上客高峰出现在下午4时和晚上7时;e区域处于商业中心的另一侧,最活跃的时段是晚上8时到凌晨1时,业态差异可能是造成d区域和e区域活跃时段不同的主要原因,d区域主要集聚着购物场所,而e区域以娱乐设施为主。
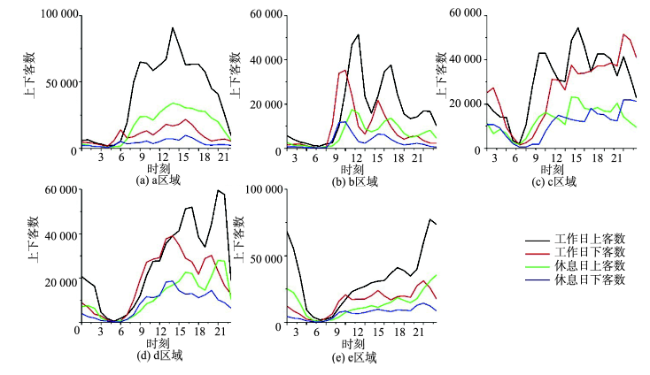
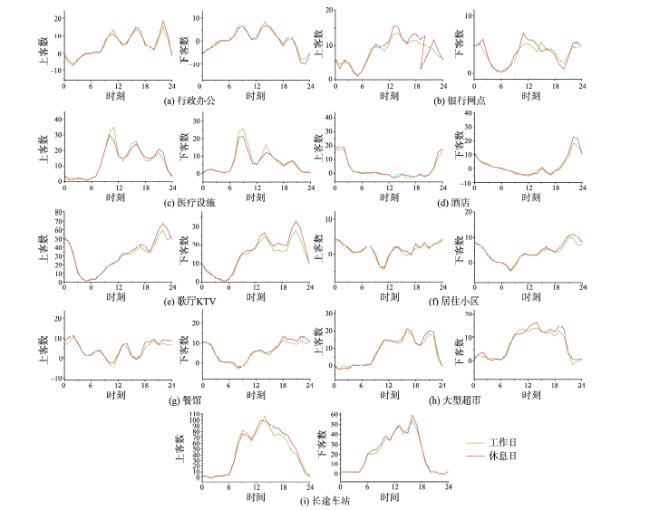
Fig. 3 Variation trends of pick-up/drop-off events at five typical places

图3 5个典型地点附近的上下客日变化情况

4.3 上下客事件分布的时空关联

为了进一步考察研究区上客下客点分布的时空关联及其集聚特征,计算全局Moran's I指数。 图4显示,上客点密度在0.01显著性水平下全天Moran's I值在0.169~0.731之间,表示上客点密度存在正的空间自相关。上午7时到下午5时,上客点密度的全局Moran's I指数在0.169到0.259之间小幅波动,表明空间集聚程度较弱;下午6时后空间集聚程度明显加强,全局Moran's I指数在下午7时达到0.367;空间集聚程度在凌晨1时后再次大幅上升,在凌晨2时达到最高值0.731,此时上客点分布最集中。下客点密度的全局Moran's I指数变化趋势与上客点基本相同,但波动幅度比上客点更加平稳,反映下客点分布相对分散。综上所述,上客点与下客点的空间分布呈现显著为正的空间自相关,建立地理加权回归模型进一步探讨其空间异质性。
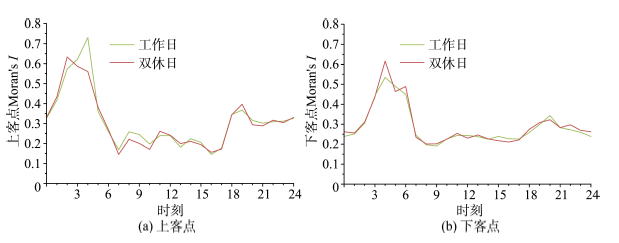
Fig. 4 Variation of Global Moran′s I for the densities of pick-ups and drop-offs

图4 上客点与下客点密度的全局Moran's I指数变化

5 居民出行时空演变的驱动机制

分时段进行地理加权回归,共得到24×4=96个模型。图5为这些模型的调整R2值随时间变化情况,可知绝大多数调整R2大于0.7,说明模型解释力较好。其中半数模型的调整R2超过0.8,表示模型解释了上客点与下客点密度分布总方差的80%以上。此外,还有10个模型的调整R2小于0.5,这些模型集中在晚22时到凌晨2时,由于午夜出行数量较少,更有随机性,因此模型未能充分解释午夜的出行。
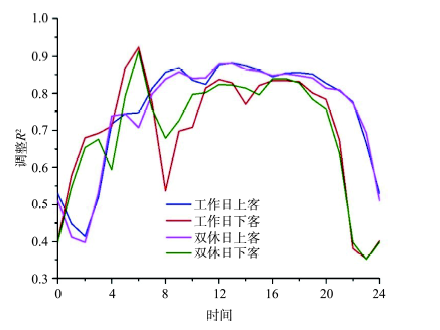
Fig. 5 Adjusted R2 of GWR models on an hourly basis

图5 分时段建立地理加权回归模型的调整 R2

Fig. 6 Variation of the mean and STD values of each GWR coefficient for the pick-up/drop-off events

图6 影响系数的平均值及方差范围的变化趋势

图6为地理加权回归模型中各影响因素系数随时间的变化情况,该系数可表示不同时段内由于各类设施的居民活动而在附近区域产生的上下客事件的数量,即设施对上下客影响的强度,其变化规律为:
(1)将工作日与双休日相比较,同种设施的影响系数变化规律总体上相似,但是工作日和双休日在部分时段的变化情况有所不同。在外出活动的时段,多数设施类别在双休日比工作日产生更多的上下客事件,其中比较明显的有银行网点、酒店、歌厅、餐馆和超市。这些设施均与购物活动和娱乐活动有关,可以说明双休日的消费性活动促进了出租车的出行。另外,双休日住宅小区产生的下客晚高峰从工作日的晚10时结束推迟到了24时结束,也佐证了上述结论。医疗机构是例外,在工作日上下午的出诊时段比双休日产生更多的上下客事件,这是双休日出诊的专业医生较少所致。
(2)同一类别的设施对附近区域上客事件和下客事件的影响存在差异。住宅小区在早晨8-10时开始产生上客早高峰,此时其对附近区域下客的影响微乎其微;在晚上8-11时有很强的返程高峰,但此时其对附近区域上客的影响趋于平稳。办公设施产生的上客高峰发生在早上10时、下午4时和晚上10时,而其产生的下客高峰发生在早上8时、下午2时和晚上8时,相比上客高峰均提前2 h左右;另外,行政办公设施产生的上客晚高峰较强、下客晚高峰较弱。这些差异反映出居民通勤活动中居住地与就业地的交互特征。
(3)不同种类设施对附近区域上下客事件的影响呈现不同的时段分布特征。办公设施、医疗设施、银行网点和超市均呈现显著的“3高峰模式”,然而3个高峰的程度各有不同。行政办公设施和医疗设施相似,3个上客高峰比较平均,但晚7时到晚8时的下客高峰较弱,反映政府部门和医疗机构的运营时间比较规律;银行网点往往分布在毗邻繁华街道的商业区,这些商业区通常活跃在午后和傍晚,引起了较强的午高峰和晚高峰;超市的3个高峰分布在早9时到晚10时的营业时段,但波动幅度都非常小。
(4)夜间经济活动产生的交通需求常常为交通规划者所忽视。在很多南方城市的居民在夜间有宵夜、唱歌等娱乐活动,晚上9时到凌晨3时的午夜时段产生大量的交通需求。研究中,酒店设施对上客和下客的影响呈现“单峰模式”,最高峰分别出现在晚上10时和凌晨2时;歌厅的影响在傍晚开始升高,到晚上9时达到最高,到凌晨2时趋于消失,该现象验证了国家《娱乐场所管理条例》中“每日凌晨2时至上午8时,娱乐场所不得营业”的条款的实施情况;餐馆的影响在凌晨2时最高,甚至超过午餐晚餐的时段,可以看出南方城市居民夜间经济活动对交通需求的重要性。
(5)某些设施对附近区域上客事件和下客事件的影响呈现出显著的小城市特征。例如,从住宅小区对下客事件影响系数的时间变化可以发现,与发达大城市相比,除了最高的晚高峰外在中午11时半和下午4时左右分别有2个次高峰。前者是由于小城市存在午休时间,由于通勤成本远低于大城市,居民通常选择回家午休;后者是低年级学校的放学时间,家长在此时搭乘出租车接送子女放学回家。随着城市规模的扩大和城市功能布局的分异,城市的早晚高峰将会更加显著,午高峰等次高峰将逐渐消失。
由上述规律可以看出,各类设施的影响系数在不同时段的变化规律有很大不同。这说明城市居民根据不同的设施有不同的出行行为模式,随着出行场景的不断变换而汇聚并演化出城市交通的动态景观;而居民的出行行为在空间不断地聚集和消散,也为地理空间赋予了随时间变化的交通需求源汇属性。

6 结论与讨论

本文使用出租车GPS轨迹数据识别出上下客事件,以沿道路分布的随机点对出租车的上下客密度进行分时段采样,表达和描述了台山市主城区居民出行行为的时空动态;筛选出显著影响上下客密度时空分布的9类设施,建立了出租车上下客事件的地理加权回归模型,并避免过多空白栅格可能带来的模型失效;分析了小城市出租车上下客时空动态与各类城市设施的时空关系,发现在工作日与双休日和一天中不同时段中,不同城市设施产生的上下客事件的分布规律及其驱动机制。
结合台山市主城区出租车上下客的时空分异规律,可以看出中小城市居民的出行目的主要是通勤活动、商业娱乐和城际换乘,各种出行活动表现出不同的时空规律和驱动机制,出行高峰时段比大城市多,常出现特有的午高峰和午夜高峰现象等。城市设施的布局对城市交通有较大影响,因此在中小城市的城市规划和交通管理中一定要考虑居住、就业和商业娱乐等生活服务的平衡,从而缓解高峰时段给城市交通等公共服务带来的负荷。
居民出行行为的时空动态,客观上体现出城市居民的日常行为与城市建成环境的相互作用。通过传感技术捕捉居民出行行为的实时动态,充分利用“社会感知计算”挖掘和分析群体的时空交互特征和规律,有助于认清居民与出行场所的时空关系,进而理解城市交通需求的产生机理[20]。研究得到不同城市设施对出租车上下客生成影响的变化曲线,是分析解决高峰时段拥堵等交通问题、实现“错峰出行”并合理调整城市设施空间配置的重要参考依据。
中小城市数量众多,交通低效、用地粗放、城市布局有待优化,在推进新型城镇化的进程中起举足轻重的作用,但国内关于中小城市交通行为和交通管理的研究仍然有限。因此,未来应对中小城市居民出行特征和规律进行进一步探索,为中小城市城市规划和交通精细化管理提供参考,以满足随经济发展而日益增长和多样化的出行需求。

The authors have declared that no competing interests exist.

[1]
周素红,闫小培.广州城市空间结构与交通需求关系[J].地理学报,2005,60(1):131-142.<p>在综述国内外相关研究的基础上,以广州为案例研究城市空间结构与交通需求的关系。结果表明,在城市形态与交通需求的关系方面,广州城市二维形态和三维形态与交通需求的空间分布之间具有一定的耦合性,二者存在一定互为因果的关系;交通方式的转化对城市形态的演化具有一定的驱动作用;城市形态引导着交通需求的总量和布局;同时,社会经济活动及其发展是城市形态与交通需求产生的原因和相互联系的纽带。在城市内部空间结构与交通需求的关系方面,模型分析表明,近年来广州城市内部居住与就业的空间均衡性增强,直接影响了交通需求的产生与分布和交通方式的选择,有利于居民就近选择就业,并使通勤交通的空间分布更加均衡;此外,居住与就业人口迁移先行,引导公共设施的发展也是近年来广州城市发展的主要特征之一;公共设施服务空间与交通需求之间存在需求作用型和供给作用型两种相互作用模式。</p>

[ Zhou S H, Yan X P.The relationship between urban structure and traffic demand in Guangzhou[J]. Arcta Geographica Sinica, 2005,60(1):131-142. ]

[2]
Gan W Q, Davies H W, Koehoorn M, et al.Association of long-term exposure to community noise and traffic-related air pollution with coronary heart disease mortality[J]. American Journal OF Epidemiology, 2012,175(9):898-906.In metropolitan areas, road traffic is a major contributor to ambient air pollution and the dominant source of community noise. The authors investigated the independent and joint influences of community noise and traffic-related air pollution on risk of coronary heart disease (CHD) mortality in a population-based cohort study with a 5-year exposure period (January 1994-December 1998) and a 4-year follow-up period (January 1999-December 2002). Individuals who were 45-85 years of age and resided in metropolitan Vancouver, Canada, during the exposure period and did not have known CHD at baseline were included (n = 445,868). Individual exposures to community noise and traffic-related air pollutants, including black carbon, particulate matter less than or equal to 2.5 mu m in aerodynamic diameter, nitrogen dioxide, and nitric oxide, were estimated at each person's residence using a noise prediction model and land-use regression models, respectively. CHD deaths were identified from the provincial death registration database. After adjustment for potential confounders, including traffic-related air pollutants or noise, elevations in noise and black carbon equal to the interquartile ranges were associated with 6% (95% confidence interval: 1, 11) and 4% (95% confidence interval: 1, 8) increases, respectively, in CHD mortality. Subjects in the highest noise decile had a 22% (95% confidence interval: 4, 43) increase in CHD mortality compared with persons in the lowest decile. These findings suggest that there are independent effects of traffic-related noise and air pollution on CHD mortality.

DOI

[3]
van Kempen E, Babisch W. The quantitative relationship between road traffic noise and hypertension: A meta-analysis[J]. Journal OF Hypertension, 2012,30(6):1075-1086.Objective: Reviews have suggested that road noise exposure is associated with high blood pressure (hypertension). No reliable exposure-response relationship is as yet available. A meta-analysis was carried out in order to derive a quantitative exposure-response relationship between the exposure to road traffic noise and the prevalence of hypertension, and to gain some insight into the sources of heterogeneity among study results.<br/>Methods: Twenty-seven observational studies published between 1970 and 2010 in English, German or Dutch, were evaluated. Finally, the results of 24 studies were included into the data aggregation.<br/>Results: Road traffic noise was positively and significantly associated with hypertension: Data aggregation revealed an odds ratio (OR) of 1.034 [95% confidence interval (CI) 1.011-1.056] per 5 dB(A) increase of the 16 h average road traffic noise level (LAeq16hr) [range 45-75 dB(A)]. Important sources of heterogeneity were the age and sex of the population under study, the way exposure was ascertained, and the noise reference level used. Also the way noise was treated in the statistical model and the minimum years of residence of the population under study, gave an explanation of the observed heterogeneity. No definite conclusions can be drawn about the threshold value for the relationship between road traffic noise and the prevalence of hypertension.<br/>Conclusion: Based on the meta-analysis, a quantitative relationship is derived that can be used for health impact assessment. The results of this meta-analysis are consistent with a slight increase of cardiovascular disease risk in populations exposed to transportation noise.

DOI

[4]
Cui L, Shi J.Urbanization and its environmental effects in Shanghai, China[J]. Urban Climate, 2012,2:1-15.This paper analyzes the processes and characteristics of urbanization in Shanghai, focusing on the population and land use and land cover (LULC) change, and its correlation with the evolution of climatic and ecological indicators based on the historical land use data, meteorological station data, social statistical data, normalized difference vegetation index (NDVI) and land surface temperature (LST) data. The possible association between urban heat island (UHI) and urbanization indicators are also discussed. Examination of the population variation indicates a continuously increase of registered population and a rapid increase of floating population that mainly comes from neighboring provinces in recent years. With rapid urban sprawl, a large amount of cultivated lands has been replaced with building lands around urban areas and towns of Shanghai. Urbanization is correlated with the increase of air temperature, hot days and the decrease of relative humidity, wind speed and vegetation NDVI in Shanghai. The growth of UHI in Shanghai has been driven by the continuous increase of buildings, paved roads, buses, population and GDP, as well as the decrease of cultivated land. Boosting the area of green land in urban areas has to a certain extent mitigated the UHI in Shanghai in recent years.

DOI

[5]
Kok A L, Hans E W, Schutten J M J. Vehicle routing under time-dependent travel times: The impact of congestion avoidance[J]. Computers & Operations Research, 2012,39(5):910-918.Daily traffic congestion forms a major problem for businesses such as logistic service providers and distribution firms. It causes late arrivals at customers and additional costs for hiring the truck drivers. Such costs caused by traffic congestion can be reduced by taking into account and avoiding predictable traffic congestion within vehicle route plans. In the literature, various strategies are proposed to avoid traffic congestion, such as selecting alternative routes, changing the customer visit sequences, and changing the vehicle-customer assignments. We investigate the impact of these and other strategies in off-line vehicle routing on the performance of vehicle route plans in reality. For this purpose, we develop a set of vehicle routing problem instances on real road networks, and a speed model that reflects the key elements of peak hour traffic congestion. The instances are solved for different levels of congestion avoidance using a modified Dijkstra algorithm and a restricted dynamic programming heuristic. Computational experiments show that 99% of late arrivals at customers can be eliminated if traffic congestion is accounted for off-line. On top of that, about 87% of the extra duty time caused by traffic congestion can be eliminated by clever congestion avoidance strategies. Crown Copyright (C) 2011 Published by Elsevier Ltd. All rights reserved.

DOI

[6]
古杰,周素红,闫小培,等.居民日常出行时空集聚视角下的城市交通拥堵形成机制研究——以广州为例[J].地理科学,2012,32(8):921-927.<p>随着大城市的迅速蔓延与扩张, 市内交通拥堵日益成为世界大城市在发展过程中面临的重要问题, 亦成为众多学科研究的热点话题。运用时间地理学的研究方法, 以城市居民日常活动的时空集聚为基本研究视角, 选取广州作为案例, 探讨城市内部交通拥堵形成的机制。研究结果表明, 运动型时空共存是产生交通拥堵的根本原因, 而出行路径的时空集聚必然造成运动型时空共存。广州市居民的出行行为由于受到时空约束的作用下, 造成出行路径的时空集聚, 城市的空间结构和路网结构进一步强化其集聚效应, 从而形成出行路径的时空共存, 并引发交通拥堵。本文的基本结论是城市居民的日常活动受到时间和空间两种因素的共同约束, 当两种约束条件达到一定的程度时将产生时空集聚和运动型时空共存, 并最终形成交通拥堵。良好的交通管理手段只能促使交通拥堵的状况趋于好转, 本质上难以解决交通拥堵问题。城市空间结构、交通线路、交通管制、交通供需状况在一定程度上通过影响居民日常出行路径的时空共存而加剧或缓解交通拥堵现象。所以, 在城市交通供需状况处在一种基本合理的水平下, 解决大城市交通拥堵问题的根本出路在于降低居民日常活动的运动型时空共存。</p>

[ Gu J, Zhou S H, Yan X P, et al.Formation mechanism of traffic congestion in view of spatio-temporal agglomeration of residents′ daily activities: A case study of Guangzhou[J]. Scientia Geographica Sinica, 2012,32(8):921-927. ]

[7]
Wedagama P D M, Bird R N, Metcalfe A V. The influence of urban land-use on non-motorised transport casualties[J]. Accident, Analysis and Prevention, 2006,38(6):1049-1057.ABSTRACT The relationship between non-motorised road traffic casualties and land-use was investigated in two zones of approximately 8 km2 in Newcastle upon Tyne, England. Road traffic accidents are, more usually, analysed in relation to traffic flow, on the assumption that the latter can be derived from land-use data. Here, a direct relationship between primary functional land-use and non-motorised casualties is estimated. We review past work in this area. A shortcoming of casualty data is that it does not record the origin and destination of the journeys being undertaken when the accident occurred. A method was established to identify zones within which most accidents could reasonably be expected to be related to the land-uses within that zone. Generalised linear models were developed using non-motorised casualties as the response variable, with primary functional land-use, population density and junction density as explanatory variables. Separate models were constructed for each combination of cyclists and pedestrians, adults and children, working and non-working hours in city centre and suburban analysis zones. In general, the study found that pedestrian casualties in the city centre zone are particularly associated with an increase in retail and community land-use during working hours. In the city centre zone, out of working hours, an increase in retail land-use (almost certainly clubs and bars) is also associated with an increase in pedestrian casualties. An increase in cyclist casualties during working hours (in the non-pedestrianised area) is associated with an increase in retail land-use.

DOI PMID

[8]
柳林,宋广文,周素红,等.城市空间结构对惠州市中心城区交通事故影响的时间差异分析[J].地理科学,2015,35(1):75-83.<p>利用惠州的交通事故数据,结合惠州的土地利用类型及重要设施的分布数据来探讨城市空间结构对交通事故的影响,使用Kernel 核心密度法定性探讨交通事故密度的时空变化,把土地类型及重要设施抽象化为点空间要素,建立对数线性回归模型定量讨论城市空间结构对城市交通事故影响的时间差异。分析结果表明,在各个时期惠城区商业用地对交通事故的影响均很显著;工作地和车站对交通事故的影响主要体现在交通流高峰及消散期2 个时间段内,但影响程度比商业用地低;在交通流次高峰时,交叉口和工作地的交互作用容易导致事故的高发;城市空间结构通过聚集人流或影响人们的出行等方式对交通事故的发生产生影响。</p>

[ Liu L, Song G W, Zhou S H, et al.Temporally impact of urban structure on city traffic accidents in Huizhou[J]. Scientia Geographica Sinica, 2015,35(1):75-83. ]

[9]
刘瑜,肖昱,高松,等.基于位置感知设备的人类移动研究综述[J].地理与地理信息科学,2011,27(4):8-13.每个人在地理空间内的移动看似随机而没有规律,然而一个较大规模人群的移动却隐藏着特定的模式.为了研究某些地理问题,如交通、疾病传播等,可以从个体行为出发,在地理信息系统的支持下,发现人类移动模式,并构筑基于个体的模拟模型,从而建立微观和宏观之间的桥梁,并支持相应的决策过程.信息通讯技术的发展,一方面改变了人们的空间行为模式,另一方面使得基于位置感知设备获取海量人类移动数据成为可能.近年来,上述研究一直是地理信息科学及相关领域的热点,该文对此进行了总结和评述.

[ Liu Y, Xiao Y, Gao S, et al.A review of human mobility research based on location aware devices[J]. Geography and Geo-Information Science, 2011,27(4):8-13. ]

[10]
张希瑞,方志祥,李清泉,等.基于浮动车数据的城市道路通行能力时空特征分析[J].地球信息科学学报,2015,17(3):336-343.<p>针对城市道路通行能力定量度量指标,提出基于浮动车数据的道路基本通行能力评估方法;以道路通行能力指标来分析深圳市道路网通行能力的时空分异规律,结论如下:城市道路通行能力具有明显的时变特征和空间分布的不均衡性;各行政区域通行能力在工作日变化平缓,在休息日出现午高峰;通行能力余量无论在工作日和休息日都浮动较大,并在休息日中午显著下降;道路通行能力具有明显区域分类现象,人口密度和发展程度较高区域的道路通行能力整体较低,且一天内的变化较小;道路等级对通行能力和通行能力余量影响显著,较高等级道路一天内变化较大,低等级道路则较平稳。</p>

DOI

[ Zhang X R, Fang Z X, Li Q Q, et al.A spatio-temporal analysis on the heterogeneous distribution of urban road network capacity based on floating car data[J]. Journal of Geo-information Science, 2015,17(3):336-343. ]

[11]
鞠炜奇,杨家文,林雄斌.基于速度和出行时间指数的道路机动性评估方法及应用——以深圳市为例[J].地理与地理信息科学,2015,31(5):65-68.采用出租车GPS移动轨迹数据,根据道路通行速度和出行时间指数(TTI)构建一种城市道路机动性的评估方法,为居民出行提供决策支撑。以深圳市为例,将该评估方法用于测算1km×1km均分方格区内出租车的载客平均速度和道路机动性,并引入出行时间指数计算道路机动性的变化程度。结果表明,以速度和出行时间指数评估道路机动性的空间差异及其动态变化,能为评定道路机动性提供决策支持。

DOI

[ Ju W Q, Yang J W, Lin X B.Measuring road mobility by speed and travel time index and its implication: A case study of Shenzhen[J]. Geography and Geo-Information Science, 2015,31(5):65-68. ]

[12]
唐炉亮,郑文斌,王志强,等.城市出租车上下客的GPS轨迹时空分布探测方法[J].地球信息科学学报,2015,17(10):1179-1186.出租车作为城市公共交通的重要补充,是城市面向公众的一个窗口,在人们日常出行中起到越来越重要的作用。出租车资源时空分布的不均衡,直接影响到城市公共交通的运行效率和城市形象。通过研究出租车上下客的时空分布特征,不仅可以反映城市居民的工作、生活、出行的规律和模式,也可反映城市空间在不同时段内的动态性和“热度”。本文基于出租车GPS轨迹大数据,针对出租车上下客事件轨迹呈现的线状特征,以及城市道路网络空间不同时段“热度”的动态分段特征,提出了出租车上下客时空分布的线密度探测模型。该模型通过对时间多粒度描述与表达,对不同城市道路网络空间,进行出租车上下客事件的探测和分析,获取城市出租车上下客的时空分布规律,更深刻地理解和认知了城市空间的动态性。

DOI

[ Tang L L, Zheng W B, Wang Z Q, et al.Space time analysis on the pick-up and drop-off of taxi passengers based on GPS big data[J]. Journal of Geo-information Science, 2015,17(10):1179-1186. ]

[13]
孙飞,张霞,唐炉亮,等.基于GPS轨迹大数据的优质客源时空分布研究[J].地球信息科学学报,2015,17(3):329-335.<p>出租车客源的时空分布不均衡,不仅影响着出租车司机的收入,更重要的是极大地影响着出租车作为城市公共交通重要补充作用效益的发挥和提升。由于拒载、空载等因素的影响,传统研究出租车驾驶行为的评价方法,已无法准确表达出租车运营效率。本文以出租车GPS数据为研究对象,通过加入出租车空载状态的影响来优化出租车效率评估模型,首次提出了出租车优质客源的概念,对出租车优质客源进行定义与量化,建立优质客源的时空分析方法,并从出租车行驶轨迹中提取优质客源信息与优质客源的时空分布规律,为改善出租车司机的收益及提高出租车运营效率提供科学依据。</p>

DOI

[ Sun F, Zhang X, Tang L L, et al.Temporal and spatial distribution of high efficiency passengers based on GPS trajectory big data[J]. Journal of Geo-information Science, 2015,17(3):329-335. ]

[14]
桂智明,向宇,李玉鉴.基于出租车轨迹的并行城市热点区域发现[J].华中科技大学学报(自然科学版),2012,40(S1):187-190.提出一种基于MapReduce的从出租车轨迹中提取交通热点区域的分布式并行算法,首先对原始轨迹数据进行停靠点的提取来消除噪声并剔除行驶中间点,然后通过对按时间段分块的停靠点并行运行基于密度的带有噪声的空间聚类(DBSCAN),实现对分块的数据聚类来发现不同时间段的热点区域.经过在实际数据集上的试验表明:与传统方法相比,该方法在准确性和大数据量下的整体效率具有优势.

[ Gui Z M, Xiang Y, Li Y J, et al.Parallel discovery of city hot spot based on taxi trajectories[J]. Journal of Huazhong University of Science and Technology (Nature Science Edition), 2012,40(S1):187-190. ]

[15]
Yue Y, Zhuang Y, Li Q, et al.Mining time-dependent attractive areas and movement patterns from taxi trajectory data[C]. 2009 17th International Conference on Geoinformatics, 2009:1-6.

[16]
Liu Y, Wang F, Xiao Y, et al.Urban land uses and traffic ‘source-sink areas’: Evidence from GPS-enabled taxi data in Shanghai[J]. Landscape and Urban Planning, 2012,106(1):73-87.Most of the existing literature focuses on estimating traffic or explaining trip lengths from land use. This research attempts to reveal intraurban land use variations from traffic patterns. Using a seven-day taxi trajectory data set collected in Shanghai, we investigate the temporal variations of both pick-ups and drop-offs, and their association with different land use features. Based on the balance between the numbers of drop-offs and pick-ups and its distinctive temporal patterns, the study area is classified into six traffic 'source-sink' areas. These areas are closely associated with various land use types (commercial, industrial, residential, institutional and recreational) as well as land use intensity. The study shows that human mobility data from location aware devices provide us an opportunity to derive urban land use information in a timely fashion, and help urban planners and policy makers in mitigating traffic, planning for public services and resources, and other purposes. (C) 2012 Elsevier B.V. All rights reserved.

DOI

[17]
Tang L, Kan Z, Zhang X, et al.A network kernel density estimation for linear features in space-time analysis of big trace data[J]. International Journal of Geographical Information Science, 2016,30(9):1-21.ABSTRACT Kernel Density Estimation (KDE) is an important approach to analyse spatial distribution of point features and linear features over 2-D planar space. Some network-based KDE methods have been developed in recent years, which focus on estimating density distribution of point events over 1-D network space. However, the existing KDE methods are not appropriate for analysing the distribution characteristics of certain kind of features or events, such as traffic jams, queue at intersections and taxi carrying passenger events. These events occur and distribute in 1-D road network space, and present a continuous linear distribution along network. This paper presents a novel Network Kernel Density Estimation method for Linear features (NKDE-L) to analyse the space–time distribution characteristics of linear features over 1-D network space. We first analyse the density distribution of each linear feature along networks, then estimate the density distribution for the whole network space in terms of the network distance and network topology. In the case study, we apply the NKDE-L to analyse the space–time dynamics of taxis’ pick-up events, with real road network and taxi trace data in Wuhan. Taxis’ pick-up events are defined and extracted as linear events (LE) in this paper. We first conduct a space–time statistics of pick-up LE in different temporal granularities. Then we analyse the space–time density distribution of the pick-up events in the road network using the NKDE-L, and uncover some dynamic patterns of people’s activities and traffic condition. In addition, we compare the NKDE-L with quadrat method and planar KDE. The comparison results prove the advantages of the NKDE-L in analysing spatial distribution patterns of linear features in network space.

DOI

[18]
Pan G, Qi G, Wu Z, et al.Land-use classification using taxi GPS traces[J]. IEEE Transactions on Intelligent Transportation Systems, 2013,14(1):113-123.Detailed land use, which is difficult to obtain, is an integral part of urban planning. Currently, GPS traces of vehicles are becoming readily available. It conveys human mobility and activity information, which can be closely related to the land use of a region. This paper discusses the potential use of taxi traces for urban land-use classification, particularly for recognizing the social function of urban land by using one year's trace data from 4000 taxis. First, we found that pick-up/set-down dynamics, extracted from taxi traces, exhibited clear patterns corresponding to the land-use classes of these regions. Second, with six features designed to characterize the pick-up/set-down pattern, land-use classes of regions could be recognized. Classification results using the best combination of features achieved a recognition accuracy of 95%. Third, the classification results also highlighted regions that changed land-use class from one to another, and such land-use class transition dynamics of regions revealed unusual real-world social events. Moreover, the pick-up/set-down dynamics could further reflect to what extent each region is used as a certain class.

DOI

[19]
王妤岌,程龙,冯岑,等.中小城市居民出行特征片区差异性分析——以浙江省长兴县为例[J]. 市交通,2015,13(2):55-62.由于城市规模的差异,中小城市的出行需求与大城市存在较大区别,且由于区域发展进程的不同,中小城市内部也多呈现明显的片区差异。以浙江省长兴县中心城区居民出行调查数据为基础,在城区总体居民出行特征框架下,从出行次数、出行目的、出行距离、出行方式和出行时耗等方面分析各片区居民出行特征的差异,并以此挖掘片区的发展症结。最后以优化出行结构为目的,从用地规划、非机动交通环境营造、公共交通优化和小汽车管控等四个方面对中小城市的交通发展提出对策。

DOI

[ Wang Y J, Cheng L, Feng C, et al.Area difference in travel characteristics of residents in small and medium-sized cities: A case study in Changxing county, Zhejiang Province[J]. Urban Transport of China, 2015,13(2):55-62. ]

[20]
关美宝. 时间地理学研究中的GIS方法:人类行为模式的地理计算与地理可视化[J].国际城市规划,2010,25(6):18-26.在过去的四十多年里,人类在时空间中的活动与移动吸引了地理学领域的广泛关注.时间地理学是最早研究人类在时空间中的活动与移动模式的分析视角之一.尽管时间地理学在地理研究的很多领域中显示出其有效性,但是直到20世纪90年代中期,很少有研究将其作为一种分析方法.随着与地理相关的个体数据的可获取性以及地理信息系统(GIS)的地理计算能力的增强,时间地理学概念的操作与应用越来越成为可能.本文讨论了基于GIS的地理计算与三维地理可视化方法在时间地理学中的应用.这些方法的有效性可在笔者近期的研究中找到案例.结果表明,GIS为时间地理学概念的应用以及操作方法的未来发展提供了有效的平台.

DOI

[ Kwan M-P.GIS methods in time-geographic research: geocomputation and geovisualization of human activity patterns[J]. Urban Planning International, 2010,25(6):18-26. ]

文章导航

/