遥感科学与应用技术

基于VIIRS数据的油气平台提取技术研究

  • 李强 , 1, 2, 3 ,
  • 苏奋振 , 2, 3, * ,
  • 王雯玥 2, 3
展开
  • 1. 兰州交通大学测绘与地理信息学院,兰州 730070
  • 2. 中国科学院地理科学与资源研究所 资源与环境信息系统国家重点实验室,北京 100101
  • 3. 中国南海研究协同创新中心,南京 210023
*通讯作者:苏奋振(1972-),男,福建龙岩人,研究员,主要从事海岸带海洋遥感与地理信息系统。E-mail:

作者简介:李 强(1989-),男,甘肃庆阳人,硕士生,主要从事南海油气资源遥感监测。E-mail:

收稿日期: 2016-03-28

  要求修回日期: 2016-07-23

  网络出版日期: 2017-03-20

基金资助

高分辨率对地观测系统重大专项(00-Y30B15-9001-14/16-5)“重要战略资源(石油)安全动态监测评估子系统及应用示范(一期)”

Research on Oil and Gas Platform Extraction Technology Based on VIIRS Data

  • LI Qiang , 1, 2, 3 ,
  • SU Fenzhen , 2, 3, * ,
  • WANG Wenyue 2, 3
Expand
  • 1. Faculty of Geomatics, Lanzhou Jiaotong University, Lanzhou, 730070, China
  • 2. State Key Laboratory of Resources and Environmental Information System, Institute of Geographic Sciences and Natural Resources Research, CAS, Beijing, 100101, China
  • 3. Collaborative Innovation Center of South China Sea Studies, Nanjing 210023, China
*Corresponding author: SU Fenzhen, E-mail:

Received date: 2016-03-28

  Request revised date: 2016-07-23

  Online published: 2017-03-20

Copyright

《地球信息科学学报》编辑部 所有

摘要

油气平台作为海上油气资源勘探开发的主要设备之一,其数量与空间分布反映了一个区域油气资源的开发状况。普通光学影像易受天气状况影响,而雷达数据成本较高,这给油气平台的检测带来了一定的困难。由于油气平台作业过程中,需要灯光照明,同时伴气的燃烧也产生很强的灯光,因此可以通过检测灯光来实现油气平台的提取。针对VIIRS数据具有强夜间光探测能力,本文提出了一种卷积运算临界值法对海上油气平台进行提取。首先对2期不同时相的VIIRS数据进行卷积运算,对亮像元进行了增强处理,对背景像元进行弱化处理,从而明确区分疑似目标与背景,然后以0值为分界点,对疑似目标进行提取,最后利用油气平台相对静止的特性,通过邻域分析,实现油气平台的提取。结果表明,本文提出的卷积运算临界值法可以有效地提取油气平台,提取准确率约为85.4%,同时可以有效地减少由于经验阈值对提取结果造成的误差。

本文引用格式

李强 , 苏奋振 , 王雯玥 . 基于VIIRS数据的油气平台提取技术研究[J]. 地球信息科学学报, 2017 , 19(3) : 398 -406 . DOI: 10.3724/SP.J.1047.2017.00398

Abstract

As one of the major equipment for offshore oil and gas exploration, the number and spatial distribution of oil and gas platform would reflect the situation of exploitation in a region. Nowadays, it is difficult to acquire data of oil and gas platform because the traditional field observation method is expensive and time-consuming. With the development of remote sensing technology, remote sensing images as an important data source are applied in the extraction of marine targets effectively. However, traditional optical images are easily influenced by cloud and the radar data are too expensive, which make oil and gas platform detection difficult. During the operation process, the oil and gas platform need lamplight, and gas combustion also generate strong light. Thus, the oil and gas platform extraction can be done by detecting light. VIIRS data has a strong ability of detecting light at night and it can be used for the data extraction of oil and gas platform. Considering the feature of VIIRS data, this paper proposed a convolution operation threshold algorithm to extract offshore oil and gas platform and chose Pearl River Mouth basin as a study area for experiment. Firstly, VIIRS data of different time phase were operated to enhance the pixel value and weaken the background pixels so that the suspected target and background can be distinguished. Then, we took the 0 value as the dividing point to extract suspected targets. Finally, we extracted oil and gas platform through the neighborhood analysis making use of the relatively static characteristic of oil and gas platform. The results showed that the accuracy of extracting oil and gas platforms was about 85.4% and the method could effectively reduce the impacts of empirical threshold. At last, this study analyzed the shortage and causes of using VIIRS data to extract oil and gas platforms.
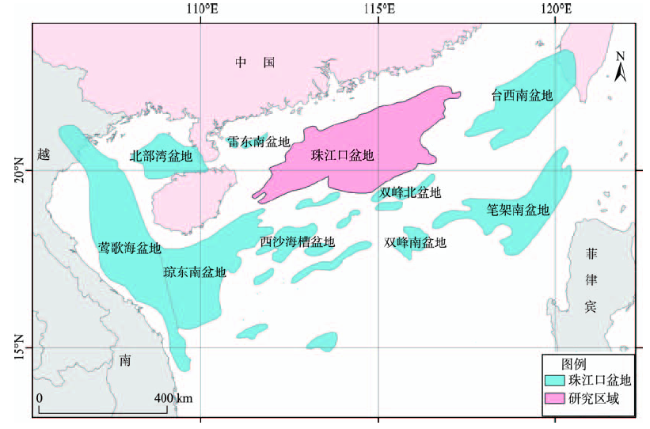
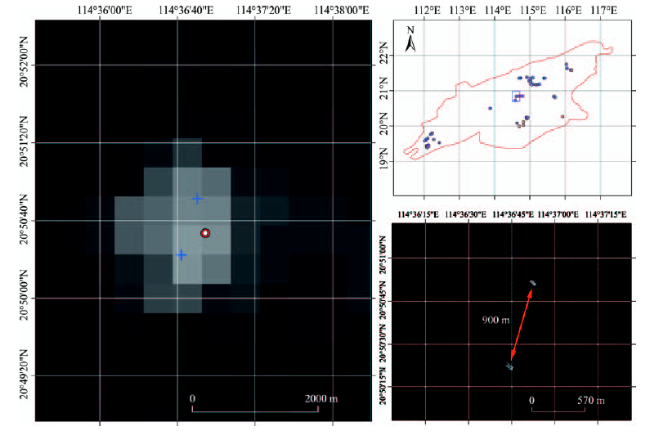
1 引言

南海作为特殊的海域,备受国内外关注,其丰富的油气资源是引起南海争端的重要原因之一。随着海洋钻井技术的成熟,海洋油气资源的开采力度不断加大,油气平台的数量、分布位置在一定程度上反映了一个国家的开发强度和开发能力。对油气平台分布情况的掌握也对航道安全维护、海面溢油检测有着极其重要的意义。1957年,莺歌海上燃烧的气苗开启了中国石油工业的未来[1],经过半个多世纪的勘探开发,油气平台的数据量不断发生变化。通过实地观测的方式检测油气平台的分布及变化情况难度大、成本高,因此利用遥感手段进行大尺度油气平台的提取显得至关重要。
早在1973年,斯坦福大学雷达天文学中心THOMAS A.CROFT从美国空军DAPP系统获取的夜间灯光影像发现其能够对油气田中废气的燃烧进行检测,认为对夜间灯光数据的进一步分析能够加深世界范围上的油气资源研究工作[2]。Eldvige等分别在2001、2007、2009年利用美国的DMSP/OLS灯光数据对全球尺度下废气的燃烧进行检 测[3-5],证明了灯光数据检测废气燃烧的可行性。随着对遥感影像分辨率要求的提高,2011年10月美国发射了Suomi NPP环境监测卫星,其搭载的可见光/红外成像辐射仪VIIRS(Visible Infrared Imaging Radiometer)将灯光数据的分辨率提高了一倍。 Elvidge等人又利用VIIRS的DNB波段数据结合热红外波段数据对海上废气的燃烧进行了检测[3,6],得出VIIRS在全球尺度检测废弃燃烧方面,VIIRS优于DMSP/OLS和MODIS数据的结论。但并非所有的油气平台都有废气燃烧塔,因此他们仅提取了海上废气的燃烧点,并没进行油气平台的提取。2014年苏伟光利用DMSP/OLS数据从大尺度上对越南和马来西亚2007-2012年在中国“九段线”内所建造的油气平台进行了提取,得出越南在近5年来新增油气平台3处,马来西亚5年来新增油气平台8处的结论 [7]。该方法使用的数据分辨率较低,提取工作量大,精度较低。
合成孔径雷达(Synthetic Aperture Radar,SAR)是一种高分辨率成像传感器,具有观测范围广、周期短、数据时效性强、空间分辨率高且不受天气条件影响,能够全天时、全天候成像等优点,因而近年来得到了迅猛发展。Casadio等利用ATSR(Along Track Scanning Radiometer)的SWIR、MIR、TIR 3个波段的结合,通过对海洋表面热点检测实现全球尺度的废气燃烧情况检测和分析[8-10]。同时利用SAR实现海上钻井平台位置的提取并证明了其方法可应用于其他领域[11],为ESA(European Space Agency)的全球尺度废气燃烧检测计划做出了很大的贡献。2013年王加胜等利用ENVISAT ASAR数据提出了一种基于恒虚警率的算法,实现了越南东南海域海洋钻井平台的提取[12]。2014年万剑华等又利用2 m分辨率的TerraSAR-X数据,以及10 m分辨率的RadarSat-2数据对南海某区域的油气平台进行了提取,再次证明了雷达数据提取油气平台的可 行性[13]
尽管国内外诸多学者在研究油气平台的提取,但是光学影像重访周期长、覆盖范围小,易受天气状况影响,很难获取多实相影像[14]。而利用雷达数据提取油气平台成本较高,同时由于海上参考点选取困难[12],影像校正难度大。在影像分割方面,大多都是针对研究区的实际情况确定的分割阈值[15-16],在大尺度上,并不具有通用性。因此,在提取技术上存在极大的局限性和主观随意性。美国国家地球物理数据中心利用每月获取的无云数据,合成了月平均灯光数据,有效地弥补了光学影像数据获取、处理难度大的问题,同时也弥补了雷达数据成本高、处理难度大的问题。因此,本文总结前人的工作,提出了一种基于VIIRS灯光数据的卷积运算临界值法,对海上油气平台进行了提取。在疑似目标的提取过程中,利用卷积运算的临界值作为分割阈值,这种方法能够从一定程度上解决由于主观选取分割阈值带来的误差。同时,对VIIRS数据提取油气平台过程中存在的问题和不足进行了详细分析。

2 研究区概况与数据源

2.1 研究区概况

珠江口盆地位于南海北部,西邻琼东南盆地与莺歌海盆地,东接台西南盆地,是大陆架和陆坡上一个以新生代为主的沉积盆地,如图1所示。珠江口盆地是南海北部裂陷盆地群中最大的含油气盆地[17],也是中国目前开发强度最大的油气盆地。目前该区域已有包括文昌、陆丰、番禹、流花等10多个油气田投入生产。
Fig. 1 Sketch map of study area

图1 研究区示意图

2.2 数据源

2.2.1 VIIRS夜间灯光数据
VIIRS可见光红外成像辐射仪是NPP卫星上重要的传感器,具有22个光谱波段,其中可见光-近红外波段9个,短、中波红外8个,热红外4个。为了检测夜间的云层及全球夜间灯光强度分布,VIIRS还专门设计了一个低照度条件下的中心波长为 0.7 μm的可见光-近红外宽波段DNB(Day-Night Band)[9]。美国国家地球物理数据中心对地观测组提供的1版本数据(http://ngdc.noaa.gov/eog/viirs/download_viirs_ntl.html),利用DNB波段合成月平均灯光辐射数据,平均之前过滤掉了杂散光、闪电、月光、云覆盖的影响,同时保留了极光、火、船、以及其他暂时性灯光,为油气平台的提取提供了很好的数据支持。该数据利用赤道和120°经度间隔将全球分为6个区块,分别为75N180W、75N060W、75N060E、00N180W、00N060W、00N060E。南海位于75N060E区块,本研究即使用该区块2014年5月、2014年6月2期单月合成的VIIRS灯光数据,分辨率为417 m,如图2所示。
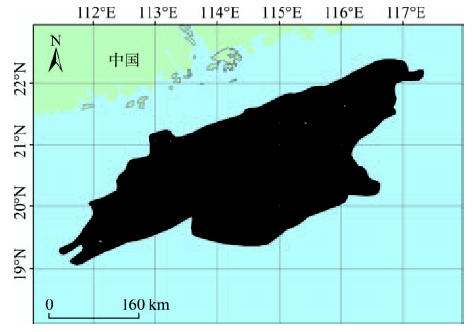
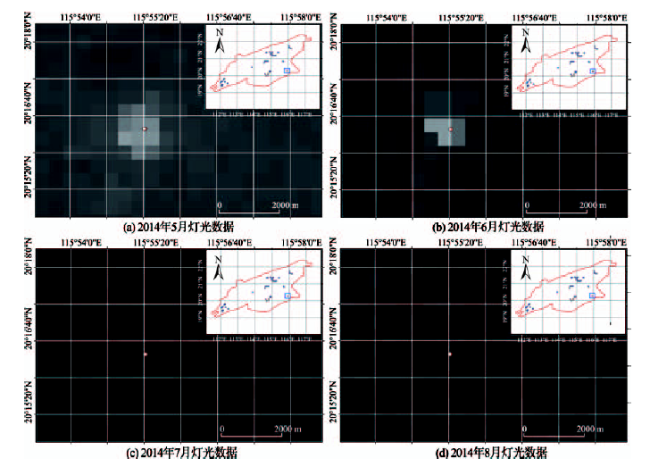
Fig. 2 VIIRS light data of study area in May, 2014

图2 研究区2014年5月VIIRS灯光数据

2.2.2 高分一号卫星数据
GF-1卫星是中国高分辨率对地观测系统的第一颗卫星,于2013年4月成功发射,搭载了一个PMS传感器和一个WFV传感器,PMS传感器由两台2 m分辨率全色/8 m分辨率多光谱相机组成,WFV传感器由4台16 m分辨率的多光谱相机组成。本文搜集了研究区2014年5月的GF-1号PMS数据,用以验证实验精度。该数据来自中国资源卫星应用中心(http://218.247.138.121/DSSPlatform/productSearch.html)。

3 VIIRS数据提取油气平台的方法

海上灯光的主要来源为油气平台灯光、废气燃烧的灯光以及舰船的灯光,因此对于油气平台的提取而言,主要工作转换为如何剔除大量舰船的干扰。舰船与油气平台的主要区别在于油气平台的灯光是相对静止,而舰船的灯光是相对移动。因此,可以利用这一特征区分舰船与油气平台。

3.1 灯光数据特性

VIIRS数据像元值(Digital Number,DN)代表灯光的辐射强度,单位为w·cm-2·sr-1,表示海上目标灯光的强度,主要以单个像元或者像元群的方式存在,因此要提取海上目标,首先需要提取VIIRS数据中的亮像元和像元群。为了很好地提取亮目标的像元,同时分割像元群,需要对油气平台在影像上呈现的特征进行分析。如图3所示,海上亮目标的像元值一般高于背景值,然而通过利用部分已知位置油气平台和其对应的VIIRS数据的像元值对比分析,发现部分油气平台的像元像元值仅介于0到1之间,而这部分油气平台往往很难提取。传统的阈值分割多采用经验值,这些值很容易将亮度值极小的目标点剔除掉,而且经验阈值主观性较强,通用性差。
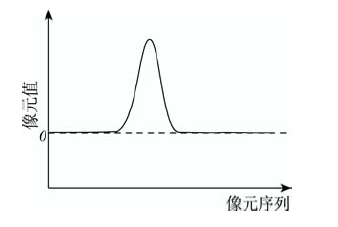
Fig. 3 Schematic diagram of detecting characteristicvalue of oil and gas platform

图3 油气平台特征值检测示意图

3.2 卷积运算临界值法

对于离散的二维空间,卷积运算作为一种邻域运算,广泛用于图像处理、DEM分析等众多领域[18]。为了很好地提取亮目标的像元,本文选择卷积运算对影像进行处理。通过这种手段来加强目标像元的像元值,弱化背景像元值。从而使目标像元和背景像元得到很好的区分。在进行卷积运算时,需要一个具有较大中心值的卷积核来实现,核心像元周围为负值权重。卷积核也称为“模板”,实际上是一个权矩阵。卷积运算可以看做是加权求和的过程,所以图像区域的大小与权矩阵的大小一致。
G = Ri - 1 j - 1 Ri - 1 j Ri - 1 j + 1 Ri j - 1 Rij Ri j + 1 Ri + 1 j - 1 Ri + 1 j Ri + 1 j + 1 (1)
K = - 1 - 1 - 1 - 1 a - 1 - 1 - 1 - 1 (2)
式中:G为图像区域;K为权矩阵;ij代表像元所在的行与列;a为卷积核的中心权重。建立在离散卷积基础上的空间域关系式,如式(3)所示。
g ( i j ) = m = 1 M n = 1 N G ( m , n ) K ( m , n ) (3)
式中:gi,j)为影像输出;Gm,n)为图像函数;Km,n)为权矩阵函数。本文选择高通滤波的卷积核对影像进行卷积处理。
通过卷积运算处理后,目标像元的亮度值更大,背景目标亮度值更小,而且目标像元与背景像元之间会出现明显负值。对卷积处理后的影像进行灰度直方图分析(图4),可发现波峰的两端出现了明显的波谷,而且都为负值,这些负值可以将局部亮目标像元与周围背景像元明显的区分开来,使亮目标形成相对独立的像元或像元群。因此提取像元值大于0的像元或像元群,即可提取到包括舰船、油气平台灯光在内的所有疑似目标灯光,从而避免由于人的主观意识确定阈值引起的误差。
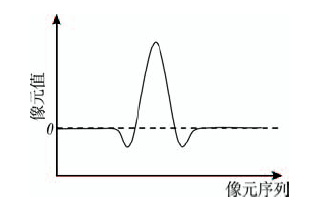
Fig. 4 Schematic diagram of detecting characteristic value of oil and gas platform after convolution operation

图4 卷积运算后的油气平台特征值检测示意图

通过美国国家地球物理数据中心对地观测组获取的VIIRS数据空间分辨率为417 m,而油气平台的大小一般不会超过120 m,从数据分辨率与平台大小关系来看,一个像元可能包含2~3个油气平台,因此在进行而卷积运算时,需要确定合适的卷积窗口大小,以保证提取结果的准确性。窗口太小,卷积运算时,很难区分距离特别近的目标,窗口太大,容易漏提目标。因此,为了确定卷积窗口的大小,本文利用ENVI软件,分别选择3×3、5×5、7×7窗口大小对研究区域进行卷积运算,卷积核大小取软件默认值。对比原始影像可以发现,随着窗口的增大,亮点周围的负值区域(黑色区域)也逐渐增大(图5)。当窗口为3×3和5×5时,像元值的负区间较小,局部中心亮点的辐射范围可能超过2 km,因此中心亮点很容易受到背景值的影响,对于距离特别近的平台很难区分开来。当窗口为7×7时,中心亮点与背景值得到了很好的区分,从而可以将中心亮点方圆3 km(分辨率为417 m)外的背景值变成负值;而油气平台方圆3 km外就有可能出现新的油气平台,甚至在3 km内就会出现新的平台。当窗口超过7×7时,很容易将亮像元周围其他油气平台灯光值变成负值,从而导致提取不完全,因此,选择7×7窗口大小作为卷积核的大小对数据进行处理。亮点灰度图像如图6所示。
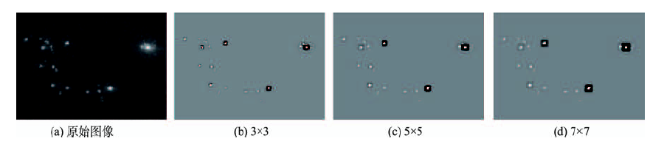
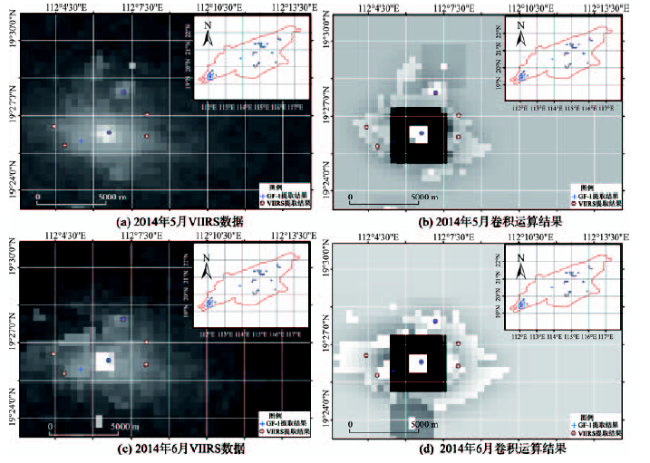
Fig. 5 Comparison of convolution operation results

图5 卷积结果对比图

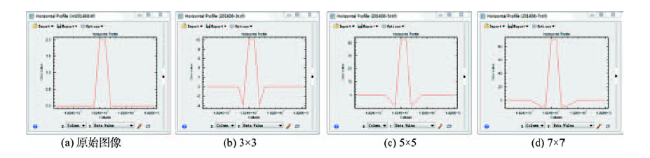
Fig. 6 Profile of gray level changes of an example bright spot

图6 某亮点灰度变化情况剖面图

3.3 油气平台的提取

利用卷积运算临界值法提取的疑似目标灯光主要为油气平台灯光、废气燃料灯、船舰灯光,而3种灯光的主要特点在于舰船的灯光是移动的,而油气平台和礁堡的灯光是相对静止的,因此可以通过对比2期影像提取的疑似目标点集是否相对静止,从而剔除舰船灯光。主要步骤为:① 将2期影像提取的疑似目标转成点数据;② 对疑似目标点集进行邻域分析。由于油气平台的大小一般不会超过120 m,以“海洋981”深水半潜式钻井平台为例,该平台长114 m,宽90 m;而VIIRS数据的分辨率为417 m,另外油气平台方圆500 m内,一般不会出现其他油气平台,因此可将阈值设为500,若邻域分析结果小于500 m,则认为2个点没有发生相对移动,为油气平台。对于废弃的油气平台或者短暂性停止作业的平台,由于没有灯光的辐射,因此VIIRS影像无法获取灯光信息,对于类似平台则无法通过灯光数据来提取。

4 结果与讨论

4.1 VIIRS实验结果

在对VIIRS数据滤波后,将结果中小于等于0的值剔除掉,并将得到的独立像元与像元群转换成矢量点数据,得到2014年5月和2014年6月疑似油气平台数据。其中,2014年5月共提取出216个疑似平台(图7(a)),2014年6月共提取出135个疑似平台(图7(b))。由于6月为我国休渔期,舰船的干扰相对较小,因此提取的疑似平台中,6月比5月相对较少。
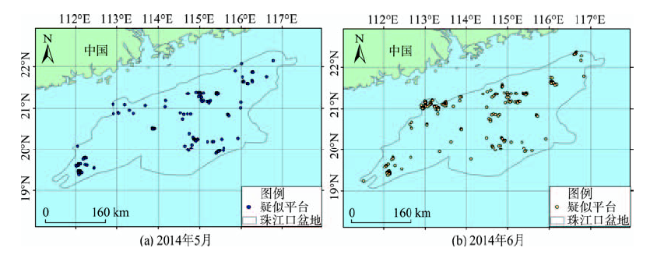
Fig. 7 Extraction results of suspected oil and gas platforms

图7 疑似油气平台提取结果

对2014年5月和2014年6月影像提取的疑似油气平台数据以500 m为阈值进行邻域分析,并对分析结果进行整理,共得到油气平台53座。为了验证实验精度,利用2014年5月2 m分辨率的GF-1影像对珠江口盆地进行油气平台的解译,共解译出油气平台48座,并以此作为标准油气平台数据,对VIIRS数据提取的结果进行验证。对比GF-1影像解译结果发现,在数量上,利用VIIRS数据提取的结果中,正确提取出41个,12个为提取错误的点,并且有7个没有提取出来,提取准确率(完整率=准确提取/标准数量)为85.4%;在空间分布上,VIIRS提取结果与GF-1提取结果在空间形态上基本吻合,VIIRS提取结果与GF-1提取结果如图8所示。
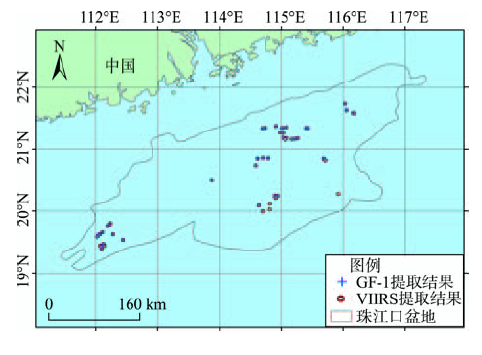
Fig. 8 Comparison of extraction results of VIIRS and GF-1

图8 VIIRS与GF-1提取结果对比图

4.2 讨论

通过上述实验结果可以发现,利用VIIRS数据可以有效地提取油气平台,但是提取结果中仍然存在一些漏提、错提的点。通过与标准数据的对比发现,在提取的53个油气平台中,准确提取的点为41个,12个为有问题的点,对有问题的点进行分析发现,出现这种问题的原因主要有以下3点:
(1)数据分辨率对实验结果的影响。VIIRS数据的空间分辨率为417 m,而油气平台的大小一般不会超过120 m,而卷积运算得到的像元群可能包含2~3个油气平台,因此对于距离特别近的平台,利用这种方法很容易将2个平台甚至3个平台提取为一个结果。如图9所示,从高分辨率影像上来看,2个油气平台的距离约为900 m,而在VIIRS影像上,2个油气平台分别位于2个连续的像元上(图中蓝色十字符号),因此提取结果中,误将2个油气平台提取成了一个平台(图中红色环状符号)。在没有提取到的7个油气平台中,6个油气平台均由于其距离附近的油气平台太近,错误的将2个油气平台按照1个来提取。
Fig. 9 Comparison of leakage point of VIIRS and GF-1

图9 漏提点VIIRS与GF-1影像对比

(2)船舶活动对实验结果的影响。本研究利用了2014年5月与6月的VIIRS数据,虽然6月为休渔期,但是仍有部分渔船活动,而且有5条二级海上航线经过珠江口盆地到达香港,有货船与商船活动,因此可能会在同一个地方检测到不同船只目标。另外,在钻井平台的附近,经常会出现油轮,而且有些油轮会在短时间内处于静止状态。如图10所示,分别为2014年5月和6月的月平均灯光数据,可以看出2个月在相同的位置,均出现了灯光,而2014年7月至12月,该位置均无灯光产生,利用2014年5月的GF-1号数据对该位置进行人工判读,并未发现任何疑似目标,因此可以判定该错误点由船舶活动引起。而在错误提取的12个点中,6个是由于这种原因造成的。
Fig. 10 Comparison of VIIRS images of error points

图10 错误点的VIIRS影像对比

(3)光晕对实验结果的影响。油气平台在遥感影像上呈现的亮像元主要包括井架照明灯光以及生产过程中废气燃烧产生的灯光。一般有废气燃烧的油气平台,有很大的光晕,并且在影像上往往有很高的辐射亮度值,一般可以达到1万w·cm-2·sr-1以上。而普通油气平台的辐射亮度值平均约为300 w·cm-2·sr-1。在油气平台提取过程中,对于灯光强度特别大的油气平台,月平均灯光数据很容易受光晕的叠加,从而将附近灯光特别弱的平台计算为亮度强平台的光晕。而卷积运算后,很容易将光晕局部亮点提取出来,这也是造成提取错误的主要原因。如图11所示,中心位置的油气平台有极大的辐射亮度值,在该平台的附近还有2个油气平台,而中心位置油气平台产生了很大的光晕,对该影像进行卷积运算以后可以看出,附近光晕的局部增强点也被提取出来,从而产生了多提取的点。在错误提取的12个点中,6个是由于这种原因造成的,1个未提取点也是这样引起的。
Fig. 11 Comparison of VIIRS images and the convolution operation results of the error points

图11 错误点的VIIRS影像及卷积运算结果对比

5 结论

利用VIIRS数据的DNB波段强的夜间灯光探测能力,以及油气平台相对静止的特性, 在前人研究的基础上,本文提出了一种卷积运算临界值法实现油气平台的提取,为油气平台的检测提供了一种新的手段,并以珠江口盆地为研究区,对该区域的油气平台进行了提取。研究表明,利用VIIRS数据进行油气平台的提取是可行的,相比雷达数据,VIIRS数据获取简单,处理难度小,提取过程简单。利用卷积运算的原理,将疑似目标与杂散光进行极端化处理,使其分界点更明确,最终利用自然值0作为疑似油气平台与背景杂散光的临界值,从一定程度上解决了由于经验阈值导致的主观随意性。但是该方法仍然存在一些不足。VIIRS数据的空间分辨率比较低,对于距离较近的油气平台,容易将灯光相对较弱的平台弱化,从而降低提取精度。因此,在后续的工作中,可利用多期数据进行油气平台的提取,将VIIRS数据与雷达数据进行融合,从而发挥数据本身的优势;可在研究过程中加入热红外波段,对海面上热源进行探测,从而达到提高精度的目的;也可进行多源数据的叠加实现大尺度下油气平台的提取。

The authors have declared that no competing interests exist.

[1]
陈洁,温宁,李学杰.南海油气资源潜力及勘探现状[J].地球物理学进展,2007,22(4):1285-1294.南海的油气资源极为丰富,享有“第二个波斯湾”的美誉.南海地貌类型多样,地形复杂,其战略位置极为重要,是东亚及相邻各国必经之路.资源之争,使得周边各国使出浑身解数,发展海洋经济与技术,1981年至2002年,越南就从南沙海域的油田中开采了1亿吨石油、15亿多立方米的天然气,获利250亿美元,南海石油已成为越南国民经济的第一大支柱产业.近半世纪中国南海油气勘探工作取得巨大的成就,发现了26个新生代盆地,取得了南海海域的基本石油地质成果,为南海的勘探开发奠定了基础.南海具有巨大的勘探空间及技术发展空间,每一次的技术进步,都会带来南海油气勘探的质的飞跃.

DOI

[ Chen J, Wen N, Li X J.The status of the resource potential and petroleum exploration of the South China Sea[J]. Progress in Geophysics, 2007,22(4):1285-1294. ]

[2]
Croft T A. Burning waste gas in oil fields[J]. Nature ,1973(245):375-376.I WAS recently amazed by some night-time spacecraft photographs, exemplified by Fig. 1, that present graphic evidence of waste and pollution. These were obtained by the United States Air Force DAPP system which has sensors in the visible 0.4 to 1.1 m band and an infrared imaging system in the 8 to 13 m band (ref. 1 and J. L. McLucas, personal communication). The visible band sensor is Capable of responding to very dim light with a controllable threshold (T. O. Haig, personal communication) and it provided these pictures. The lights of cities are clearly visible, as are the aurora, surface features illuminated by moonlight, and fires such as those caused by burning gas from oil fields and refineries. Much power is evidently being generated to light the cities of the world since at the inhabited areas are clearly outlined. It is also apparent that, in the process of extracting liquid petroleum from beneath the surface of the Earth, abundant gas supply has been discovered but is not used. Being unable to contain the gas or to transport it to a user, it is simply burnt.

DOI

[3]
Elvidge C D, Erwin E H, Baugh K E, et al.Satellite data estimate worldwide flared gas volumes[J]. Oil and Gas Journal, 2007,105(12):50-58.Satellite systems and online imaging systems can be used to detect gas flaring. The National Oceanic and Atmospheric Administration (NOAA) has developed procedures for independent estimation of flared gas volumes worldwide using satellite remote sensing. Gas flares can be found by zooming in on gas fields at a coarse spatial resolution of 1km2. The US Air Force's defense meteorological satellite program (DMSP) operational line-scan system (OLS) does this task just as easily. Global cloud imagery is collected by OLS with a pair of broad spectral bands placed in the visible and thermal ranges. Gas flares are distinguished from city lights at nighttime since they have specific characteristics. One is that gas flares are bright point sources of light with no shielding to the sky and tend to form circular lighting features with a bright center and wide rims. They also tend to be active for years and may exhibit color in color-composite images. The NOAA is basing its estimation of gas flaring volumes on sum of lights index and a set of reported gas flaring volumes for countries and individual flares. The sum of lights index values are the total of the digital number values extracted for the gas flares of a particular country.

[4]
Elvidge C D, Imhoff M L, Baugh K E, et al.Night-time lights of the world: 1994-1995. ISPRS Journal of Photogrammetry and Remote Sensing, 2001,56(2):81-99.The Defense Meteorological Satellite Program (DMSP) Operational Linescan System (OLS) has a unique low-light imaging capability developed for the detection of clouds using moonlight. In addition to moonlit clouds, the OLS also detects lights from human settlements, fires, gas flares, heavily lit fishing boats, lightning and the aurora. By analysing the location, frequency, and appearance of lights observed in an image time series, it is possible to distinguish four primary types of lights present at the earth's surface: human settlements, gas flares, fires, and fishing boats. We have produced a global map of the four types of light sources as observed during a 6-month time period in 1994-1995. We review a number of environmental applications that have been developed or proposed based on the night-time light data. We examine the relationship between area of lighting, population, economic activity, electric power consumption, and energy related carbon emissions for 200 nations, representing 99% of the world's population.

DOI

[5]
Elvidge C D, Ziskin D, Baugh K E, et al.A fifteen year record of global natural gas flaring derived from satellite data. Energies, 2009,2:595-622.We have produced annual estimates of national and global gas flaring and gas flaring efficiency from 1994 through 2008 using low light imaging data acquired by the Defense Meteorological Satellite Program (DMSP). Gas flaring is a widely used practice for the disposal of associated gas in oil production and processing facilities where there is insufficient infrastructure for utilization of the gas (primarily methane). Improved utilization of the gas is key to reducing global carbon emissions to the atmosphere. The DMSP estimates of flared gas volume are based on a calibration developed with a pooled set of reported national gas flaring volumes and data from individual flares. Flaring efficiency was calculated as the volume of flared gas per barrel of crude oil produced. Global gas flaring has remained largely stable over the past fifteen years, in the range of 140 to 170 billion cubic meters (BCM). Global flaring efficiency was in the seven to eight cubic meters per barrel from 1994 to 2005 and declined to 5.6 m3 per barrel by 2008. The 2008 gas flaring estimate of 139 BCM represents 21% of the natural gas consumption of the USA with a potential retail market value of $68 billion. The 2008 flaring added more than 278 million metric tons of carbon dioxide equivalent (CO2e) into the atmosphere. The DMSP estimated gas flaring volumes indicate that global gas flaring has declined by 19% since 2005, led by gas flaring reductions in Russia and Nigeria, the two countries with the highest gas flaring levels. The flaring efficiency of both Russia and Nigeria improved from 2005 to 2008, suggesting that the reductions in gas flaring are likely the result of either improved utilization of the gas, reinjection, or direct venting of gas into the atmosphere, although the effect of uncertainties in the satellite data cannot be ruled out. It is anticipated that the capability to estimate gas flaring volumes based on satellite data will spur improved utilization of gas that was simply burnt as waste in previous years.

DOI

[6]
Elvidge C D, Zhizhin M, Hsu F C, et al.VIIRS Nightfire: Satellite Pyrometry at Night[J]. Remote Sensing, 2013,5:4423-4449.The Nightfire algorithm detects and characterizes sub-pixel hot sources using multispectral data collected globally, each night, by the Suomi National Polar Partnership (NPP) Visible Infrared Imaging Radiometer Suite (VIIRS). The spectral bands utilized span visible, near-infrared (NIR), short-wave infrared (SWIR), and mid-wave infrared (MWIR). The primary detection band is in the SWIR, centered at 1.6 m. Without solar input, the SWIR spectral band records sensor noise, punctuated by high radiant emissions associated with gas flares, biomass burning, volcanoes, and industrial sites such as steel mills. Planck curve fitting of the hot source radiances yields temperature (K) and emission scaling factor (ESF). Additional calculations are done to estimate source size (m2), radiant heat intensity (W/m2), and radiant heat (MW). Use of the sensor noise limited M7, M8, and M10 spectral bands at night reduce scene background effects, which are widely reported for fire algorithms based on MWIR and long-wave infrared. High atmospheric transmissivity in the M10 spectral band reduces atmospheric effects on temperature and radiant heat retrievals. Nightfire retrieved temperature estimates for sub-pixel hot sources ranging from 600 to 6,000 K. An intercomparison study of biomass burning in Sumatra from June 2013 found Nightfire radiant heat (MW) to be highly correlated to Moderate Resolution Imaging Spectrometer (MODIS) Fire Radiative Power (MW).

DOI

[7]
苏伟光. 多源卫星数据遥感海面溢油检测研究[D].北京:中国科学院烟台海岸带研究所,2014:113-118.

[ Su W G.Oil spill in marine detection base on multi-source remote sensing satellite[D]. Beijing: Yantai Institute of Coastal Zone Research Chinese Academy of Sciences, 2014:113-118. ]

[8]
Casadio S, Arino O.ATSRWFA new algorithms for hot spot detection[C]. Proceedings of 2nd MERIS-AATSR workshop, September, 2008:22-26.

[9]
Casadio S, Arino O.A new algorithm for the ATSR World Fire Atlas[C]. Proceedings EARSEL 2009 Symposium, 2009.

[10]
Casadio S, Arino O, Serpe D.Gas flaring monitoring from space using the ATSR instrument series[J]. Remote Sensing of Environment, 2012,116: 239-249.Gas flaring flames are characterised by high temperatures and ATSR instruments are equipped with the appropriate spectral bands to detect them. In order to monitor gas flaring on global scale a new active flame detection scheme from satellite night-time Short Wavelength Infra Red measurements (SWIR, 1.6 m) has been developed and tested using the Along Track Scanning Radiometer (ATSR) family measurements. The new algorithm, called ALGO3, is based on the verified assumption that, at SWIR wavelengths, the background contribution to the night-time total radiation measured by ATSR is negligible, while that emitted by active flames is fully detectable. ALGO3 products are suitable for detecting gas flares, due to their peculiar high temperature/small area flames. Flaring sites have been discriminated according to time persistency criteria, i.e. location for which hot spots are found at frequencies higher than 4 times a year are assumed to be industrial settlements. Continuity and consistency between the ATSR missions has been verified, and results relative to 1991鈥2009 time window are reported. Validation of flaring site discrimination has been performed by visual inspection of high resolution Earth surface images. The comparison of ALGO3 retrievals with light count data from the Defense Meteorological Satellite Program (DMSP) Operational Linescan System (OLS) show very good agreement.

DOI

[11]
Casadio S, Arino O, Minchella A.Use of ATSR and SAR measurements for the monitoring and characterisation of night-time gas flaring from off-shore platforms: The North Sea test case[J]. Remote Sensing of Environment, 2012,123:175-186.A method for the monitoring of night-time gas flaring of off-shore oil/gas extraction platforms using measurements of the Along Track Scanning Radiometer (ATSR) and the Synthetic Aperture Radar (SAR) is presented and discussed in detail. The positions of off-shore extraction sites are accurately estimated by using SAR data, while the flaring activity is estimated from night-time shortwave infrared (SWIR) radiance measured by ATSR. The North Sea area has been selected as test case and related flaring activity from 1991 to 2010 has been analysed at single site and at North Sea area scales. Results indicate a decline in the overall flaring activity during the time period considered in this work, although single sites can show positive flaring trends. The ATSR derived flaring time series has been compared to the crude oil production data provided by the US Energy Information Administration (EIA), showing very good agreement in terms of trend and seasonal behaviour. We present a simple inversion scheme aimed at the evaluation of the flame parameters (temperature and size) from night-time shortwave, middle and thermal infrared ATSR measurements, and results are discussed in detail. Finally, the possibility to estimate flaring efficiency from satellite measurements and from detailed technical information on flaring devices is envisaged. The proposed approach can be easily extended to other areas in which gas flaring from off-shore oil and gas extraction are an important economic and environmental factor.

DOI

[12]
王加胜,刘永学,李满春,等.基于ENVISAT ASAR的海洋钻井平台遥感检测方法——以越南东南海域为例[J].地理研究,2013, 32(11):2143-2152.海洋钻井平台的位置信息对溢油监测和航道安全有重要意义。针对目前海洋钻井平台遥感信息提取难、验证难的现状,根据海洋钻井平台位置基本保持不变的特性,本文提出了一种基于恒虚警率算法的海洋钻井平台提取方法。该方法包括三个主要步骤:首先利用GDEM数据制作陆地掩膜,然后基于双参数恒虚警率算法对两景成像时间靠近的ENVISATASAR影像进行海上目标提取,最后对两时期提取结果进行对比,去除舰船虚警目标,完成海洋钻井平台提取。研究以越南东南海域为实验区,对提出的方法进行实验,结果表明,该方法可以较为有效的确定钻井平台目标。在实验区内,共提取钻井平台30个,主要分布在越南石油招标区块09.1的白虎油田和龙油田。

DOI

[ Wang J S, Liu Y X, Li M C, et al.Drilling platform detection based on ENVISAT ASAR remote sensing data: A case of southeastern Vietnam offshore area. Geographical Research[J]. Geographical Research, 2013,32(11):2143-2152. ]

[13]
孟若琳,邢前国.基于可见光的海上船舶油井平台遥感检测[J].计算机应用,2013,33(3):708-711.针对目前海上船舶油井提取多是使用已有的非实时陆地岸线提取海域,并且提取算法缺少在大尺度影像上搜索和查找可能存在目标能力的问题,提出一种基于可见光遥感数据的船舶油井检测策略。该策略主要包括综合形态学运算提取海域、目标有无判定算法、迭代最优阈值分割(TS)滑动窗口(SW)目标提取三个部分。探讨了目标有无判定算法中的参数设置和滑动窗口的大小设置,并将提取结果与人工目视解译结果进行了交叉对比验证。结果表明,该策略通过设置合理的参数,可使目标提取的真实精度达到0.981,相对精度达到0.954,表现出较高的实用性。

DOI

[ Meng R L, Xing Q G.Detection of offshore ship and well platform based on optical remote sensing images[J]. Journal of Computer Applications, 2013,33(3):708-711. ]

[14]
万剑华,姚盼盼,孟俊敏,等. 基于SAR影像的海上石油平台识别方法研究[J].测绘通报,2014(1):56-59.近年来我国南海油气资源遭到周 边国家的掠夺,进行非法海上石油平台的识别对于维护海洋权益是非常有意义的。对海上石油平台的识别,传统的基于岸基和岛屿站的观测方法范围非常有限。本文 结合星载SAR全天时、全天候及免受云雾干扰的优势,尝试了一种基于SAR影像识别海上石油平台的方法。利用多景多时相SAR影像,首先在 TerraSAR-X影像中做平台目标的初步识别;然后利用另一景不同时相的RADARSAT-2 SAR影像作对比,进行舰船目标的排除和初步识别结果的检验。以南海地区的3景SAR影像为数据源,共识别出5处石油平台,验证了通过SAR影像识别海上 石油平台的可行性。

DOI

[ Wan J H, Yao P P, Meng J M, et al.Research on detection method of the offshore oil platform based on SAR images[J]. Bulletin of Surveying and Mapping, 2014,1:56-59. ]

[15]
Waluda C M, Griffiths H J, Rodhouse P G.Remotely sensed spatial dynamics of the Illex argentinus fishery, Southwest Atlantic[J]. Fisheries Research, 2008,91(2):196-202.Illex argentinus, the Argentine short-finned squid, is an important species within the Patagonian shelf ecosystem, where it supports a major multi-national fishery. The fishing fleet operating in this region is comprised of jigging vessels which attract squid using powerful incandescent lights. These fishing lights are detectable in remotely sensed satellite imagery which makes the fishery unusually amenable to a large-scale analysis of its spatial dynamics. In this paper, long-term inter-annual variability in fleet distribution and extent is examined using imagery from the Defence Meteorological Satellite Program-Operational Linescan System (DMSP-OLS) for the period 1993–2005. The fishery was found to occupy a wide area across the shelf and slope, with regions of consistent fishing activity observed on the high seas (45–47°S) and to the north of the Falkland Islands (Malvinas). Distribution of the fishery over the 13-year study period was variable, with 28% of the fished area occupied in 1–2 years, and 7% of the area occupied in 12–13 years. Annual catch levels were positively associated with the extent of the area occupied by the fleet. Higher catches corresponded to the fishery occupying a wide latitudinal range, whereas lower catches were observed during 2004 and 2005 corresponding to a contraction of the fishery away from the south of its range. In years of very high catches, fishing took place along almost the entire latitudinal range of the species. Due to the intensity of fishing, changes in the distribution of the fleet can reflect shifts in the distribution of I. argentinus; this has potential for the long-term monitoring of this highly variable squid fishery.

DOI

[16]
舒松,余柏蒗,吴健平,等.基于夜间灯光数据的城市建成区提取方法评价与应用[J].遥感技术与应用,2011,26(2):169-176.DMSP/OIS夜间灯光数据已被广泛应用于城市建成区的提取.目前主要存在4类提取方法:经验阈值法、突变检测法、统计数据法和较高分辨率影像数据空间比较法.以上海为例,在2000年、2003年、2006年夜间灯光数据的基础上,利用4种方法完成了城市建成区的提取.通过对不同年份数据提取结果的比较,证明了相同的灰度分割阈值对不同年份的夜间灯光数据中不存在通用性;在对2003年夜间灯光数据的提取中,4类方法所得结果精确度从高到低依次为统计数据法、突变检测法、经验阈值法和较高分辨率影像数据空间比较法,相对误差分别为1.3%、2.1%、5.1%和11.2%,在对4种方法的便捷性和可实现性进行分析与评价后,使用突变检测法完成了上海市2000~2006年城市建成区的提取.

[ Shu S, Yu B L, Wu J P, et al.Methods for deriving urban built-up area using night-light data: Assessment and application[J]. Remote Sensing Technology and Application, 2011,26(2):169-176. ]

[17]
戴春山. 中国海域含油气盆地群和早期评价技术[M].北京:海洋出版社,2011:298-303.

[ Dai C S.Oil Gas Basin group of China seas and early resource assessment techniques[M]. Beijing: China Ocean Press, 2011:298-303. ]

[18]
高祥伟,费鲜芸,张志国,等.基于卷积运算的城市公园绿地聚类度评价[J].生态学报,2014,34(15):4446-4453.为使公园绿地聚集度计算能够充分反映其辐射效应,提出基于卷积运算的局部网格单元和整个城市公园绿地聚集度评价方法。基于高分辨率遥感影像获取山东省37个主要园林城市公园绿地分布图,利用gis技术,采用500m网格将城区网格化;建立3×;3绿地聚集度卷积模板,基于卷积运算计算城市网格单元公园绿地聚集度;选择评价因子,依据37个城区公园绿地网格单元聚集度分布现状确定其分级值,建立整个城市公园绿地聚集度评价模型,并对东营市和泰安市进行实例评价。研究结果显示:基于卷积运算的网格单元公园绿地聚集度计算方法能够有效量化相邻网格单元绿地的辐射效应,计算由网格内部及相邻区域绿地共同作用产生的绿地聚集度,其取值范围为0-4;整个城市公园绿地聚集度分为1级(极弱)、2级(弱)、3级(中等)、4级(强)、5级(极强)共5个等级,评价结果与研究区37个城市绿地现状相对应。实例评价结果显示,东营市网格单元公园绿地聚集度主要分布在>0-0.2之间,整个城市公园绿地聚集度为2级;泰安市网格单元公园绿地聚集度以0为主,整个城市公园绿地聚集度为5级。

DOI

[Gao X W, Fei X Y, Zhang Z G, et al.The aggregation degree evaluation of urban park green space based on convolution method[J]. ACTA ECOLOGICA SINICA, 2014,34(15):4446-4453. ]

文章导航

/