
海上丝绸之路起点——泉州港岸线变化的遥感动态研究
作者简介:施婷婷(1993-),女,福建平潭人,博士生,主要从事环境资源遥感应用研究。E-mail:shitingting93@163.com
收稿日期: 2016-09-12
要求修回日期: 2016-10-14
网络出版日期: 2017-03-20
基金资助
国家科技支撑项目(2013BAC08B01-05)
福建省教育厅重点项目(JA13030)
国家自然科学基金项目(41501469)
Remote Sensing Study of Coastline Dynamics of Quanzhou Port:Starting Point of the Ancient Maritime Silk Road
Received date: 2016-09-12
Request revised date: 2016-10-14
Online published: 2017-03-20
Copyright
泉州港作为古代海上丝绸之路的起点,今天又成为21世纪“一带一路”的新起点。本文以泉州港1990-2014年共6期的Landsat TM/OLI遥感影像为数据源,综合应用遥感和GIS技术提取了泉州港的海岸线及海域变化信息,从海岸线的长度、变化速率、分形维数、海域变化面积和海域利用类型5个方面进行海岸线变化及其驱动力分析。研究表明:近24年来,泉州港海岸线长度增加了37.78 km,海岸线的形状总体稳定,但在局部有明显变化。海岸线变化导致的海域变化面积为68.02 km2,其中,建设用地(城市和港口建设)占用的比例最大,围海养殖也是一个重要的利用类型。但泉州港围填海新增面积的利用率不高,超过一半的围填海面积尚未被合理地开发利用。总的来看,新城区建设、临港工业产业兴起和农渔业发展导致了泉州港海岸线的变化。
施婷婷 , 徐涵秋 , 王帅 , 方灿莹 , 林中立 , 王美雅 , 唐菲 . 海上丝绸之路起点——泉州港岸线变化的遥感动态研究[J]. 地球信息科学学报, 2017 , 19(3) : 407 -416 . DOI: 10.3724/SP.J.1047.2017.00407
As the starting point of China’s ancient Maritime Silk Road, Quanzhou Port has become a new starting point of “One Belt and One Road” in the 21st century. Quanzhou Port has a winding coastline running northward from Weitou Bay to Meizhou Bay. This paper studied the coastline dynamics of Quanzhou Port during 1990 to 2014. A total of six scenes of Landsat TM/OLI (1990, 1994, 2000, 1994, 2009 and 2014) were utilized for this study. The modified normalized difference water index (MNDWI) was used to enhance water information of the remote sensing images. The enhanced water images were then used to extract the coastlines from the images by setting a threshold. The extracted coastlines were later vectorized and integrated in ArcGIS to analyze their dynamics. The study of the coastline change in Quanhou Port was based on five aspects: coastline length, length changing rate, coastline fractal dimension, changed sea areas, and the use type of changed sea areas. Results showed that the coastline lengths of Quanzhou Port increased continually in the 24-study years, which was 418.19 km in 1990 and 455.97 km in 2014, an increase of 37.78 km during the period. The coastline shape of Quanzhou Port was generally stable. Nevertheless, intensive coastline changes do occur in some areas due to tide-land reclamation. This has locally led to the seaward advance of the shoreline and the simplification of the shoreline from winding to straight. The related sea area change due to the coastline modification was 68.02 km2, of which built-up land and port land occupied the largest proportion. However, the reclamation area is not highly used and more than half of the reclamation area has not yet been developed. This remote sensing based study has detected four large reclamation areas, which are located in Nanpu of western Meizhou Bay (7.33 km2 in area), Dongqiao of southwestern Meizhou Bay (34.85 km2 in area), western entrance of Quanzhou Bay (4.88 km2 in area), and eastern Jinjiang coast (5.17 km2 in area). Among them, only eastern Jinjiang coast is an enclosed tideland reclaimed for agriculture and fishery, whereas the other three are mainly the lands reclaimed for built-up land and port land. For example, the landfill in the western entrance of Quanzhou Bay is now the seat of Quanzhou Government. On the whole, the new town construction, nearshore industrial and agricultural fishery development led to the coastline changes of Quanzhou Port.
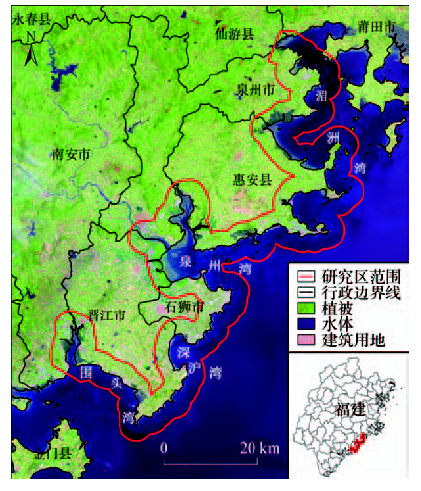
Fig. 1 Location of Quanzhou Port图1 泉州港地理区位示意图 |
Tab. 1 Parameters of six used remote sensing scenes表1 6个时相卫星遥感数据参数 |
| 序号 | 卫星 | 传感器 | 空间分辨率/m | 成像日期 | 农历 | 成像时间(UTC+8) | 潮汐位 |
|---|---|---|---|---|---|---|---|
| 1 | Landsat 5 | TM | 30 | 1990-07-20 | 闰五月二十八 | 09:53 | 高潮位 |
| 2 | Landsat 5 | TM | 30 | 1994-05-12 | 四月初二 | 09:52 | 中高潮位 |
| 3 | Landsat 5 | TM | 30 | 2000-06-29 | 五月二十八 | 10:09 | 高潮位 |
| 4 | Landsat 5 | TM | 30 | 2006-09-18 | 闰七月二十六 | 10:27 | 中高潮位 |
| 5 | Landsat 5 | TM | 30 | 2009-06-06 | 五月十四 | 10:21 | 高潮位 |
| 6 | Landsat 8 | OLI | 30 | 2014-09-08 | 八月十五 | 10:33 | 高潮位 |
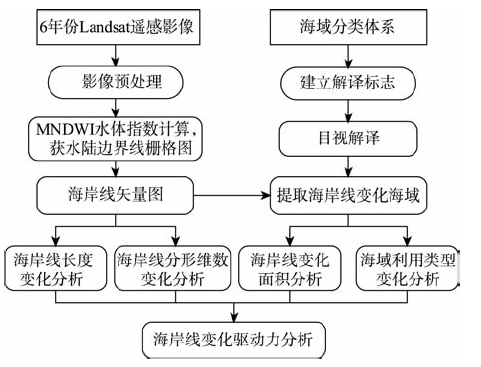
Fig. 2 Flowchart of the study techniques图2 研究技术路线图 |
Tab. 2 Classification scheme of the sea area表2 海域分类体系 |
| 因素(用海方式) | 类型 | 定义 | |
|---|---|---|---|
| 自然 | 淤积 | 指河流入海携带的泥沙在入海口周边沉积形成淤积 | |
| 蚀退 | 指海岸地带在风浪、沿岸海流、潮汐等作用影响下,岸线逐渐蚀退 | ||
| 人为 | 填海 | 建设用地 | 用于城镇居住、工业与交通等的填海 |
| 农业用地 | 用于农、林、牧业生产的填海 | ||
| 港口用地 | 用于港口码头、港池、堤坝等所使用的填海 | ||
| 未利用地 | 主要指已填充或正在填充但未开发利用的填海 | ||
| 围海 | 围海养殖 | 用于渔业养殖或渔业基础设施的围海 | |
| 待利用水面 | 主要指已筑堤和正在筑堤的尚未利用的围海区域 | ||
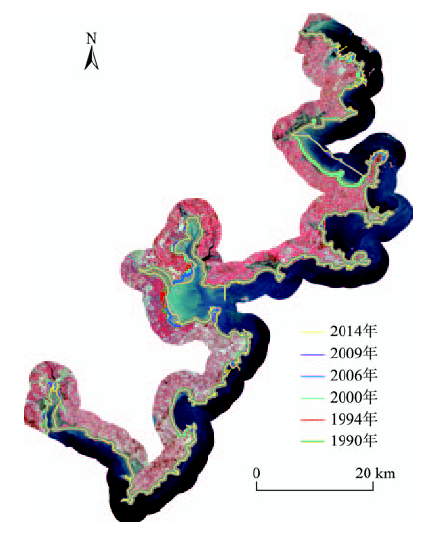
Fig. 3 Extracted coastlines of QuanzhouPort from 1990 to 2014图3 1990-2014年泉州港海岸线提取结果 |
Tab. 3 The lengths and fractal dimensions of coastlines of Quanzhou Port in each study year表3 1990-2014年泉州港海岸线长度及分形维数 |
| 1990年 | 1994年 | 2000年 | 2006年 | 2009年 | 2014年 | |
|---|---|---|---|---|---|---|
| 海岸线长度/km | 418.19 | 424.87 | 429.25 | 432.00 | 445.17 | 455.97 |
| 分形维数 | 1.1481 | 1.1481 | 1.1498 | 1.1497 | 1.1553 | 1.1593 |
| R2 | 0.9974 | 0.9976 | 0.9976 | 0.9977 | 0.9977 | 0.9978 |
注:网格数目N的对数与网格长度r(N) 的对数的拟合系数R2越接近1,表明分形维数值越精确 |
Tab. 4 The changing rate of coastline lengths and sea areas of Quanzhou Port in various periods表4 不同时期泉州港海岸线长度变化速率及海域变化面积 |
| 1990-1994年 | 1994-2000年 | 2000-2006年 | 2006-2009年 | 2009-2014年 | 1990-2014年 | |
|---|---|---|---|---|---|---|
| 变化速率/(km/a) | 1.67 | 0.73 | 0.46 | 4.39 | 2.16 | 1.57 |
| 变化面积/km2 | 3.43 | 4.45 | 44.79 | 9.97 | 8.44 | 68.02 |
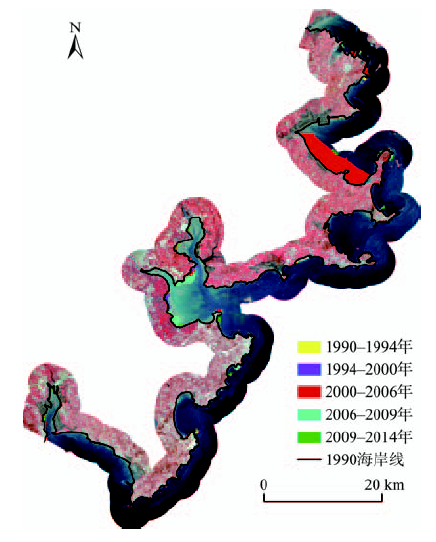
Fig. 4 Sea area changes in Quanzhou Port from 1990 to 2014图4 1990-2014年各时期泉州港海域变化面积图 |
Tab. 5 Statistics of the use types of sea area in each study sub-period表5 各时期各利用类型面积及所占比例 |
| 利用类型 | 1990-1994年 | 1994-2000年 | 2000-2006年 | 2006-2009年 | 2009-2014年 | 1990-2014年 | ||||||
|---|---|---|---|---|---|---|---|---|---|---|---|---|
| 面积/km2 | 比例/% | 面积/km2 | 比例/% | 面积/km2 | 比例/% | 面积/km2 | 比例/% | 面积/km2 | 比例/% | 面积/km2 | 比例/% | |
| 淤积 | 1.65 | 48.25 | 0.18 | 2.64 | 0.27 | 0.61 | 0.20 | 1.75 | 0.02 | 0.08 | 0.25 | 0.36 |
| 蚀退 | 0.08 | 2.34 | 1.52 | 22.56 | 0.33 | 0.74 | 0.51 | 4.37 | 0.37 | 1.97 | 1.51 | 2.23 |
| 建设用地 | 0.42 | 12.28 | 0.43 | 6.35 | 2.96 | 6.56 | 6.68 | 57.39 | 9.38 | 49.37 | 20.94 | 30.78 |
| 农业用地 | 0.47 | 13.74 | 1.12 | 16.71 | 1.06 | 2.35 | 0.31 | 2.64 | 0.00 | 0.00 | 1.34 | 1.97 |
| 港口用地 | 0.08 | 2.34 | 0.61 | 9.06 | 0.86 | 1.91 | 0.71 | 6.14 | 0.85 | 4.45 | 3.89 | 5.72 |
| 未利用地 | 0.07 | 2.05 | 0.09 | 1.27 | 2.03 | 4.51 | 2.82 | 24.19 | 6.81 | 35.82 | 7.30 | 10.74 |
| 围海养殖 | 0.37 | 10.82 | 2.43 | 36.20 | 1.60 | 3.56 | 0.00 | 0.00 | 0.72 | 3.79 | 4.00 | 5.88 |
| 待利用水面 | 0.28 | 8.19 | 0.35 | 5.21 | 35.95 | 79.76 | 0.41 | 3.53 | 0.86 | 4.52 | 28.79 | 42.32 |
| 总计 | 3.43 | 100 | 6.72 | 100 | 45.08 | 100 | 11.64 | 100 | 19.01 | 100 | 68.02 | 100 |
注:除蚀退表示海域面积增加外,其它利用类型均表示海域面积减少 |
Fig. 5 Four typical coastline change areas图5 4个典型的海岸线变化区 |
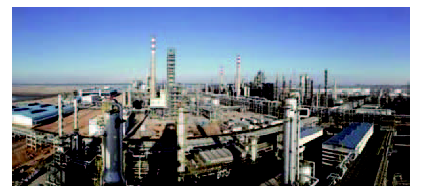
Fig. 6 Quanhui petrochemical industrial zone图6 泉惠石化工业区 |
The authors have declared that no competing interests exist.
| [1] |
国家发展改革委,外交部,商务部.推动共建丝绸之路经济带和21世纪海上丝绸之路的愿景与行动[Z].2015.
[National Development and Reform Commission, Ministry of Foreign Affairs, Ministry of Commerce of the People's Republic of China. Vision and actions on jointly Building Silk Road Economic Belt and 21st-Century Maritime Silk Road[Z]. 2015.]
|
| [2] |
泉州市统计局. 泉州统计年鉴2015[EB/OL]. (2015-9-30) [2016-10-13].
[Quanzhou Municipal Bureau of Statistics. Quanzhou statistical yearbook (2015) [EB/OL]. (2015-9-30) [2016-10-13]. ]
|
| [3] |
[
|
| [4] |
[
|
| [5] |
|
| [6] |
|
| [7] |
|
| [8] |
|
| [9] |
|
| [10] |
[
|
| [11] |
|
| [12] |
[
|
| [13] |
|
| [14] |
|
| [15] |
[
|
| [16] |
[
|
| [17] |
|
| [18] |
|
| [19] |
[
|
| [20] |
[
|
| [21] |
|
| [22] |
|
| [23] |
[
|
| [24] |
|
| [25] |
|
| [26] |
[
|
| [27] |
|
| [28] |
|
| [29] |
[
|
| [30] |
|
| [31] |
|
| [32] |
[
|
| [33] |
国家海洋局. HY/T 123-2009 海域使用分类[S].北京:标准出版社,2009.
[ State Oceanic Administration People's Republic of China HY/T 123-2009 Sea area use classification[S] HY/T 123-2009 Sea area use classification[S]. Beijing: Standards Press of China, 2009. ]
|
/
| 〈 |
|
〉 |
