
一种面向栅格的空间-属性双重约束聚类方法
作者简介:刘敬一(1992-),女,硕士生,研究方向为海洋时空聚类方法。E-mail:jingyiliu24@163.com
收稿日期: 2016-07-12
要求修回日期: 2016-11-02
网络出版日期: 2017-04-20
基金资助
国家自然科学基金项目(41371385、41401439、41671401)
中国科学院青年促进会项目(2013113)
海洋动力遥感与声学重点实验室开放基金项目(KHYS1402)
A Raster-Oriented Clustering Method with Space-Attribute Constraints
Received date: 2016-07-12
Request revised date: 2016-11-02
Online published: 2017-04-20
Copyright
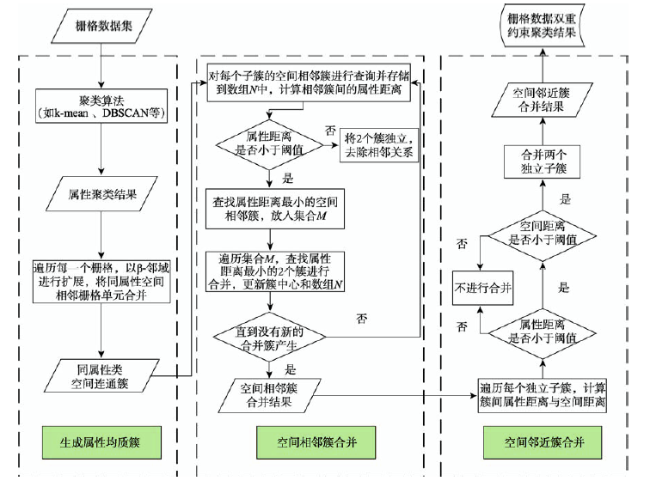
针对栅格数据,传统聚类方法大都基于专题属性进行聚类,分裂了栅格对象的空间特性与专题属性,而兼顾空间与专题属性的现有空间聚类方法又存在算法复杂、参数设置多等问题,因此本文提出了一种面向栅格的空间-属性双重约束聚类算法(A Raster-oriented Clustering Method with Space-Attribute Constraints, RoCMSAC)。RoCMSAC利用栅格数据空间邻域和空间连通特性,重新定义栅格簇的相似性度量准则,通过属性均质簇生成,空间相邻栅格簇合并和空间邻近栅格簇合并3个步骤对栅格数据进行空间-属性双重约束聚类。利用太平洋海域海表温度栅格数据对算法的可行性以及有效性进行验证,并与现有算法进行对比分析。通过实例验证与对比发现:① RoCMSAC方法能够保证栅格簇空间域的邻近性和属性域的均质性;② RoCMSAC方法可发现复杂形状的栅格簇,且算法时间复杂度低,需输入参数较少。
刘敬一 , 薛存金 , 樊彦国 , 孔凡萍 , 何亚文 . 一种面向栅格的空间-属性双重约束聚类方法[J]. 地球信息科学学报, 2017 , 19(4) : 447 -456 . DOI: 10.3724/SP.J.1047.2017.0447
For dealing with the raster datasets, most of the traditional clustering methods are based on the thematic attribute, which separate the integrities of spatial and thematic characteristics. However, the current clustering methods considering both spatial and thematic characteristics still have great problems such as complicated clusters, computational complexities and many input parameters, etc. Thus, this paper presents a Raster-oriented Clustering Method with Space-Attribute Constraints, named RoCMSAC. The core idea of RoCMSAC uses the spatial contiguities and the connectivity of raster datasets to redefine the similarity measure criterion. The RoCMSAC consists of three steps, i.e. the cluster generation with the homogeneous attributes, the cluster merging with the spatial contiguities and the cluster merging with the spatial vicinities. Finally, the feasibility and effectiveness of the algorithm are validated with the datasets of sea surface temperature in Pacific Ocean. The clusters from RoCMSAC are compared with those from K-Mean and DDBSC. The results show that: (1) RoCMSAC can detect any grid cluster with the complicated shape, which needs less time and fewer input parameters; (2) The clusters from RoCMSAC obtain both the proximity in spatial domain and the homogeneity in attribute one.
Key words: raster data; data mining; spatial clustering; dual constraints; Pacific Ocean
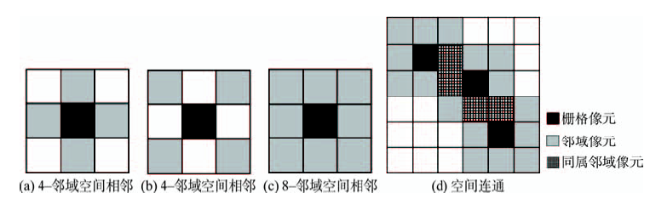
Fig. 1 Spatial adjacency and connectivity of pixels图1 栅格像元空间相邻与空间连通示意图 |
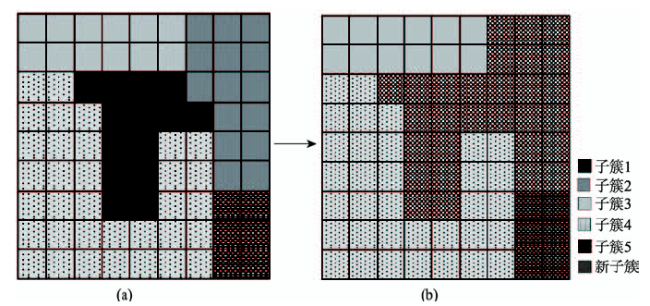
Fig. 2 Spatial adjacency of clusters图2 栅格簇空间相邻示意图 注:图(a)表示在合并前子簇1与子簇2、3、4空间相邻;图(b)表示子簇1与子簇3满足条件合并后新子簇与子簇2、4、5空间相邻 |
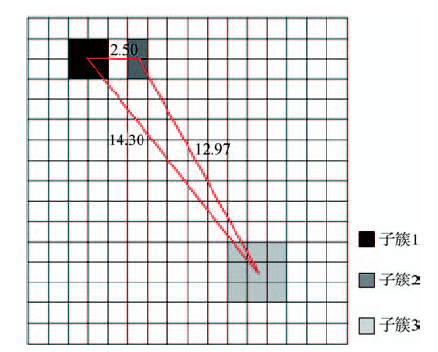
Fig. 3 Spatial vicinity of grid clusters图3 栅格簇空间邻近示意图 注:子簇1、2、3均为独立簇且属性距离在阈值内,若空间阈值=5,则有子簇1和子簇2为空间邻近,记子簇1➝子簇2 |
Fig. 4 The algorithm flow chart of RoCMSAC图4 RoCMSAC算法流程 |
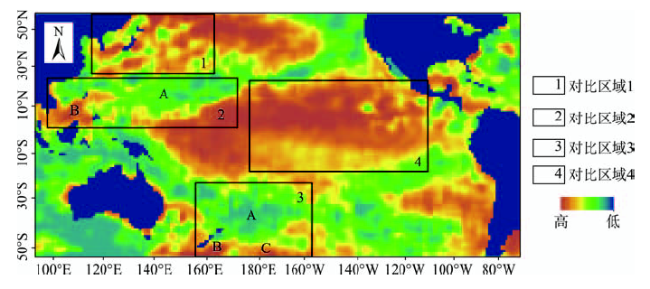
Fig. 5 The monthly anomaly of SST in test area图5 试验区域SST月均距平结果 注:图中标定的区域1、2、3、4是算法验证选定的对比区域 |
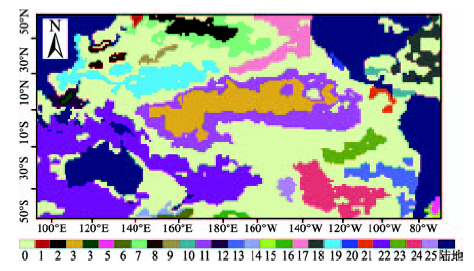
Fig. 6 Clustering results of RoCMSAC图6 RoCMSAC方法聚类结果 |
Tab. 1 The mean and standard deviation of clusters of RoCMSAC表1 RoCMSAC方法聚簇均值与标准差统计表 |
| 均值/℃ | 标准差 | 簇号 | 均值/℃ | 标准差 | |
|---|---|---|---|---|---|
| 1 | 2.15 | 0.482 | 14 | 0.78 | 0.226 |
| 2 | 1.74 | 0.325 | 15 | 0.94 | 0.216 |
| 3 | 1.72 | 0.313 | 16 | 0.77 | 0.215 |
| 4 | 1.46 | 0.166 | 17 | -1.10 | 0.279 |
| 5 | 1.78 | 0.281 | 18 | -1.11 | 0.339 |
| 6 | 1.79 | 0.293 | 19 | -1.03 | 0.247 |
| 7 | 0.83 | 0.212 | 20 | -1.12 | 0.342 |
| 8 | 0.84 | 0.219 | 21 | -1.36 | 0.449 |
| 9 | 0.68 | 0.133 | 22 | -0.88 | 0.125 |
| 10 | 0.81 | 0.164 | 23 | -1.04 | 0.271 |
| 11 | 0.88 | 0.215 | 24 | -0.99 | 0.250 |
| 12 | 0.85 | 0.213 | 25 | -1.01 | 0.155 |
| 13 | 0.77 | 0.183 |
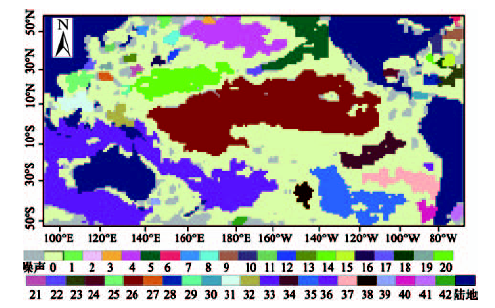
Fig. 7 Clustering results of k-mean with weighted distance图7 加权复合距离K-均值聚类结果 |
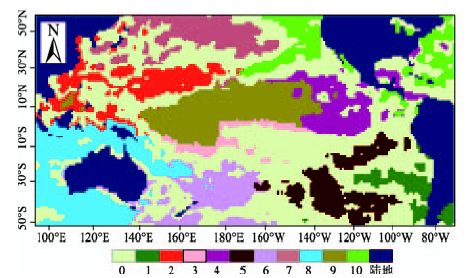
Fig. 8 Clustering results of DDBSC图8 DDBSC方法聚类结果 |
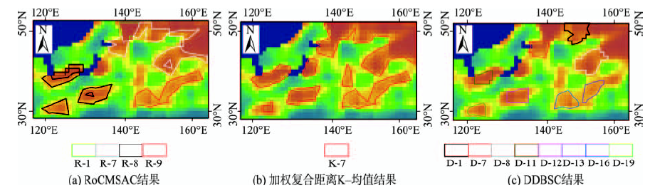
Fig. 9 Comparisons of region 1图9 区域1对比分析结果 |
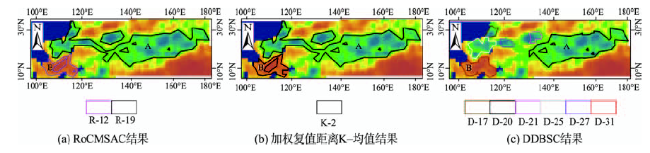
Fig. 10 Comparison results of region 2图10 区域2对比分析结果 |
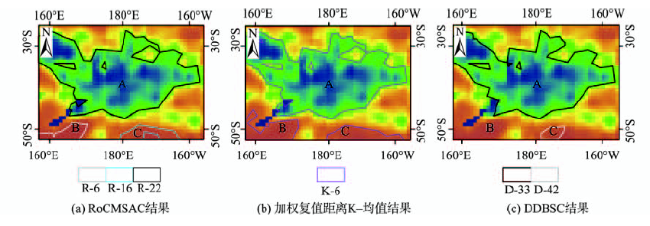
Fig. 11 Comparison results of region 3图11 区域3对比分析结果 |
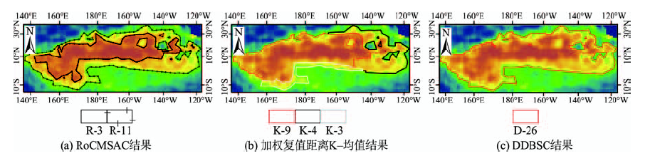
Fig. 12 Comparison results of region 3图12 区域4对比分析结果 |
Tab. 2 The mean and standard deviation of clusters in region 1表2 区域1各簇均值与标准差统计表 |
| RoCMSAC | 加权复合距离K-均值 | DDBSC | ||||||
|---|---|---|---|---|---|---|---|---|
| 簇号 | 均值/℃ | 标准差 | 簇号 | 均值/℃ | 标准差 | 簇号 | 均值/℃ | 标准差 |
| R-7 | 0.83 | 0.211 | K-7 | 1.34 | 0.485 | D-1 | 0.81 | 0.135 |
| D-7 | 0.80 | 0.121 | ||||||
| D-8 | 0.84 | 0.108 | ||||||
| R-8 | 0.84 | 0.219 | D-11 | 0.83 | 0.188 | |||
| D-12 | 0.85 | 0.165 | ||||||
| D-19 | 0.84 | 0.122 | ||||||
| R-9 | 0.61 | 0.133 | D-13 | 0.66 | 0.101 | |||
| D-16 | 0.67 | 0.082 | ||||||
| R-1 | 2.15 | 0.386 | 噪 声 | |||||
Tab. 3 The mean and standard deviation of clusters in region 2表3 区域2各簇均值与标准差统计表 |
| 区域 | RoCMSAC | 加权复合距离K-均值 | DDBSC | ||||||
|---|---|---|---|---|---|---|---|---|---|
| 簇号 | 均值/℃ | 标准差 | 簇号 | 均值/℃ | 标准差 | 簇号 | 均值/℃ | 标准差 | |
| A | R-19 | -1.04 | 0.271 | K-2 | -0.80 | 0.633 | D-20 | -1.16 | 0.223 |
| B | R-12 | 0.78 | 0.215 | D-31 | 0.95 | 0.184 | |||
Tab. 4 The mean and standard deviation of clusters in region 3表4 区域3各簇均值与标准差统计表 |
| 区域 | RoCMSAC | 加权复合距离K-均值 | DDBSC | ||||||
|---|---|---|---|---|---|---|---|---|---|
| 簇号 | 均值/℃ | 标准差 | 簇号 | 均值/℃ | 标准差 | 簇号 | 均值/℃ | 标准差 | |
| A | R-22 | -1.04 | 0.271 | K-6 | -0.57 | 1.031 | D-33 | -1.08 | 0.275 |
| B | R-6 | 0.79 | 0.293 | 噪声 | |||||
| C | R-16 | 0.78 | 0.215 | D-42 | 0.85 | 0.124 | |||
Tab. 5 The mean and standard deviation of clusters in region 4表5 区域4各簇均值与标准差统计表 |
| 簇号 | RoCMSAC | 加权复合距离K-均值 | DDBSC | |||||
|---|---|---|---|---|---|---|---|---|
| 均值/℃ | 标准差 | 簇号 | 均值/℃ | 标准差 | 簇号 | 均值/℃ | 标准差 | |
| R-3 | 1.72 | 0.313 | K-9 | 1.53 | 0.667 | D-26 | 1.25 | 0.595 |
| R-11 | 0.88 | 0.215 | K-4 | 1.02 | 0.389 | |||
| K-3 | 0.80 | 0.192 | ||||||
Tab. 6 Relation between operation time and data size of each method表6 各方法运行时间与数据量关系表 |
| 数据量/103个 | 运行时间/S | ||
|---|---|---|---|
| RoCMSAC | 加权复合距离K-均值 | DDBSC | |
| 5 | 0.99 | 0.85 | 7.23 |
| 10 | 1.85 | 1.69 | 28.76 |
| 15 | 3.02 | 2.61 | 35.02 |
| 20 | 4.20 | 3.34 | 47.86 |
The authors have declared that no competing interests exist.
| [1] |
|
| [2] |
|
| [3] |
[
|
| [4] |
|
| [5] |
[
|
| [6] |
[
|
| [7] |
|
| [8] |
[
|
| [9] |
|
| [10] |
|
| [11] |
|
| [12] |
[
|
| [13] |
[
|
| [14] |
|
| [15] |
|
| [16] |
|
| [17] |
|
| [18] |
|
| [19] |
|
| [20] |
|
| [21] |
|
| [22] |
|
| [23] |
[
|
/
| 〈 |
|
〉 |