
山西省原平市神经管畸形时空分析
作者简介:陈会宴(1991-),女,河南人,硕士生,主要从事时空分析方法研究。E-mail:chenhuiyan_12@163.com
收稿日期: 2016-10-13
要求修回日期: 2017-01-16
网络出版日期: 2017-04-20
基金资助
国家自然科学基金项目(41471377)
国家自然科学基金创新群体项目(41421001)
资源与环境国家重点实验室自主创新青年基金项目
Spatial and Temporal Analysis of Neural Tube Defects in Yuanping County, Shanxi Province
Received date: 2016-10-13
Request revised date: 2017-01-16
Online published: 2017-04-20
Copyright
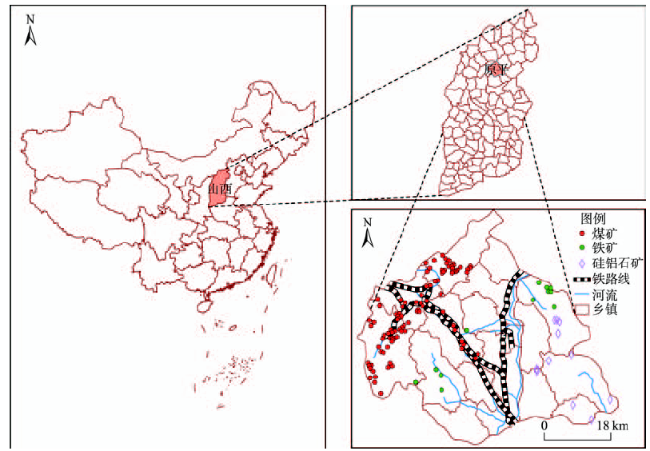
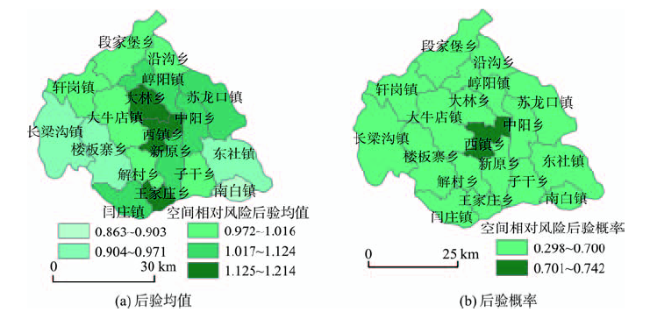
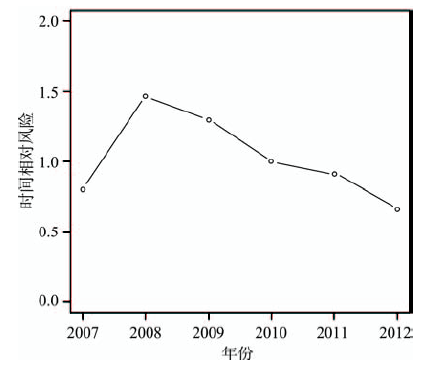
神经管畸形是发生于中枢神经系统的一种先天性异常,在所有的新生儿出生缺陷中所占比例较高。在我国,作为矿业大省的山西,神经管畸形最为严重,原平市又是山西省出生缺陷的高发市之一。本文利用山西省原平市2007-2012年的神经管畸形病例资料,基于贝叶斯理论的时空建模方法,综合考虑时间组分和时空交互组分,对神经管畸形的时空规律进行研究。研究识别了研究区内疾病发生的热点区域、冷点区域、温点区域,并对这些区域随时间的变化趋势进行了分析。研究发现,原平市18个乡镇中有1个热点区域、17个温点区域,整体发病率较高;原平市神经管畸形整体上随时间变化呈缓慢下降趋势,但该趋势并不明显;1个热点区域疾病风险下降趋势慢于整体趋势,4个温点区域疾病风险下降趋势快于整体趋势,13个温点区域疾病风险时间变化趋势与整体趋势趋同。本文识别了山西省原平市神经管畸形发病的时间趋势和空间趋势,可以揭示神经管畸形潜在的风险因子或控制措施供进一步流行病学研究,也可以为公共卫生部门制定及时有效的防治控制措施提供一定的科学参考。
陈会宴 , 廖一兰 , 张宁旭 , 徐冰 . 山西省原平市神经管畸形时空分析[J]. 地球信息科学学报, 2017 , 19(4) : 502 -510 . DOI: 10.3724/SP.J.1047.2017.00502
Neural tube defects (NTDs) are congenital anomalies that occur in the central nervous system. NTD is one of the birth defects with the highest incidence. China has the world’s highest rate of NTDs. Moreover, Shanxi province which is a leading producer of coal in China, has the Chinese highest incidence of NTDs. Yuanping County is one of the cities with highest incidence of NTDs. In epidemiology, researchers often use data based on the spatial distribution of diseases. However, with the growing interest in detection of variation of temporal trend in different study units, spatial-temporal modeling has been developed in the epidemiological analysis. Recently, one of spatial-temporal models based on the theory of bayesian has been extensively applied to the analysis of spatio-temporal patterns in relation to given diseases. The main difference of Bayesian spatial-temporal model is that it offers a natural framework to combine information from neighbouring areas or periods and hence to make the estimated results more reliable. In this paper, we applied a Bayesian spatial-temporal model and incorporated a space-time interactions component to explore the spatial-temporal variation of NTDs. The incidences of NTDs in Yuanping County of Shanxi Province between 2007 and 2012 were selected to analyze the spatial-temporal variation. Firstly, we identified areas that belong to the hot spots, cold spots or neither, and then studied the temporal trends of each area. Results show that the incidence rates of NTDs in Yuanping County is still very high. There is 1 hot spot, none cold spot and 17 areas that are neither hot spots nor cold spots. As a whole, the risk of NTDs in Yuanping County is slowly decreasing. The single hot spot has a slower decreasing trend compared to the overall decreasing trend in Yuanping County. Four areas which are neither hot spots nor cold spots show a faster decreasing trend. The rest of thirteen areas show the same decreasing trend as the whole. This paper identified the space-time variation and trends of NTDs in Yuanping County, which can help to study the potential factors and control measures of NTDs. Also, we provide scientific basis for the government to prevent the occurrence of NTDs.
Fig. 1 Location of the study area图1 研究区地理位置图 |
Tab. 1 Categories of disease risks trend for each towns表1 各乡镇疾病风险趋势类型表 |
| 增强 | 减弱 | 趋同 | |
|---|---|---|---|
| 热点 | ++ | +- | +/ |
| 冷点 | -+ | - - | -/ |
| 温点 | /+ | /- | // |
注:表中符号为AB型结构,其中A部分的“+”、“-”、“/”依次表示热点、冷点、温点,B部分的“+”、“-”、“/”依次表示增强、减弱、趋同。例如“++”表示热点区域疾病风险变化趋势较快,“+-”表示热点区域疾病风险变化趋势较慢或者有与整体变化趋势相反的变化趋势 |
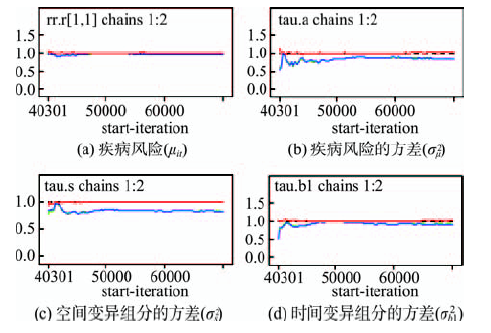
Fig. 2 Convergence diagnostics plots of Gelman-Rubin图2 Gelman-Rubin收敛诊断图 |
Fig. 3 The posterior means and the posterior probabilities of the spatial relative risks (exp(si)) in Yuanping County图3 原平市空间相对风险(exp())后验均值和后验概率 |
Fig. 4 The overall time trend in Yuanping County图4 原平市总体时间变化趋势 |
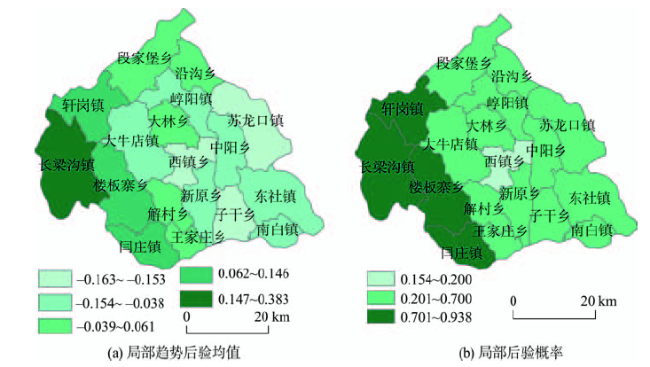
Fig. 5 The posterior means and the posterior probabilities of the departures of the local trends from the overall trend (exp( b1i )) in Yuanping County图5 原平市各乡镇相对总体风险变化趋势的局部趋势 (exp())的后验均值和后验概率 |
Tab. 2 The posterior means and posterior probabilities of the spatial relative risks and the departures of the local trends from the overall trend for specific areas表2 特定区域时间及空间变异的后验均值和后验概率 |
| Area(i) | pp() | pp() | ||
|---|---|---|---|---|
| 西镇乡 | 1.1890 | 0.7411 | -0.1560 | 0.1542 |
| 长梁沟镇 | 0.9344 | 0.3668 | 0.3826 | 0.9375 |
| 轩岗镇 | 1.0160 | 0.4658 | 0.1469 | 0.7764 |
| 楼板寨乡 | 0.9323 | 0.3589 | 0.1176 | 0.7343 |
| 闫庄镇 | 1.079 | 0.551 | 0.1062 | 0.7026 |
Tab. 3 Numbers of areas belong to each disease risks trend category表3 原平市各疾病风险趋势类别的乡镇数量统计表 |
| 增强 | 减弱 | 趋同 | 总计/个 | |
|---|---|---|---|---|
| 热点 | 0 | 1 | 0 | 1 |
| 冷点 | 0 | 0 | 0 | 0 |
| 温点 | 4 | 0 | 13 | 17 |
The authors have declared that no competing interests exist.
| [1] |
[
|
| [2] |
世界卫生组织第六十三届世界卫生大会临时议程项目,出生缺陷秘书处的报告[R].2010.
[Sixty-third World Health Assembly Provisional agenda item 11.7, Birth defects[R]. Report by the Secretariat, 2010. ]
|
| [3] |
中华人民共和国国家卫生和计划生育委员会.国家卫生计生委国新办发布会背景材料四:出生缺陷综合防治初见成效[EB/OL].[2014/5/29]. .
[National Health and Family Planning Commission of the People’s Republic of China. The scio conference background materials Ⅳ: Comprehensive prevention and treatment of birth defects produced results [EB/OL].[2014/5/29].[]. ]
|
| [4] |
中华人民共和国卫生部,中国出生缺陷防治报告[R].2012.
[China's Ministry of Health. China birth defects prevention report[R]. 2012. ]
|
| [5] |
[
|
| [6] |
|
| [7] |
|
| [8] |
|
| [9] |
中国出生缺陷监测协作组.中国出生缺陷地图集[M].成都:成都地图出版社,1992.
[China birth defects monitoring group. Atlas of China for birth defects[M]. Chengdu: Chengdu Cartographic Publishing House, 1992. ]
|
| [10] |
[
|
| [11] |
|
| [12] |
|
| [13] |
|
| [14] |
|
| [15] |
[
|
| [16] |
|
| [17] |
[
|
| [18] |
|
| [19] |
|
| [20] |
|
| [21] |
|
| [22] |
Besag, York and Mollié. Bayesian image restoration, with two applications in spatial statistics[J]. Annals of the Institute of Statistical Mathematics, 1991,43(1):1-20.
|
| [23] |
|
| [24] |
|
| [25] |
|
| [26] |
[
|
| [27] |
[
|
| [28] |
[
|
| [29] |
[
|
/
| 〈 |
|
〉 |