
长沙市热岛效应时空特征变化研究
作者简介:叶 钰(1993-),女,硕士生,研究方向为遥感影像处理及应用、GIS应用。E-mail:louesasuke@163.com
收稿日期: 2016-07-22
要求修回日期: 2016-11-09
网络出版日期: 2017-04-20
基金资助
国家自然科学基金项目(40971038)
Spatial-temporal Evolution of Urban Heat Island Effects in Changsha City
Received date: 2016-07-22
Request revised date: 2016-11-09
Online published: 2017-04-20
Copyright
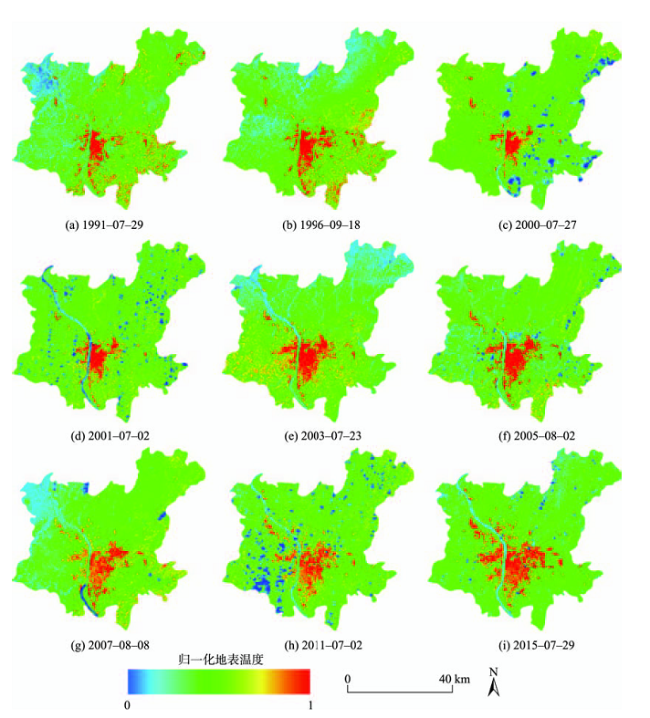
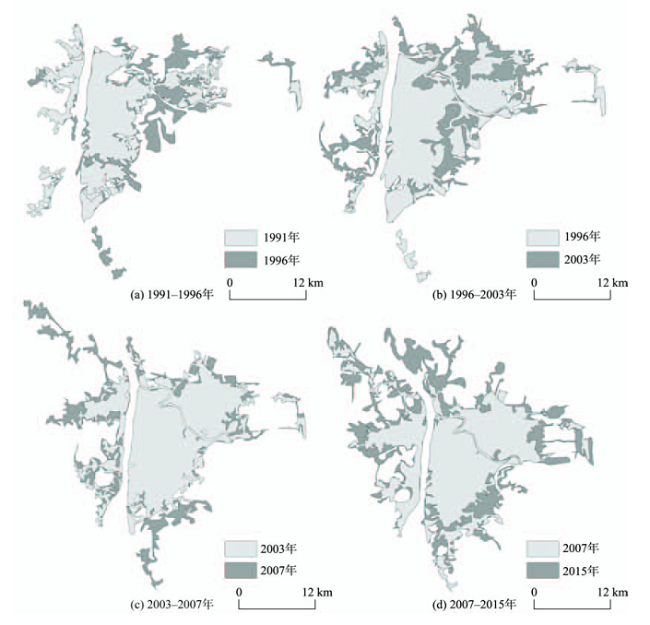
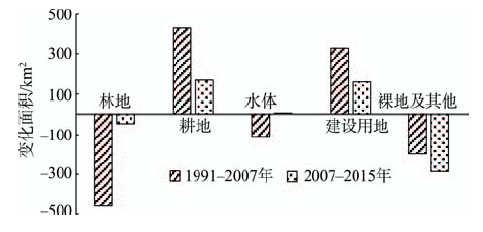
本文基于1991-2015年长沙市9景Landsat TM/ETM影像,采用单窗算法反演了长沙市建成区的地表温度,提取了土地利用/覆盖类型,并结合相关资料对长沙市热岛效应时空变化特征以及城市热环境与城市土地利用/覆盖变化之间的关系进行了分析。结果表明长沙市热岛范围随着建成区范围的扩大不断增大,并且热岛的时空演变与建成区扩大的趋势一致:1991-1996年,长沙市热岛向东发展迅速,截至1996年东部热岛面积增加达53.54 km2 ;1996-2003年,受城市建成区扩展影响,热岛向西部延伸,增加面积达39.88 km2;2003-2007年,建成区热岛向西部、南部加速发展,热岛增加总面积达33.55 km2;2007年后,长沙市建成区与热岛范围开始向东、西、南、北4个方向全面扩展。此外,建成区土地利用/覆盖情况发生了很大的变化,大量绿地转变为建设用地和耕地,极大地影响了地表温度的空间分布,各土地类型之间的温度差异显著缩小,水体良好的吸热性能明显地体现出来,建筑用地和裸地则对地表温度的贡献显著增大。
叶钰 , 秦建新 , 胡顺石 . 长沙市热岛效应时空特征变化研究[J]. 地球信息科学学报, 2017 , 19(4) : 518 -527 . DOI: 10.3724/SP.J.1047.2017.00518
This study used 9 scenes of Landsat TM / ETM images from 1991-2015 in Changsha to retrieve the land surface temperature of built-area of Changsha City and extract the land use/cover types. Combined with the related data, the characteristics of temporal and spatial variation of urban heat island (UHI) effects in Changsha City and the relationship between UHI and urban land use/cover change were analyzed. The results show that the extent of UHI in Changsha increased with the expansion of built-up area, and the spatial and temporal evolution of heat island was consistent with the trend of built-up area. During 1991-1996, the UHI in the east of Changsha city developed rapidly. In 1996, the eastern heat island area increased by 53.54 km2. Then, the UHI extended to the west with the increased area of 39.88 km2 as a result of the extension of city built-up area between 1996-2003. In 2003-2007, the UHI extended to the west and south rapidly, during which the heat island area increased about 33.55 km2. After 2007, the urban area and UHI of Changsha began to expand all-around. In addition, great changes have occurred in the land use/cover types of Changsha. Large area of green land was changed into building land and farmland, which greatly affected the spatial distribution of the land surface temperature (LST). Temperature difference between different land types was reduced significantly. The great capacity of heat absorption of water was obviously reflected. Construction land and bare land made great contributions to the LST.
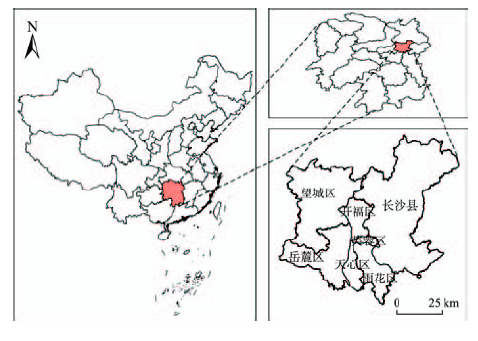
Fig 1 Location of the study area图1 研究区位置示意图 |
Tab.1 Remote sensing data used in this study表1 本文所使用的遥感数据 |
| 序号 | 条带号 | 传感器类型 | 成像时间 | 含云量/% |
|---|---|---|---|---|
| 1 | 123/40和123/41 | TM | 1991-07-19 | 0和1 |
| 2 | 123/40和123/41 | TM | 1996-09-18 | 11和0 |
| 3 | 123/40和123/41 | TM | 2000-07-27 | 10和14 |
| 4 | 123/40和123/41 | ETM+ | 2001-07-22 | 4和13 |
| 5 | 123/40和123/41 | ETM+ | 2003-07-28 | 0和0 |
| 6 | 123/40和123/41 | ETM+ | 2005-08-02 | 4和7 |
| 7 | 123/40和123/41 | ETM+ | 2007-08-08 | 1和2 |
| 8 | 123/40和123/41 | ETM+ | 2011-07-02 | 12和24 |
| 9 | 123/40和123/41 | ETM+ | 2015-07-29 | 2和8 |
Tab.2 The verification of retrieval表2 反演结果验证 |
| 站名 | 区站号 | 经度/°E | 纬度/°N | 年份 | 实测温度/℃ | LST/℃ | 绝对误差/℃ | 相对误差 |
|---|---|---|---|---|---|---|---|---|
| 长沙 | 57687 | 112.92 | 28.22 | 1991 | 29.5 | 31.03 | 1.53 | 0.05 |
| 马坡岭 | 57679 | 113.08 | 28.2 | 29.9 | 30.88 | 0.98 | 0.03 | |
| 长沙 | 57687 | 112.92 | 28.22 | 1996 | 26.4 | 29.19 | 2.79 | 0.11 |
| 马坡岭 | 57679 | 113.08 | 28.2 | 26.20 | 27.26 | 1.06 | 0.04 | |
| 长沙 | 57687 | 112.92 | 28.22 | 2000 | 30.2 | 28.94 | -1.26 | -0.04 |
| 马坡岭 | 57679 | 113.08 | 28.2 | 20.5 | 28.26 | -2.24 | -0.07 | |
| 长沙 | 57687 | 112.92 | 28.22 | 2001 | 30.5 | 31.83 | 1.33 | 0.04 |
| 马坡岭 | 57679 | 113.08 | 28.2 | 30.9 | 30.73 | -0.17 | -0.01 | |
| 长沙 | 57687 | 112.92 | 28.22 | 2003 | 31.8 | 35.66 | 3.86 | 0.12 |
| 马坡岭 | 57679 | 113.08 | 28.2 | 31.6 | 34.17 | 2.57 | 0.08 | |
| 长沙 | 57687 | 112.92 | 28.22 | 2005 | 27.3 | 30.41 | 3.11 | 0.11 |
| 马坡岭 | 57679 | 113.08 | 28.2 | 27.5 | 28.72 | 1.22 | 0.04 | |
| 长沙 | 57687 | 112.92 | 28.22 | 2007 | 29.6 | 31.86 | 2.26 | 0.08 |
| 马坡岭 | 57679 | 113.08 | 28.2 | 29.5 | 30.58 | 1.08 | 0.04 | |
| 长沙 | 57687 | 112.92 | 28.22 | 2011 | 30.5 | 30.97 | 0.47 | 0.02 |
| 马坡岭 | 57679 | 113.08 | 28.2 | 30.5 | 29.93 | -0.57 | -0.02 | |
| 长沙 | 57687 | 112.92 | 28.22 | 2015 | 26.2 | 30.86 | 4.66 | 0.18 |
| 马坡岭 | 57679 | 113.08 | 28.2 | 26.2 | 30.37 | 4.17 | 0.16 |
Fig. 2 LST distribution for Changsha from 1991 to 2015图2 1991-2015长沙市建成区地表温度分布情况 |
Tab.3 The range of different LST intervals表3 地表温度等级划分 |
| 温度等级 | 区间 | 范围 |
|---|---|---|
| #7 | 极高温区 | |
| #6 | 高温区 | |
| #5 | 次高温区 | |
| #4 | 中温区 | |
| #3 | 次中温区 | |
| #2 | 次低温区 | |
| #1 | 低温区 |
注:表示地表温度;表示地表温度平均值;是标准差 |
Fig.3 Comparison of the distribution of UHI in Changsha during 1991-2015图3 1991-2015年长沙市热岛各阶段分布情况对比 |
Tab.4 The transfer matrix of land covers in 1991 and 2015(km2)表4 1991年和2015年土地利用/覆盖转移矩阵(km2) |
| 2015年 | 1991年 | 合计 | ||||
|---|---|---|---|---|---|---|
| 林地 | 耕地 | 水体 | 建设用地 | 裸地及其他 | ||
| 林地 | 890.48 | 103.78 | 10.25 | 19.29 | 130.64 | 1154.44 |
| 耕地 | 486.81 | 715.78 | 86.92 | 111.05 | 273.54 | 1674.10 |
| 水体 | 10.59 | 12.16 | 122.84 | 6.33 | 3.55 | 155.47 |
| 建筑用地 | 223.66 | 202.00 | 36.85 | 122.06 | 173.26 | 757.83 |
| 裸地及其他 | 46.16 | 38.06 | 4.96 | 10.15 | 28.86 | 128.19 |
Fig.4 The changes of land use/cover type area from 1991 to 2015图4 1991-2015年各土地利用/覆盖类型面积变化情况(km2) |
Tab.5 Average normalized LST (mean±S.D) associated with land covers表5 各土地利用/覆盖类型的地表温度特征 |
| 土地类型 | 归一化温度 | ||
|---|---|---|---|
| 1991年 | 2007年 | 2015年 | |
| 林地 | |||
| 耕地 | |||
| 水体 | |||
| 建设用地 | |||
| 裸地及其他 | |||
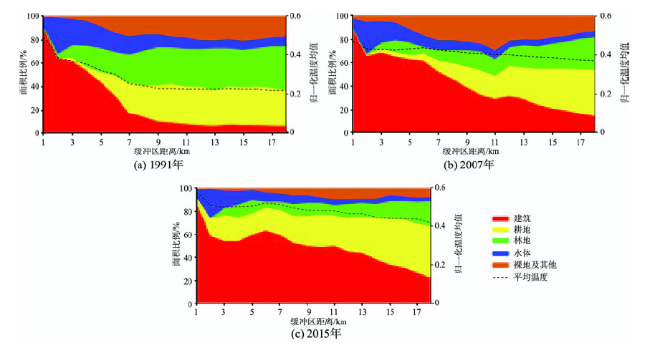
Fig.5 Variations of the land cover proportion and the average normalized LST with distance图5 各土地覆盖类型面积比重及归一化平均温度随距离变化情况 |
Tab.6 The transfer matrix of land covers from 1991 to 2015(%)表6 1991和2015年各温度等级区不同土地利用/覆盖面积比例(%) |
| 土地类型 | 低温区 | 中温区 | 高温区 | ||||||
|---|---|---|---|---|---|---|---|---|---|
| 1991年 | 2007年 | 2015年 | 1991年 | 2007年 | 2015年 | 1991年 | 2007年 | 2015年 | |
| 林地 | 19.38 | 26.89 | 22.15 | 56.79 | 35.81 | 37.88 | 2.62 | 3.89 | 1.56 |
| 耕地 | 76.60 | 49.06 | 24.44 | 28.06 | 53.42 | 55.37 | 21.10 | 10.25 | 10.86 |
| 水体 | 3.81 | 20.20 | 48.61 | 5.80 | 4.81 | 1.30 | 4.11 | 0.15 | 0.18 |
| 建设用地 | 0.03 | 3.21 | 4.79 | 0.74 | 2.30 | 4.42 | 32.85 | 59.45 | 74.62 |
| 裸地及其他 | 0.18 | 0.64 | 0.01 | 8.65 | 3.66 | 1.03 | 39.33 | 26.27 | 12.78 |
The authors have declared that no competing interests exist.
| [1] |
[
|
| [2] |
|
| [3] |
|
| [4] |
|
| [5] |
|
| [6] |
|
| [7] |
[
|
| [8] |
[
|
| [9] |
[
|
| [10] |
[
|
| [11] |
|
| [12] |
[
|
| [13] |
[
|
| [14] |
|
| [15] |
[
|
| [16] |
|
| [17] |
[
|
| [18] |
[
|
| [19] |
|
| [20] |
|
| [21] |
[
|
| [22] |
[
|
/
| 〈 |
|
〉 |