遥感科学与应用技术

遥感影像空间格局变异函数分析研究进展

  • 卫春阳 , 1, 2 ,
  • 徐丹丹 1, 2 ,
  • 董凯凯 1, 2 ,
  • 刘兆礼 , 1, *
展开
  • 1. 中国科学院东北地理与农业生态研究所,长春 130102
  • 2. 中国科学院大学,北京 100049
*通讯作者:刘兆礼(1964-),男,山东临沂人,研究员,研究方向为生态遥感中得尺度理论和技术应用。E-mail:

作者简介:卫春阳(1991-),男,四川雅安人,硕士生,主要从事遥感影像空间格局研究。E-mail:

收稿日期: 2016-10-08

  要求修回日期: 2017-01-09

  网络出版日期: 2017-04-20

基金资助

国家重点研发计划项目(2016YFC0500204)

Advances in Analysis of Remote Sensing Image Pattern Based on Semi-variogram

  • WEI Chunyang , 1, 2 ,
  • XU Dandan 1, 2 ,
  • DONG Kaikai 1, 2 ,
  • LIU Zhaoli , 1, *
Expand
  • 1. Northeast Institute of Geography and Agroecology, CAS, Changchun 130102, China
  • 2. University of Chinese Academy of Sciences, Beijing 100049, China
*Corresponding author: LIU Zhaoli, E-mail:

Received date: 2016-10-08

  Request revised date: 2017-01-09

  Online published: 2017-04-20

Copyright

《地球信息科学学报》编辑部 所有

摘要

随着多光谱传感器的广泛运用,利用地物光谱响应特征提取地表信息的技术日益成熟,但是由于地表状况的复杂性和光谱响应的局限性,光谱方法在指示平均大小、空间异向性、空间分布、空间异质性等格局信息方面存在不足,因此挖掘遥感影像的空间格局特征日益受到研究者的重视。已有研究发现,变异参数与地表场景参数存在一定的对应关系,通过变异参数可以实现地表场景参数的提取,因此变异函数分析方法被广泛应用于真实遥感影像格局分析中,具体包括平均尺度提取、周期性格局探测、空间异质性表征与空间异向性描述等地表格局参数量化方面、最佳尺度选择与影像纹理分析等遥感影像信息提取方面。尽管变异函数分析方法在上述应用领域中都发挥了重要作用,但是当前利用变异函数进行遥感影像空间格局分析大多局限于定性描述层面,缺乏精确化的量化描述与分析,限制了变异函数分析方法应用的进一步拓展,究其原因在于对遥感影像格局变异函数分析的内在机制缺乏深入了解。本文回顾了近20年来变异函数分析方法在遥感格局分析领域的主要应用,并对该方法本身的优势和存在的不足进行了总结,可为变异函数这一工具在遥感影像格局分析方面的有效应用提供参考。

本文引用格式

卫春阳 , 徐丹丹 , 董凯凯 , 刘兆礼 . 遥感影像空间格局变异函数分析研究进展[J]. 地球信息科学学报, 2017 , 19(4) : 540 -548 . DOI: 10.3724/SP.J.1047.2017.00540

Abstract

With the widespread application of multispectral sensors, the spectral response characteristics of features have been increasingly used to extract the surface information. Due to the complexity of surface conditions and limitation of spectral responses, spectral methods of indicating the average size, spatial distribution, spatial heterogeneity and pattern information are insufficient. Therefore, considerable attentions have been paid by researchers to mine the spatial pattern of remote sensing images. Previous studies have found that there is a corresponding relationship between semi-variogram parameters and scene parameters. Researchers can extract the surface parameters using semi-variogram parameters. With the understanding of this relationship, variogram analysis methods are widely used to quantify the surface pattern parameters, including the average scale extraction, periodic pattern detection, spatial heterogeneity and spatial anisotropy, extraction of image information of best scale selection, and texture analysis in pattern analysis of remote sensing images. Although the analysis methods of variogram play an important role in the above-mentioned application fields, the analysis of spatial pattern of remote sensing images based on the variogram is mostly limited to the qualitative description levels, and lacks precise quantitative description and analysis, which restricts the further application of the variogram analysis method. The main problem is the lack of understanding about the inherent mechanisms of the analysis of pattern variogram of remote sensing images. This should be the future direction in the research. This paper reviews the application of variogram analysis method in the field of remote sensing pattern analysis over the past two decades. The advantages and disadvantages of the method are summarized, which can provide a reference for the effective application of the variogram in the analysis of remote sensing image pattern.
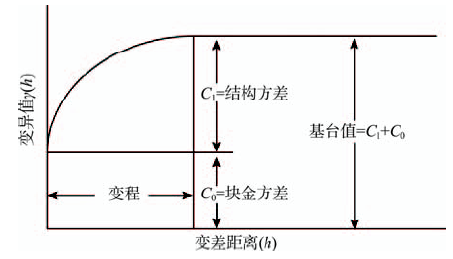
1 引言

空间距离相近的地理要素之间相似性比远距离地物之间的相似性更大[1-2],这种空间相关性特征由地理要素集聚性及其空间相互作用决定[2],是地理现象存在的普遍规律之一。地理变量存在空间相关性,在遥感影像上表现为一定形式的景观格局。景观格局是指景观组分构成的空间分布形式(通常包括斑块的随机、规则或聚集分布等类型),具体表现为斑块的大小、形状及空间构型等[3],反映到遥感影像上可称为遥感影像格局。明确遥感影像格局参数与地表场景参数之间关系,将有助于通过测量遥感影像格局以反映地表场景参数信息[4]。而变异函数正是探测遥感影像格局的有利工具,利用变异函数发掘遥感影像格局参数信息将会极大地拓展遥感影像的实际应用价值。
传统统计学中有关地表参量的频率分析、相关分析与回归分析等统计分析方法都是假设样本被独立地随机抽取[5],没有考虑处于不同空间位置的地表参量之间所普遍存在的空间相关性,因此在对地表现象进行量化描述时存在一定缺陷。而地统计学通常假设样本不是完全的随机变量,而是相互之间可能存在某种空间相关性,即地表参量样本不但具有一定随机性,同时还存在一定的结构性,从而使地表参量表现为区域化特征变量。变异函数则是地统计学中用于分析兼具随机性和结构性地学参量现象的有力工具[3,5]。遥感影像可以有效体现具有一定空间格局特征的地表参量,因而变异函数作为重要工具,近年来被广泛应用于遥感影像格局分析。
本文回顾了近20年来变异函数在遥感影像格局分析领域的主要应用,总结变异函数在这些领域应用存在的优势与不足,为未来变异函数应用于多种类型遥感影像数据,并有效地提取地表参量空间结构信息提供参考。本文主要阐述利用变异函数进行遥感影像格局分析的主要方法,说明变异函数参数与地表参量空间格局参数之间的对应关系及其影响因素,并从地表现象空间结构分析和遥感影像分类2个方面总结近年来变异函数在遥感领域中的实际应用,最后对上述研究进行了展望。

2 遥感影像格局的变异函数分析方法

利用变异函数进行遥感影像格局分析的研究工作主要从机理和应用2个层面展开,因研究重点不同,故采用的数据类型也有所差别[6-7]。开展遥感影像格局的变异函数分析机理研究的目的在于探究变异函数特征参数与地表参量空间结构之间内在关系,以便寻求对遥感影像格局进行变异函数分析的普遍方法;为了屏蔽众多干扰因素、以聚焦关键因素的深入分析,通常采用相对简单但能够突出主体要素的模拟影像数据,然而通过模拟数据得出的研究结论,还需要使用真实遥感影像进行检验与修正后才能推广应用。利用变异函数进行遥感影像格局分析的应用研究主要是面向具体问题进行真实遥感影像分析,如通过变异函数确定遥感影像制图的最佳尺度,对研究区域生态系统格局进行判别等;真实遥感影像数据采用单波段或者多波段影像类型,单波段遥感影像便于对地表参量空间结构进行分析,而多波段影像可通过不同波段光谱差异提取地表现象不同特征的空间结构信息。
变异函数用于遥感影像格局分析主要包括计算、拟合和解译3个步骤。
(1)计算是指根据变异函数公式,对遥感影像数据进行变异值(即半方差)计算,具体公式如式(1)所示。然后以半方差rh)为纵坐标,以采样间距h为横坐标生成实验半方差图。
r ( h ) = 1 2 N ( h ) i = 1 n ( h ) [ Z x i - Z x i + h ] 2 (1)
式中:Zx)为单波段遥感影像或者多波段数据生成的植被指数影像在x像元位置上的取值;nh)为采样间距为h个像元的样本数量。
(2)拟合是根据实验半方差图的散点形状,选择合适的数学模型对实验数据进行曲线拟合,生成理论半方差图。曲线拟合可采用线性模型、球体模型、指数模型、高斯模型、孔穴模型、对数模型和幂函数模型等。
(3)解译是指从理论半方差图中提取出变程、基台、块金以及空间异向性等变异参数,并与地表参量空间结构进行关联[8-10]。变异参数具体涵义如图1所示。变异函数分析方法是通过遥感影像样本像元变异程度随样点间距增加的变化来刻画遥感影像变量的空间自相关性特征,并采用变异参数对遥感影像格局进行量化表征。
Fig.1 The general semi-variogram

图1 一般的变异函数曲线图

3 变异参数与地表格局之间对应关系

Woodcock等[11]通过圆盘模拟影像数据来全面探究变异参数与地表格局之间的对应关系,论证使用变异函数反映地表空间结构的可行性;研究发现变程参数与地物大小、或者反映地表参量自相关结构的空间尺度存在相关关系,基台参数可以有效的反映遥感影像变量的变化幅度,并与模拟影像数据中的圆盘密度相关联;块金参数是变异距离h为0时的变异值,表征遥感影像中结构化变量的随机性大小;原点斜率可体现遥感影像精细尺度的数据变化,小的原点斜率表征空间变异过程趋于平缓,反之则趋于波动状况;空间异向性参数可揭示遥感影像格局在一个或多个方向是否类似,可用二维变异图很好地表征空间异向性。
St-Onge等[12]基于几何光学模型生成模拟影像数据,利用变异函数的变程参数提取树冠大小信息。通过研究发现,只有树冠大小频率分布占优的才能够通过变异函数的变程参数探测出来,但对于评估树冠评估大小则没有进行深入探讨。
遥感影像是地表参量空间过程的数字模拟,它必然受到影像空间分辨率影响。Jupp等[6]认为通过变异函数进行遥感影像格局分析,获取的变异参数能否有效地反映地表场景真实空间结构是与影像空间分辨率大小直接相关的,而且发现随着遥感影像空间分辨率的逐步粗化,变异函数的基台值在不断降低、变程参数在逐渐增大。体现在变异函数曲线上,呈现着逐渐趋于平缓的趋势。另外,由于点扩散函数(PSF)是遥感传感器的主要成像特征,遥感影像在反映地表空间格局时,PSF必然对遥感像元产生平均效应,从而也会影响遥感影像格局分析的变异函数[13],如图2所示。
Fig.2 Regularized variograms for a scene of overlapping disks of unit diameter covering 50 percent of the background[7]

图2 覆盖比例为50%的重叠圆盘场景规则化变异函数[7]

注:D为规则化圆盘的直径,D=0表示原始图像变异

4 遥感影像结构变异函数分析方法 应用

遥感影像格局的变异函数分析方法主要应用于地表格局分析与遥感影像分类2大领域。

4.1 地表格局特征分析

当前通过变异函数进行遥感影像格局分析,以获取地表格局特征信息的研究主要包括地物平均尺度、地表周期特征、空间异质性与空间异向性等方面。
4.1.1 地物平均尺度
由于变异函数的变程参数与地表场景中地物的平均尺度存在相关关系,因而变异函数被用于从遥感影像数据中提取地物平均尺度信息。刘玉锋等[14]基于西天山云杉QuickBird影像进行变异计算估算林分冠幅,通过云杉树冠的平均大小与变程参数进行相关分析,发现二者之间的相关系数为0.6,认为可以通过变程参数估算平均林分冠幅,但是对估算误差没有进行分析。冯益明等[15-16]基于QuickBird影像估算山西省大同地区人工小黑杨纯林冠幅,认为当郁闭度较高时可以通过变程定量估算林分冠幅,但是在密度较低的时候估算误差较大。Suhardiman等[17]利用变异函数的变程参数估算印度尼西亚Mahakam三角洲红树林树冠大小,取得了较高精度,但是发现在树冠密度较大时获取信息的精度较差。Kamal等[18]使用高空间分辨率遥感影像数据对红树林进行重采样处理,通过计算不同空间尺度下样线的变异函数曲线变化情况,分析了空间分辨率对红树林遥感影像格局信息变异函数探测的影响。Song等[19]基于规则化影像的基台值是树冠大小的函数的现象,利用2幅不同空间分辨率的影像变异函数基台值估算树冠大小,发现随着空间分辨率的下降,基台值逐渐降低,且基台值降低的程度与树冠尺度相关,当像元大小和地物大小的比例接近整数时,模型估算树冠的效果最好。
4.1.2 地表周期特征
地物与背景交替出现的周期性结构是地表场景格局呈现的一种主要方式,反映到变异函数曲线上,则表现为具有周期性波动的孔穴模型,它可有效地表征地表场景的规律性空间结构特征。
Balaguer-Beser等[9]将变异函数应用于高空间分辨率的航空影像数据,开展对不同类型周期性格局特征的变异函数分析,对于地表场景内地物的规律性排列,变异函数曲线表现为周期性变化特征,并且其频率与周期性地物的密度相关(图4)。根据变异函数波动曲线特征,构造出多种类型衍生参数,以量化周期性格局场景的不同变异程度,取得了较好的识别效果。Cohen等[20]通过变异函数探索美国西北部森林立地遥感影像中蕴含的空间结构信息,对比研究全幅变异与样线变异2种参数在表征森林立地空间结构方面的性能,发现全幅变异参数能够较好地反映森林立地整体结构特征,但是不能很好地体现立地内部结构特征;而样线变异参数难以全面表示森林整体立地结构,但是可指示森林冠层覆盖的周期性。
Fig.4 Two-dimensional variogram of the South Dakota forest image[4]

图4 美国南Dakota森林二维变异图[4]

4.1.3 空间异质性
空间异质性是指某种地表参量在空间分布上的不均匀性及其复杂程度[21]。由于像元内地表空间异质性与地表参量遥感反演模型的非线性,使地表参量粗尺度遥感提取产生精度损失,量化空间异质性将有助于空间格局表达,是遥感模型空间尺度转换的重要依据。通常空间异质性体现为地表参量幅度变化与空间结构,可使用遥感影像的变异函数基台值与变程参数予以分别表示[22]
随机分维数(也称变异函数曲率[5])也被用来表征空间异质性,它是变异值随着滞后距离(lag distance)变化的比率,随机分维数越小、空间异质性 越大,达到最高值2时地表场景呈现完全随机状 态[23-24]。黄华富等[25]基于福建省海坛岛4个不同年份的Landsat ETM+遥感影像,进行4个方向的变异函数计算,然后从中提取随机分维数,以判断不同方向的空间异质性,从而确定各个年份土地利用的空间异向性格局。积分变程是将不同尺度变异函数的变程和基台进行整合所产生的定量指标,通常采用变异函数的指数模型或球状模型计算得出[22,26]。温兆飞等[27]基于三江平原Lansat/TM NDVI数据进行变异函数计算,提取表征空间异质性的积分变程指标作为遥感最优尺度选择的依据。
从遥感数据源来看,影像空间异质性与传感器空间和光谱分辨率有关。Dolan等[28]针对高光谱EAGLE/HAWK航空数据,利用变异函数计算不同空间与光谱分辨率NDVI影像的空间异质性,发现空间分辨率比光谱分辨率对NDVI影像的空间异质性影响更大,因此量化空间异质性应以空间信息为主。Colomboa等[29]量化空间异质性的方法主要包括单波段直接变异和多波段交叉变异,将变异值除以方差以获得二值分类图的相对变异函数,然后基于其变程、基台和块金等参数考察不同破碎程度影像的结构特征。Garrigues等[30]基于多光谱遥感影像数据,建立了空间异质性的多变量模型;具体做法是针对红与近红外波段遥感影像的空间异质性,运用双变量交叉模型对红光与近红外区域变量之间的空间协同变异进行量化,发现植被地块与裸土地块镶嵌格局之间呈现或正或负的空间相关性,从而有效地提升了红与近红外波段遥感影像数据空间变异程度的提取能力。
4.1.4 空间异向性
当地表格局特征在不同角度方向上呈现差异,即出现空间异向性时,需要通过对遥感影像进行不同方向的变异函数计算,得到不同方向差异显著的变异参数,由此表征地表格局的空间异向性特征。
Woodcock[4]对遥感影像进行不同角度方向的变异函数计算,生成二维变异图(图3)。研究发现,由于光照方向阴影因素的作用减少了该方向上的平均变异大小,使二维变异图呈现近对角线方向的轴线分布趋势,因此通过二维变异图可以一定程度上反映地表格局的空间异向性。
Fig.3 Variograrns for red-band image with different spatial patterns[8]

图3 不同空间格局的红波段影像变异函数曲线[8]

张雪艳等[31]通过对蒙古高原GIMMS NDVI影像数据计算4个方向的变程参数和随机分维数,发现在西北-东南方向上2种参数取值都较大,以此判断蒙古高原植被呈现西北-东南走向的分布格局。曾宏达[32]通过对武夷山森林蓄积采样图进行四个方向的变异函数计算,发现在南-北和东南-西北2个方向上变异函数曲线斜率较大,由此可以推断地形对森林格局的影响程度。Tandeo等[33]基于AVHRR遥感影像数据,并结合变异函数测量海水表层温度的空间异向性,他们将变异方向分解成水平和垂直两个方向进行变异函数计算,使用方向椭圆对拟合曲线的变异参数值进行呈现,通过椭圆长轴和短轴大小对方向椭圆进行参数化,并以长轴偏北角作为椭圆的方向,以此表征海水表层温度变化的空间异向性。

4.2 遥感影像分类

4.2.1 最佳空间尺度
空间尺度是指地理范围或分辨率等刻画细节的量度方法,而尺度效应则是指不同观测尺度之间地学对象、地表现象与过程存在不同的特征差异[21]。最佳空间尺度通常包括最佳分析尺度和最佳制图尺度2种。最佳制图尺度是指遥感影像空间分辨率既要精细到可以捕捉地表感兴趣特征,又要保证影像数据量最小[18];最佳分析尺度则包括面向对象影像分析中合适分割尺度的选择和纹理提取算法中最佳窗口的确定。
确定最佳制图尺度方法是通过对高空间分辨率遥感影像数据进行逐步粗化,然后对粗化影像数据系列进行变程、基台和块金等变异参数提取,并根据变异参数随空间分辨率变化曲线的特征值确定最优空间尺度[13]
Atkinson等[34]为了确定植被生物量遥感估计的最佳空间尺度,在对遥感影像数据进行不同程度的系列粗化,并计算它们的变异函数,在此基础上,提取局域方差与扩散方差指标,当它们达到最大值时,所对应的空间尺度被用来指示最佳的遥感空间分辨率。Ozdogan等[35]针对耕地面积遥感分类估计问题,使用变异函数对像元内农田比例分布进行参数化,根据得到的不同空间分辨率遥感影像的像元大小与变程参数比值曲线,得出能够获取正确农田比例的空间分辨率阈值应在0.6到0.8倍变程区间的研究结论。明冬萍等[36]基于SPOT-5遥感影像进行面向对象的农田遥感分类提取,利用变程确定的合适分割尺度,但是为了解决实际影像变异计算中变异曲线并非绝对平稳导致的变程难以确定的问题,采用以一定的间隔进行综合变异[37]计算,计算相邻间隔的变异的差值,然后以差值第一个小于0时对应的计算间隔近似为变程,以此作为遥感影像分割的依据。Jeffrey等[38]从多光谱遥感影像提取出第一主成分影像数据,然后计算其变异函数的变异参数,发现随着空间分辨率的增大,块金值会逐渐降低,而基台值会逐渐增加,块金和基台的比例不断降低,最终趋于稳定,并由此决定最佳空间分辨率大小。Gertner等[13]将地面214个采样点数据与TM影像数据结合,根据块金与基台之比达到稳定时的规则化程度来确定最佳支撑大小;通过植被分类数据的交叉检验证实,相对于单一地面数据,2类数据结合可以达到更优的植被地面采样尺度。
由于真实地理实体是一个多层次的复杂综合体,不同层次具有不同变化特征,难以使用单一空间分辨率遥感影像进行表征,韩鹏等[39]认为综合考虑多光谱信息可能更有利于最佳空间尺度的确定。当然,相对于变异函数只能描述遥感影像空间变异整体特征,小波分析等方法更有利于遥感影像局部变化的探测和量化,而成为局域最佳空间尺度选择的良好方法[30]。陈春雷等[40]对不同区域和不同波段的遥感影像进行变异计算获取变程确定最佳尺度,通过与局域方差的对比发现局域方差适合提取影像的微观特征,而变异函数适合提取宏观结构。
4.2.2 影像纹理参数
遥感影像像元通常与邻近像元存在一定相关性,即为影像纹理特征,但大部分遥感分类算法对此不予考虑[41]。这种相关性可在一定程度上被量化并运用到影像分类中,尤其是当遥感影像中存在“异物同谱”和“同物异谱”时,纹理信息将发挥重要作用[8]。当前基于变异函数描述纹理的算法原理为:① 利用变异模型系数生成纹理;② 利用变程选择纹理提取窗口算法的最佳大小;③ 从变异函数推导出变程、基台等参数,并以此进行纹理描述[9]
对于变异模型系数生成遥感分类纹理波段,Ramstein等[42]计算11像元×11像元窗口内变异函数,利用最小二乘法对变异函数曲线进行数学模型拟合,然后将非线性模型参数生成纹理波段用于辅助遥感影像分类。试验结果表明,该方法有助于提升遥感分类精度,但是可能产生信息损失,另外其计算量不容忽视,且可靠性也难以保证。
对于利用变程选择灰度共生矩阵计算窗口,很多研究发现变程对于纹理计算最佳窗口确定方面很有帮助[43]。黄艳等[44]通过灰度共生矩阵生成纹理波段,利用变异函数的变程参数选择最佳的纹理计算窗口,将生成的纹理波段数据参与遥感影像分类,提高了遥感分类精度,但在空间异质性较强情形下,还需要对多种地物分别进行变异函数分析,实际操作程序较为复杂。当然,也有采用多窗口进行纹理计算的案例,Frankin等[45]针对SPOT遥感影像数据,通过使用变化窗口对遥感影像进行遍历并计算灰度共生矩阵,将此用于遥感影像最大似然分类,论证了多窗口纹理计算对遥感分类精度的改善作用。
对于变异函数参数数据作为遥感分类纹理波段,Chica-Olmo等[41]基于2个代表性主成分波段数据,通过直接变异和绝对变差等相关变异函数计算,在局部层次量化了地表辐射量空间变化,然后逐像元计算空间变化纹理值,生成多波段纹理影像作为影像分类的辅助数据,可以有效地解决遥感影像分类中的类别混淆问题。廖楚江等[46]对海南省海滩沙地TM6遥感影像进行主成分分析,然后计算3×3、5×5和7×7共3个不同窗口的变异函数纹理,其中纹理值是通过平均窗口内步长为1的4个方向的变异值(图5),用以生成纹理波段合成影像,从而实现了遥感影像分类中不同等级沙漠化区域的分离。王鹤霖等[47]为了更好地识别TM遥感影像中的针阔混交林树种,对其主成分分析数据进行不同窗口大小和不同变异函数方式计算的纹理提取,发现基于9×9窗口的绝对变异函数提取的纹理波段用于辅助分类效果最好。Berberoglu等[48]将最大似然法和神经网络分析法进行结合用于Landsat TM遥感影像分类,通过逐像元移动窗口进行变异函数计算以提取纹理信息,分别计算了1、2与3个像元为滞后距离的变异参数值,然后将其与光谱数据一起用于遥感影像的辅助分类,发现前2个滞后距离的变异参数值对分类效果帮助较大。
Fig.5 Calculation of geostatistical texture[43]

图5 地统计学纹理计算示意图[43]

变异函数计算主要包括基于二次方、基于方根和基于绝对值等方式,不同变异函数计算方式对纹理表达效果不同,李培军等[49]针对Landsat影像,采用3种变异函数计算方式获取纹理波段数据,发现二次方计算方式放大了影像异常值的影响,方根计算方式的性能受纹理窗口大小影响很大,绝对值计算方式的纹理提取则表现出良好的分类性能。

5 结论与展望

地学领域普遍存在的空间相关性主要体现为地理现象格局特征。变异函数可以较好地表征地表空间相关性,遥感影像又能够充分反映地表空间结构状况,因而遥感影像格局的变异函数分析方法日益成为地学领域的研究热点之一。本文回顾了近20年来变异函数在遥感影像格局分析领域的理论研究与主要应用,总结了遥感影像格局变异函数分析方法存在的优势和不足。
模拟影像数据被用来全面探究变异参数与地表格局之间的对应关系,涉及的变异参数包括变程、基台、块金与原点斜率等,分别与地表空间格局的不同方面存在一定的相关关系。但是体现其内在机制的变异参数与地表格局之间对应关系研究仍局限在经验型描述阶段,尚存在许多需要深入研究的问题,如地表场景空间结构与变异函数相关参数之间是否存在明确量化关系;变程、基台、块金与原点斜率等变异参数在分析遥感影像格局效果方面是否存在一定局限性。这些都需要在未来的研究工作中逐步深化,以达到对变异函数分析内在机制的充分理解。
遥感影像格局的变异函数分析主要应用于地表格局特征的表征,具体体现在地物平均尺度、地表周期性特征、空间异质性与空间异向性等方面,其中,地物平均尺度体现目标地物的平均大小,地表周期性特征体现目标与背景地物交替出现情况,空间异质性体现连续地表参量在空间上的不均匀性,而空间异向性则体现为上述地表格局特征在不同方向上的差异性。变异函数的特征参数及其衍生参数可以对遥感影像中蕴含的上述地表格局特征进行有效表征。变异函数分析方法也被大量用于遥感影像分类中的最佳尺度选择与影像纹理生成方面。最佳尺度选择主要针对不同程度粗化遥感影像数据系列,采用变异参数或其派生参数来进行判断;至于利用变异函数提取纹理信息方面,主要是通过提取纹理窗口内变异函数曲线拟合模型参数或者变异函数的变异参数,将其作为辅助的纹理波段加入到遥感影像分类中去,实现遥感分类精度的提升。随着遥感影像数据类型的不断丰富,特别是高光谱与高空间遥感、主被动微波雷达,以及激光雷达等新型遥感数据的出现,使利用变异函数分析方法对上述影像数据的地表格局特征信息进行提取成为未来研究的方向之一。

The authors have declared that no competing interests exist.

[1]
Tobler W R.A computer movie simulating urban growth in the Detroit Region[J]. Economic Geography, 1970,46(Supp 1):234-240.

DOI

[2]
王远飞,何洪林.空间数据分析方法(21世纪高等院校教材)[M]:北京:科学出版社,2007.

[Wang Y F, He H L.Spatial data analysis method (Twenty-first Century textbook of Higher Learning Institutions) [M]. Beijing: Science Press, 2007. ]

[3]
张娜. 景观生态学[M].北京:科学出版社,2014.

[Zhang N.Landscape ecology[M]. Beijing: Science Press, 2014. ]

[4]
Woodcock C E, Strahler A H, Jupp D L B. The use of variograms in remote sensing: II. Real digital images[J]. Remote Sensing of Environment, 1988,25(3):349-379.Extraction of information from remotely sensed images would greatly benefit from increased use of spatial data. However, the utility of spatial data has been undermined by a lack of understanding of the nature and causes of observed spatial variation in images. One approach to this problem is to model the spatial variation in images as a function of ground scene and sensor parameters. Variograms are the tool used to link models of ground scenes to spatial variation in images. Explicit variograms are calculated for simple models of ground scenes consisting of randomly located discs on a continuous background. By incorporating the effect of the IFOV of the sensor through a process called regularization, explicit variograms for images of these scene models are derived. Verification of the explicit variograms is accomplished by simulating images that match the assumed scene model and sensor parameters and calculating empirical variograms for these images. For a simple scene model of randomly located discs on a continuous background, explicit and empirical variograms match, verifying the convergence of these two dissimilar approaches. The sensitivity of variograms is studied through varying parameters of scene models both in calculating explicit variograms and in simulating images. Results indicate direct ties between several scene parameters and the behavior of variograms. The height of the sill of the variogram is related to the density of objects. The range of influence is related to the size of objects. Increased variance in the size distribution of objects results in a more rounded shape in the variogram near the sill. Primary effects of increasing the units of regularization, or larger pixel size, are a decrease in the height of the sill and an increase in the range of influence.

DOI

[5]
徐建华. 现代地理学中的数学方法.(第2版)[M]:北京:高等教育出版社,2002.

[Xu J H.Mathematical methods in contemporary geography. (Second Edition)[M]. Beijing: Higher Education Press, 2002. ]

[6]
Jupp D L B, Strahler A H, Woodcock C E. Autocorrelation and regularization in digital images: I. Basic theory[J]. IEEE Transactions on Geoscience & Remote Sensing, 1988,26(4):463-473.The variogram function used in geostatistical analysis is a useful statistic in the analysis of remotely sensed images. Using the results derived by Jupp et al. (1988), the basic second-order, or covariance, properties of scenes modeled by simple disks of varying size and spacing after imaging into disk-shaped pixels are analyzed to explore the relationship betwee image variograms and discrete object scene structure. The models provide insight into the nature of real images of the earth's surface and the tools for a complete analysis of the more complex case of three-dimensional illuminated discrete-object images.

DOI

[7]
Jupp D L B, Strahler A H, Woodcock C E. Autocorrelation and regularization in digital images: II. Simple image models[J]. IEEE Transactions on Geoscience & Remote Sensing, 1989,27(3):247-258.

[8]
Zawadzki J, Cieszewski C J, Zasada M, Lowe R C.Applying geostatistics for investigations of forest ecosystems using remote sensing imagery[J]. Silva Fennica, 2005,39(4):599-617.ABSTRACT Geostatistically based methods that utilize textural information are frequently used to analyze remote sensing (RS) images. The role of these methods in analyzing forested areas increased rapidly during the last several years following advancements in high-resolution RS technology. The results of numerous applications of geostatistical methods for processing RS forest images are encouraging. This paper summarizes such results. Three closely related topics are reviewed: 1) specific properties of geostatistical measures of spatial variability calculated from digital images of forested areas, 2) determination of biophysical forest parameters using semivariograms and characterization of forest ecosystem structure at the stand level, and 3) forest classification methods based on spatial information.

DOI

[9]
Balaguer-Beser A, Ruiz L A, Hermosilla T, Recio J A.Using semivariogram indices to analyse heterogeneity in spatial patterns in remotely sensed images[J]. Computers & Geosciences, 2013,50(50):115-127.The benchmark problem proposed in this paper is to identify regions in aerial or satellite images with geometric patterns and describe the geometric properties of the constituent elements of the pattern and their spatial distribution. This is a relevant topic in image analysis processes where spatial regular patterns are studied. This paper first presents two approaches based on multi-directional semivariograms for reducing the processing time required to compute omnidirectional semivariograms. A set of parameters for describing the structure of a semivariogram, introduced by Balaguer et al. (2010), is extracted from an experimental semivariogram and analysed to quantify the heterogeneity of the distribution of elements (trees) with periodic patterns in images of orchards. An assessment is made using four image datasets. The first dataset is composed of synthetic images that simulate regularly spaced tree crops and real images, and is used to evaluate the influence that the orientation of elements (regularly spaced trees) in the objects (crop plots) has in the descriptive parameter values. This dataset is also used to compare different semivariogram computational approaches. The other three are also composed of synthetic images and are used to evaluate the semivariogram parameters under different spatial heterogeneity conditions, and are generated by varying patterns and tree characteristics, i.e., existence or absence of faults, regular/irregular distributions, and size of the elements. Finally, the proposed methodology is applied to real aerial orthoimages of orchard plots.

DOI

[10]
Chilès J P, Delfiner P.Geostatistics: Modeling spatial uncertainty. Wiley, New York[J]. Journal of the American Statistical Association. 2000,95(449):695.Geostatistics : modeling spatial uncertainty Jean-Paul Chilès, Pierre Delfiner (Wiley series in probability and mathematical statistics) Wiley, c2012 2nd ed : hbk

DOI

[11]
Woodcock C E, Strahler A H, Jupp D L B. The use of variograms in remote sensing: I. scene models and simulated images[J]. Remote Sensing of Environment, 1988,25(3):323-348.Extraction of information from remotely sensed images would greatly benefit from increased use of spatial data. However, the utility of spatial data has been undermined by a lack of understanding of the nature and causes of observed spatial variation in images. One approach to this problem is to model the spatial variation in images as a function of ground scene and sensor parameters. Variograms are the tool used to link models of ground scenes to spatial variation in images. Explicit variograms are calculated for simple models of ground scenes consisting of randomly located discs on a continuous background. By incorporating the effect of the IFOV of the sensor through a process called regularization, explicit variograms for images of these scene models are derived. Verification of the explicit variograms is accomplished by simulating images that match the assumed scene model and sensor parameters and calculating empirical variograms for these images. For a simple scene model of randomly located discs on a continuous background, explicit and empirical variograms match, verifying the convergence of these two dissimilar approaches. The sensitivity of variograms is studied through varying parameters of scene models both in calculating explicit variograms and in simulating images. Results indicate direct ties between several scene parameters and the behavior of variograms. The height of the sill of the variogram is related to the density of objects. The range of influence is related to the size of objects. Increased variance in the size distribution of objects results in a more rounded shape in the variogram near the sill. Primary effects of increasing the units of regularization, or larger pixel size, are a decrease in the height of the sill and an increase in the range of influence.

DOI

[12]
St-Onge B A, Cavayas F. Estimating forest stand structure from high resolution imagery using the directional variogram[J]. International Journal of Remote Sensing, 1995,16(11):1999-2021.Abstract The height and stocking of forest stands can be estimated with relatively high precision using an empirical model relating parameters extracted from the directional variogram of high resolution images and forest structure parameters. A geometrical-optical model of the forest was first used to generate images of artificial forest stands in order to establish the relation between tree size. tree density and image texture. The resulting equations were then applied on the computer generated images as well as on high resolution MEIS II images to predict the forest structure values. The results show a good concordance between actual and predicted values, even when spatial resolution was degraded from 0路36m to 2路16m.

DOI

[13]
Gertner G, Wang G.Appropriate plot size and spatial resolution for mapping multiple vegetation types[J]. Photogrammetric Engineering & Remote Sensing, 2001,67(5):575-584.ABSTRACT For mapping multiple vegetation types at large scale, deter-mining appropriate plot size and spatial resolution is very important. However, this can be difficult because of spectral mixtures, low correlation of remote sensing and field data, and high cost to collect field data at a high density. This paper presents a method to determine appropriate plot size and spatial resolution for mapping multiple vegetation types using remote sensing data for a large area. This method is based on field data and geo-statistics theory. The method accounts simultaneously for within-support and regional spatial vari-ability by modeling both within-support and regional semi-variograms. The range parameters of the within-support semi-variograms implied the maximum range of the appropriate plot sizes. Using the regional semi-variograms, the support size was considered appropriate when the ratio of the nugget variance to sill variance stabilized. The method is assessed using field data and satellite TM data b y developing the semi-variograms by vegetation type and TM band; and b y cross validation of vegetation classification. A possible improvement for remote sensing to aid mapping is suggested.

DOI

[14]
刘玉锋,陈冬花,郑朝贵.高分辨率遥感数据云杉林林分冠幅估计[J].新疆农业大学学报,2013,36(2):153-157.以西天山林区典型植被类型——云杉林为研究对象,选择高空间分辨率卫星遥感影像(QuickBird)作为数据源,采用空间统计学方法对林分冠幅进行定量 估计.云杉林林分冠幅具有一定的空间结构性,在可以作为表征树冠大小及其空间分布特征的二维区域化随机变量的高空间分辨率卫星遥感影像上表现为均衡分布的 简单斑块,并且间隔一定距离具有空间自相关特征.通过对影像特定方向上的半方差函数的变程与云杉林林分(样地)平均冠幅之间的相关分析,发现二者之间存在 较强的线性相关关系,表明采用空间统计学半方差理论可以用作研究区范围云杉林林分平均冠幅定量估计的参考.

DOI

[Liu Y F, Chen D H, Zheng C G.Estimation on forest stand crown of the Picea schrenkiana based on high spatial resolution imagery[J]. Journal of Xinjiang Agricultural University, 2013,36(2):153-157. ]

[15]
冯益明,李增元,邓广.不同密度林分冠幅的遥感定量估计[J].林业科学,2007,43(1):90-94.以高空间分辨率遥感影像QuickBird的全色波段为数据源, 应用空间统计学半方差理论,对山西大同薛家庄林场不同林分密度的小黑杨人工纯林冠幅尺寸进行估计.结果表明:应用空间统计学半方差函数来分析高空间分辨率 影像,可以较为准确地实现对密度相对较高纯林林分冠幅尺寸的估计,随着林分密度的降低,估计误差相应地增大.

DOI

[Feng Y M, Li Z Y,Deng G.Quantitative estimation for forest stand crown of different stand densities by remote sensing[J]. Scientia Silvae Sinicae, 2007,43(1):90-94. ]

[16]
冯益明,李增元,张旭.基于高空间分辩率影像的林分冠幅估计[J].林业科学,2006,42(5):110-113.以高空间分辨率遥感影像QuickBird的全色波段为数据源,应用空间统计学半方差理论,对郁闭度较高的人工白皮松林冠幅尺寸进行较为准确地估计。结果表明:空间统计学半方差方法可以作为郁闭度较高纯林林分冠幅估计的一种有效方法。研究为解决林分冠幅的自动估计问题,提供了一种新的手段与方法。

DOI

[Feng Y M, Li Z Y,Zhang X.Estimating forest stand crown based on high spatial resolution image[J]. Scientia Silvae Sinicae, 2006,42(5):110-113. ]

[17]
Suhardiman A, Tsuyuki S, Setiawan Y.Estimating mean tree crown diameter of mangrove stands using aerial photo[J]. Procedia Environmental Sciences, 2016,33:416-427.Abstract Geostatistics was applied to estimate mean tree crown diameter using high spatial resolution aerial photo of three different mangrove forest structure in the Mahakam Delta, East Kalimantan, Indonesia. The variogram analysis of the aerial photo was succeeded to estimate mean tree crown diameter of mangrove forest of Mahakam Delta. The Range of variogram was used to predict mean tree crown diameter and came to result with the error about 6.19% or less than 0.5 m. Based on this study, green band looks promising but still need more exploration and further test especially for complex canopy structure such as lowland Dipterocarp forest which completely distinct to Mangrove forest. Despite of its successness, variogram was not succeed to estimate mean crown diameter of high density mangrove forest plantation sites. Close-spacing plantation suppressed tree crown growth and development. In the aerial photo, it produced smooth texture feature of tree crown with less edge of shadow. Consequently, tree crown became indistinguishable.

DOI

[18]
Kamal M, Phinn S, Johansen K.Characterizing the spatial structure of mangrove features for optimizing image-based mangrove mapping[J]. Remote Sensing, 2014,6(2):984-1006.ABSTRACT Understanding the relationship between the size of mangrove structural features and the optimum image pixel size is essential to support effective mapping activities in mangrove environments. This study developed a method to estimate the optimum image pixel size for accurately mapping mangrove features (canopy types and features (gaps, tree crown), community, and cover types) and tested the applicability of the results. Semi-variograms were used to characterize the spatial structure of mangrove vegetation by estimating the size of dominant image features in WorldView-2 imagery resampled over a range of pixel sizes at several mangrove areas in Moreton Bay, Australia. The results show that semi-variograms detected the variations in the structural properties of mangroves in the study area and its forms were controlled by the image pixel size, the spectral-band used, and the spatial characteristics of the scene object, e.g., tree or gap. This information was synthesized to derive the optimum image pixel size for mapping mangrove structural and compositional features at specific spatial scales. Interpretation of semi-variograms combined with field data and visual image interpretation confirms that certain vegetation structural features are detectable at specific scales and can be optimally detected using a specific image pixel size. The analysis results provide a basis for multi-scale mangrove mapping using high spatial resolution image datasets.

DOI

[19]
Song C, Woodcock C E.Estimating tree crown size from multiresolution remotely sensed imagery[J]. Photogrammetric Engineering & Remote Sensing. 2003,69(11):1263-1270.The spatial arrangement of the brightness values of remotely sensed imagery bears important information for forest canopy structures. This paper presents the theory and a simple analytical model to estimate tree crown size using sills of semivariograms from images at two spatial resolutions. The theoretical basis for the model is that the spatial patterns of multiresolution imagery are diagnostic of tree size. The sills of variograms from images containing larger trees decrease more slowly than those for images containing smaller trees as the image spatial resolution decreases. Tests with generated images, integrated simulation of stand development and its spatial patterns, and Ikonos images show that the model can provide realistic estimates of tree crown size. Errors of the estimated crown size strongly depend on the spatial resolutions of the images. The best combination of spatial resolutions is at the ratio of pixel size to the object size around unity.

DOI

[20]
Cohen W B, Spies T A, Bradshaw G A.Semivariograms of digital imagery for analysis of conifer canopy structure[J]. Remote Sensing of Environment, 1991,34(3):167-178.

[21]
赵英时. 遥感应用分析原理与方法[M].北京:科学出版社,2013.

[Zhao Y S.Principles and methods of remote sensing application analysis[M]. Beijing: Science Press, 2013. ]

[22]
Garrigues S, Allard D, Baret F, Weiss M.Quantifying spatial heterogeneity at the landscape scale using variogram models[J]. Remote Sensing of Environment, 2006,103(1):81-96.This work provides a methodology to characterize and quantify the spatial heterogeneity of landscape vegetation cover from the modeling of the variogram of high spatial resolution NDVI data. NDVI variograms for 18 landscapes extracted from the VALERI database show that the land use is the main factor of spatial variability as quantified by the variogram sill. Crop sites are more heterogeneous than natural vegetation and forest sites at the landscape level. The integral range summarizes all structural parameters of the variogram into a single characteristic area. Its square root quantifies the mean length scale (i.e. spatial scale) of the data, which varies between 216 and 1060m over the 18 landscapes considered. The integral range is also used as a yardstick to judge if the size of an image is large enough to measure properly the length scales of the data with the variogram. We propose that it must be smaller than 5% of the image surface. The theoretical dispersion variance, computed from the variogram model, quantifies the spatial heterogeneity within a moderate resolution pixel. It increases rapidly with pixel size until this size is larger than the mean length scale of the data. Finally based on the analysis of 18 landscapes, the sufficient pixel size to capture the major part of the spatial variability of the vegetation cover at the landscape scale is estimated to be less than 100m. Since for all the heterogeneous landscapes the loss of NDVI spatial variability was small at this spatial resolution, the bias generated by the intra-pixel spatial heterogeneity on non-linear estimation processes will be reduced.

DOI

[23]
Carr J R, Benzer W B.On the practice of estimating fractal dimension[J]. Mathematical Geosciences, 1991,23(7):945-58.Coastlines epitomize deterministic fractals and fractal (Hausdorff-Besicovitch) dimensions; a divider [compass] method can be used to calculate fractal dimensions for these features. Noise models are used to develop another notion of fractals, a stochastic one. Spectral and variogram methods are used to estimate fractal dimensions for stochastic fractals. When estimating “fractal dimension,” the objective of the analysis must be consistent with the method chosen for fractal dimension calculation. Spectal and variogram methods yield fractal dimensions which indicate the similarity of the feature under study to noise (e.g., Brownian noise). A divider measurement method yields a fractal dimension which is a measure of complexity of shape.

DOI

[24]
Li H, Reynolds J F.On Definition and quantification of heterogeneity[J]. Oikos, 1987,73(2):280-284.

[25]
黄华富,戴文远,苏木兰,等. 海岛生态脆弱区土地利用程度空间格局演化——以福建省海坛岛为例[J].福建师大学报(自然科学版),2016(2):92-100.基于海坛岛2000年、2005年、2009年和2013年4期Landsat ETM+遥感影像及野外调查等数据,应用空间自相关和半变异函数分析方法,分析海坛岛13 a间的土地利用程度空间格局演化特征.结果表明:海坛岛土地利用程度具有较强的正相关性,随着空间尺度的增大,空间自相关性逐渐减弱;2000年、2005年土地利用程度热点区主要以斑块状分布在乡镇行政中心辐射范围区域,冷点区零星分布在海岛四周;而2009年、2013年冷热点区的空间集聚性明显增强,热点区主要集聚于潭城镇区域和北厝镇以及162县道沿线,冷点区集聚于君山风景区以及芦南滩涂水面区域;研究期内土地利用程度具有较明显的空间异质性,空间变异程度显著增强,土地利用方向性结构变化明显,土地利用优势格局由2000年、2005年呈东-西轴向转变为2009年、2013年的南-北轴向;海坛岛土地利用程度主要以较强和中等土地利用为主,受中心城区和交通干线扩展的联合作用,研究期间土地利用程度总体呈上升趋势.

[Huang H F, Dai W Y, Su M L, et al. Evolvement of spatial pattern of land use degree in Island Ecologically Fragile Zones: A case study of Haitan Island[J]. Journal of Fujian Normal University(Natural Science Edition), 2016(2):92-100. ]

[26]
Lantuéjoul C.Geostatistical simulation. Models and algorithms[J]. Minerva Ginecologica. 2002,39(7-8):503-510.Guerrini S, Marietta G, Ferreri G.

DOI

[27]
温兆飞,张树清,白静,等.农田景观空间异质性分析及遥感监测最优尺度选择——以三江平原为例[J].地理学报,2012,67(3):346-56.农情遥感监测需要高时间分辨率的遥感数据,目前这些数据大都为中 低空间分辨率影像.在这些尺度下,像元内部往往是异质的,从而影响农情参数反演精度.因此分析和表达农田景观空间异质性和最优尺度选择对遥感农情监测质量 的提高具有重要的应用价值.选取建三江农垦区四种典型农田景观为研究点,Landsat/TM NDVI为实验数据,利用实验变异函数对四种景观类型的各向空间异质性进行了分析,而后通过变异函数模型拟合,定量分析了各个研究点的整体空间异质性,并 在此基础上进行了研究区遥感监测最优尺度选择.研究表明:(1)基于实验变异函数的结构分析方法,可定性地认识空间异质性的大小和方向,进而挖掘出其背后 的自然和人为驱动因素.(2)对实验变异函数进行拟合分析,可定量地刻画不同景观格 局各自的空间异质性特性.此外,基于变异函数对空间异质性的定量表达,讨论了利用积分变程A结合Nyquist-Shannon采样定理进行最优尺度选择 的方法.

DOI

[Wen Z F, Zhang S Q, Bai J, et al.Agricultural landscape spatial heterogeneity analysis and optimal scale selection: An example applied to Sanjiang Plain[J]. Acta Geographica Sinica, 2012,67(3):346-356. ]

[28]
Dolan S S, Bean C J, Riollet B.The broad-band fractal nature of heterogeneity in the upper crust from petrophysical logs[J]. Geophysical Journal International, 1998,132(3):489-507.Abstract In situ measurements of petrophysical properties of the upper crust from wire-line logs provide a direct means of assessing fluctuations in these properties with depth, and thus allow for the statistical characterization of crustal heterogeneity. Wire-line logs from a cluster of nine boreholes (1000–1500 m deep) have been analysed using four different techniques: autocorrelation, semi-variogram, rescaled range and power spectra. Six of the boreholes are vertical, the remainder inclined. All penetrate clastic and pyroclastic rock. The analysis techniques have been tested on synthetic data, for which we have precise control on the scaling, in order to assess their robustness. The results, for the borehole data, show broad-band fractal scaling with a fractal dimension of 1.62 to 1.97 (autocorrelation), 1.59 to 1.79 (rescaled range) and 1.61 to 2.0 (power spectra). The use of different techniques to estimate the fractal dimension provides an excellent constraint on the results. Furthermore, it allows us to determine which model for crustal heterogeneity best describes the data: a ‘band-limited’ von Kármán function or ‘unbounded’ fractal scaling. In order to test the possible anisotropy in the scaling parameters, the horizontal scaling properties for this area have been calculated by correlation-spectra analysis of neighbouring wells. This suggests that upper-crustal correlation lengths are of the order of kilometres and anisotropic, being over four times greater in the horizontal direction. The origins of the observed power-law scaling are complex. Analysis of long-term correlations between logs and televiewer data points towards the influence of fracture porosity within the pyroclastics. But a fractal distribution of pore spaces within the clastics also controls the log fluctuations. Separating the logs into clastic and pyroclastic subsets reveals slight differences in fractal scaling, as determined by autocorrelation and semi-variogram. These differences are attributed to the dominance of either primary or fracture porosity within each geological unit.

DOI

[29]
Colombo S, Chica-Olmo M, Abarca F, Eva H.Variographic analysis of tropical forest cover from multi-scale remotely sensed imagery[J]. Isprs Journal of Photogrammetry & Remote Sensing, 2004,58(5-6):330-341.ABSTRACT Tropical forest mapping is one of the major environmental concerns at global and regional scales in which remote sensing techniques are firmly involved. This study examines the use of the variogram function to analyse forest cover fragmentation at different image scales. Two main aspects are considered here: (1) analysis of the spatial variability structure of the forest cover observed at three different scales using fine, medium and coarse spatial resolution images; and (2) the study of the relationship between rescaled images from the finest spatial resolution and those of the medium and coarse spatial resolutions. Both aspects are analysed using the variogram function as a basic tool to calculate and interpret the spatial variability of the forest cover. An example is presented for a Brazilian tropical forest zone using satellite images of different spatial resolutions acquired by Landsat TM (30 m), Resurs MSU (160 m) and ERS ATSR (1000 m). The results of this study contribute to establishing a suitable spatial resolution of remotely sensed data for tropical forest cover monitoring.

DOI

[30]
Garrigues S, Allard D, Baret F, Morisette J.Multivariate quantification of landscape spatial heterogeneity using variogram models[J]. Remote Sensing of Environment, 2008,112(1):216-230.Finally, the linear model of coregionalization applied to red and near infrared is shown to be more powerful than the univariate variogram modeling applied to NDVI because the second order stationarity hypothesis on which variogram modeling relies is more frequently verified for red and near infrared than for NDVI.

DOI

[31]
张雪艳,胡云锋,庄大方,等.蒙古高原NDVI的空间格局及空间分异[J].地理研究,2009,28(1):10-18.基于GIMMS NDVI多年最大值合成数据,采用空间统计学方法,利用Moran’s I系数分析、半变异函数分析以及分维分析等3种方法,对蒙古高原NDVI空间格局及空间分异特征进行研究。结果表明:(1)蒙古高原NDVI的空间分布在全局范围内呈现正的空间自相关,相似的NDVI值倾向于聚集在一起,这表明蒙古高原植被具有较好的整体性,地表植被无显著破碎化;(2)蒙古高原NDVI的空间分布虽然同时受到结构性因子和随机性因子的影响,但结构性因子占据绝对控制地位,结构性因子引起的空间变异占系统总变异的88.7%;(3)蒙古高原NDVI存在各向异性的分布特征,具有相似NDVI值的像元主要沿着西北-东南方向展布;全局NDVI空间自相关距离约为1178km,西北-东南方向与东北-西南方向的空间自相关距离比可达2.4∶1。

DOI

[Zhang X Y,Hu Y F, Zhuang D F, et al.The spatial pattern and differentiation of NDVI in Mongolia Plateau[J]. Geographical Research, 2009,28(1):10-18. ]

[32]
曾宏达. 基于DEM和地统计的森林资源空间格局分析——以武夷山山区为例[J].地球信息科学,2005,7(2):82-88.鉴于森林资源空间分布与地形的紧密相关,本文采用DEN与地统计学方法探讨武夷山森林主要树种蓄积量的空间格局。研究结果表明,地带性植被阔叶树由于受人为干扰趋向分布于高海拔、坡度陡的山地:杉木林在长年人工经营的过程中,逐渐占据林分的首要地位,因此主要分布在500m以下的低山丘陵:马尾松适生性较广,且明显倾向分布于(半)阳坡。地统计的分析发现各向同性的块金方差与基台值之比为0.5,即随机因素和空间自相关引起的空间异质性均各占一半,变程约24kin。在各向异性的变异中,0°和45°方向的曲线变化规律一致,随着空间距离的增加,半变异函数上升,达到基台值附近趋平,但90°和135°方向上,曲线的斜率则急剧上

DOI

[Zeng H D.Application of digital terrain information and geostatistics to forest spatial pattern analysis: A case on Wuyi Mt. Area[J]. Journal of Geo-Information Science, 2005,7(2):82-88. ]

[33]
Tandeo P, Autret E, Chapron B, Fablet R, Garello R.SST spatial anisotropic covariances from METOP-AVHRR data[J]. Remote Sensing of Environment, 2014,141(4):144-158.The Advanced Very High Resolution Radiometer (AVHRR) instrument on-board the METOP satellite is designed to provide very accurate measurements of Sea Surface Temperature (SST). In this work, using one year of METOP-AVHRR data and a geostatistical approach, we characterize the spatial anisotropy and non-stationarity of the SST variability using oriented ellipsoids. The method is also able to separate the true SST variability from the artificial error introduced by the METOP-AVHRR sensor. These spatial parameters are then used for producing variability atlases (available on-line) over the whole ocean.

DOI

[34]
Atkinson P M, Curran P J.Choosing an appropriate spatial resolution for remote sensing investigations[J]. Photogrammetric Engineering & Remote Sensing, 1997,63(12):1345-1351.Choosing rationally the spatial resolution for remote sensing requires a formal relation between the size of support and some measure of the information content. The local variance in the image has been used to help choose an appropriate spatial resolution. Here we choose spatial resolutions to map continuous variation in properties, such as biomass, using the variogram. The experimental variogram can be separated into components of underlying spatially dependent variation and measurement error. The spatially dependent component can be deregularized to a punctual support, and then regularized to any spatial resolution. The regularized variogram summarizes the information attainable by imaging at that spatial resolution because information exists in the relations between observations only. The investigator can use it to select a combination of spatial resolution and method of analysis for a given investigation. Two examples demonstrate the method.

DOI

[35]
Ozdogan M, Woodcock C E.Resolution dependent errors in remote sensing of cultivated areas[J]. Remote Sensing of Environment, 2006,103(2):203-217.Remote sensing has become a common and effective method for estimating the areal coverage of land cover classes. One class of particular interest is agriculture as area estimates of cultivated lands are important for purposes such as estimating yields or irrigation needs. The synoptic coverage of satellite imagery and the relative ease of automated analysis have led to widespread mapping of agriculture using remote sensing. The accuracy of area estimates derived from these maps is known to be related to the accuracy of the maps. However, even in the situation where the map is very accurate, errors in area estimates may occur. These errors result from the behavior of the distribution of subpixel proportions of cultivated areas, and how that behavior changes as a result of sensor spatial resolution and class definitions. The sensitivity of estimates of cultivated areas to sensor spatial resolution and to the choice of threshold used to define cultivated land is explored in six agriculturally distinct locations around the world. Using a beta model for the distribution of subpixel proportions that is parameterized using variograms, it is possible to model the distribution of subpixel proportions for any spatial resolution. When the spatial resolution is small with respect to the spatial structure of the landscape (as measured by the variogram range) use of any class definition threshold produces an estimate very close to the true area coverage. On the other hand, as the resolution becomes coarse in relation to the variogram range, the subpixel proportions are no longer concentrated at the extremes of the distribution and the difference between the estimated and the true area has greater sensitivity to the selected threshold used to define classes. Thus, for the cases examined here, both the resolution and the class definition threshold have a strong influence on area estimates. The spatial resolutions where errors can be large depend on landscape spatial structure, which can be quantified using variograms. The net effect is that for the same spatial resolution, some places will exhibit much larger errors in area estimates than others. For the site in the Anhui province of China, where agricultural fields are very small (0.07 ha on the average), area estimates are highly sensitive to class definition thresholds even at the relatively fine resolution of 45 m. Conversely, in California (USA) spatial resolutions as coarse as 500 m can be used to reliably estimate cultivated areas. Results also suggest that the proportion of the total area that is cultivated significantly influences the accuracy of area estimates. When the area proportion is low, the class definition threshold must also be low to achieve an accurate area estimate. Conversely, in areas dominated by agriculture, a very stringent class definition of cultivated lands is required for accurate area estimates. While explored in the context of estimation of cultivated areas, the findings presented here are generic to the problem of area estimation using remote sensing.

DOI

[36]
明冬萍,邱玉芳,周文.遥感模式分类中的空间统计学应用——以面向对象的遥感影像农田提取为例[J].测绘学报,2016,45(7):825-33.如何有效地从遥感图像中提取所需信息,是遥感图像处理和应用的关键,而尺度选择问题一直是影响遥感信息提取精度的关键问题之一。本文论述了利用空间统计学方法解决遥感影像模式分类中的尺度问题的理论基础。针对面向对象影像分析问题,将影响遥感影像多尺度分割的尺度分割参数概括为空间属性分割参数、光谱属性分割参数和影像对象面积阈值参数,并分别提出了基于统计学的尺度参数估计方法。以SPOT-5影像面向对象农田提取为例,基于变异函数方法进行了尺度优选试验,系列尺度分类试验结果表明基于空间统计学尺度估计得到的尺度分割结果进行分类能得到最高的精度,进而证明了基于空间统计学方法进行面向对象信息提取尺度估计的有效性。该方法是完全数据驱动的方法,基本不需要先验知识参与。不同于以往分割后评价的尺度选择方法会占用大量计算资源且耗费大量时间,本文提出的方法不仅能在一定程度上保证面向对象信息提取的精度,而且在一定程度上也提高了面向对象信息提取的效率和自动化程度。

DOI

[Ming D P, Qiu Y F, Zhou W.Applying spatial statistics into remote sensing pattern recognition: A case study of cropland extraction based on GeOBIA[J]. Acta Geodaetica et Cartographica Sinica, 2016,45(7):825-33. ]

[37]
Ming D, Ci T, Cai H, et al.Semivariogram-based spatial bandwidth selection for remote sensing image segmentation with mean-shift algorithm[J]. IEEE Geoscience & Remote Sensing Letters, 2012,9(5):813-817.Image segmentation is a key procedure that partitions an image into homogeneous parcels in object-based image analysis (OBIA). Scale selection in image segmentation is always difficult for high-performance OBIA. This letter is aimed at scale selection before segmentation in OBIA and proposes a spatial statistics-based spatial bandwidth selection method based on mean-shift segmentation. This study uses Ikonos and Quickbird panchromatic images as the experimental data and then computes their semivariances to select the optimal spatial bandwidth for mean-shift segmentation. To validate this method and interpret the relationship between the semivariances and segmentation scale, this letter implements an image segmentation evaluation based on the homogeneity within and the heterogeneity between the segmentation parcels. The evaluation results basically support the proposed scale selection method based on the semivariogram. Consequently, the semivariogram-based spatial bandwidth selection method is practically meaningful for pre-estimating the appropriate scale and thus contributes to improving the performance and efficiency of OBIA.

DOI

[38]
Morisette J T, Nickeson J E, Davis P, et al. Woodcock C E, et al. High spatial resolution satellite observations for validation of MODIS land products: IKONOS observations acquired under the NASA scientific data purchase[J]. Remote Sensing of Environment, 2003,88(1):100-110.ABSTRACT Phase II of the Scientific Data Purchase (SDP) has provided NASA investigators access to data from four different satellite and airborne data sources. The Moderate Resolution Imaging Spectrometer (MODIS) land discipline team (MODLAND) sought to utilize these data in support of land product validation activities with a focus on the EOS Land Validation Core Sites. These sites provide a globally distributed network of sites where field, aircraft, and satellite data are being collected. As much as possible, uniform data sets useful for validation are being made available for the core sites. The globally consistent, high-resolution imagery available from IKONOS are being used for their geolocation accuracy and ability to characterize the landscape at the 1- to 4-m spatial resolution. This paper provides an overview of the MODIS Land Team's validation strategy to incorporate high-resolution imagery and presents three case studies as examples of the use of IKONOS data for MODIS land validation activities. We conclude that the globally consistent data from IKONOS, available through NASA's SDP, have supplied critical validation data sets at a reasonable cost.

DOI

[39]
韩鹏,龚健雅.遥感尺度选择问题研究进展[J].遥感信息,2008(1):96-99.尺度效应是遥感应用分析中的一个重要因素,直接影响遥感分析的效果.遥感尺度选择问题已经引起国际遥感界的高度重视.本文首先明确了遥感尺度选择问题的范畴;然后分析了当前遥感尺度选择的方法,并对已有的方法进行了评价;最后就遥感尺度选择的研究方向给出了一些建议.

DOI

[Han P, Gong J Y.A review on choice of optimal scale in Remote Sensing[J]. Remote Sensing Information, 2008,1:96-99. ]

[40]
陈春雷,武刚.多源遥感影像的最优尺度选择[J].浙江农林大学学报,2011,28(1):164-72.遥感信息普遍存在着尺度效应,合适的空间分辨率可以反映特定目标 的空间结构特性.基于地理学第一规律,选择了目前主要采用的2种方法--局部变异和变异函数对最优尺度的选择进行研究.并针对传统方法的局限性提出了改进 方案.通过同一地区的遥感卫星Landsat 7,Spot-5/HRG和QuicBird遥感影像,对不同的景观区域采用不同的方法进行了比较研究.根据实验,得出了局部变异适合微观、变异函数则更 适用于宏观问题的结论,并得到了不同数据源在不同景观类型下的最优尺度.最后,根据最优尺度选择的结果,讨论了不同数据源的适用性.图4表4参19

DOI

[Chen C L, Wu G.Choice of optimal scale for multi-source remote sensing images[J]. Journal of Zhejiang A & F University, 2011,28(1):164-72. ]

[41]
Chica-Olmo M, Abarca-Hernández F.Computing geostatistical image texture for remotely sensed data classification[J]. Computers & Geosciences, 2000,26(4):373-83.Most classical mathematical algorithms for image classification do not usually consider the spectral dependence existing between a pixel and its neighbours, i.e., spatial autocorrelation. Thus, it would be advisable for discrimination of landcover classes to add to the radiometric bands of the sensor complementary information related to the textural features of an image, which can be analysed from the autocorrelation spatial structure of the digital numbers. In this way, the results obtained from pixel-by-pixel classifiers simultaneously taking into account both radiometric and texture information could be improved. This improvement would arise from the hypothesis that a pixel is not independent of its neighbours and, furthermore, that its dependence can be quantified and incorporated into the classifier. In this paper we present a methodology based on computing a set of univariate and multivariate textural measures of spatial variability based on several variogram estimators. Madogram and direct variogram for the univariate case, and cross and pseudo-cross variograms for the multivariate one, have been proposed. These measures are calculated for a specific lag of distance in a neighbourhood using a moving window on the two most representative principal components of the radiometric bands, enabling us to quantify the spatial variability of radiometric data at a local level. A computer program has been written to create a multiband image texture as output file that can be used within the classification process as additional information. An application of this methodology to lithological discrimination is presented using a Landsat-5 TM image.

DOI

[42]
RAMSTEIN G, RAFFY M.Analysis of the structure of radiometric remotely-sensed images[J]. International Journal of Remote Sensing, 1989,10(6):1049-1073.Despite their apparent complexity, remotely-sensed images present a simple structure specific to the remotely-sensed field. Using the concepts of variogram and fractal dimension, this paper proposes a classification of the textures of images based on simple models. Applications are given to segmentation and resampling.

DOI

[43]
Coburn C A, Roberts A C B. A multiscale texture analysis procedure for improved forest stand classification[J]. International Journal of Remote Sensing, 2004,25(20):4287-4308.ABSTRACT Image texture is a complex visual perception. With the ever-increasing spatial resolution of remotely sensed data, the role of image texture in image classification has increased. Current approaches to image texture analysis rely on a single band of spatial information to characterize texture. This paper presents a multiscale approach to image texture where first and second-order statistical measures were derived from different sizes of processing windows and were used as additional information in a supervised classification. By using several bands of textural information processed with different window sizes (from 565 to 15615) the main forest stands in the image were improved up to a maximum of 40%. A geostatistical analysis indicated that there was no single window size that would adequately characterize the range of textural conditions present in this image. A number of different statistical texture measures were compared for this image. While all of the different texture measures provided a degree of improvement (from 4 to 13% overall), the multiscale approach achieved a higher degree of classification accuracy regardless of which statistical procedure was used. When compared with single band texture measures, the level of overall improvement varied between 4 and 8%. The results indicate that this multiscale approach is an improvement over the current single band approach to analysing image texture.

DOI

[44]
黄艳,张超,苏伟,等.合理尺度纹理分析遥感影像分类方法研究[J].国土资源遥感,2008(4):14-17.纹理分析是提高遥感影像分类精度的重要手段之一。纹理特征与地物类别尺度密切相关,应用纹理特征进行遥感影像分类,关键在于纹理尺度的确定。对于灰度共生矩阵纹理分析来说,就是选择大小合适的纹理窗口。根据样本半变异值在较小范围内有较大变化的特性,研究遥感影像相邻像素之间的空间关系,将半变异值开始趋于恒值时所对应的步长作为纹理分析的窗口大小,并在纹理特征提取过程中针对每一个像素,在最大似然分类结果的约束下,适时改变窗口大小,提取纹理特征,提出一种合理尺度纹理分析的遥感影像分类方法。最后,选择北京市昌平区2006年SPOT 5遥感影像,利用TitanIm age二次开发环境实现了该方法。实践证明,该方法能有效提高遥感影像的分类精度。

DOI

[Huang Y,Zhang C, Su W, et al.A study of the optimal scale texture analysis for remote sensing image classification[J]. Remote Sensing for Land & Resources, 2008,4:14-17. ]

[45]
Franklin S E, Wulder M A, Lavigne M B.Automated derivation of geographic window sizes for use in remote sensing digital image texture analysis[J]. Computers & Geosciences, 1996,22(96):665-673.In digital image processing of remotely sensed data, texture analysis, filtering, and edge detection techniques, among others, may be improved through the use of variable window sizes which extend the analysis beyond the immediate pixel to a larger geographic area. In this paper, semivariograms are used to generate geographic windows, which are customized to the scale of observation. Three examples are used to illustrate the improvements over the use of arbitrarily selected fixed geometric windows in remote estimation of forest inventory, forest structure characteristics, and in land-cover classification. A program to handle the semivariance calculations is described. The code was written in the C programming language under AIX-Unix on an IBM RISC 6000 24-bit color workstation to support a common pixel-interleaved digital image format, and has been tested on optical and radar remote sensing imagery in three mapping studies.

DOI

[46]
廖楚江,王长耀,林文鹏.基于地质统计学影像纹理的海南沙漠化监测研究[J].中国沙漠,2006,26(6):926-31.海南省东部地区在沙漠化监测上呈现两大难点:一是海滩沙地与沙漠化土地在影像上呈现近乎相同的光谱特征,基于传统的遥感影像光谱分类方法无法得到实际的沙漠化面积;二是该地区属于热带沿海地区,常规的监测指标体系与实际情况相去甚远,必须寻求其他的手段来进行沙漠化程度的分级。基于不同沙地类型在地表空间结构上的差异,本文提出将地质统计学纹理方法应用到沙漠化监测中,通过变异函数纹理来加大各种不同类别沙地间的区别,提高样本选择的分离度。结果表明,运用变异函数纹理结合光谱波段的最大似然分类方法能够很好地界定海滩沙地和沙漠化土地的不同等级,依据分类结果计算得到的沙漠化土地面积与统计数据吻合较好,总精度达到92.4%,证明了地质统计学纹理在实现该地区遥感沙漠化监测方面的有效性,同时也为其他地区沙漠化监测找到一个可资借鉴的方法。

DOI

[Liao C J, Wang C Y, Lin W P.Research on desertification monitoring for Hainan province based on geostatistical texture[J]. Journal of Desert Research, 2006,26(6):926-931. ]

[47]
王鹤霖,范文义,赵妍,等. 基于纹理信息的森林类型遥感识别技术[J].东北林业大学学报, 2013(6):50-54.为提高大区域 TM 影像对针阔混交林的识别精度,充分考虑遥感影像像元值的随机性和空间性,以盘古林场有林地 TM 遥感影像为例,结合地统计学知识,利用变异函数计算图像纹理信息,分析了影像纹理信息提取的重要因子,确定选取绝对变差函数为计算方法,以9×9像元为窗 口,4像元为步长,计算方向为全方向对盘古林场有林地部分提取纹理信息并与原始光谱信息及归一化植被指数相结合,采用经典分类器最大似然法对影像进行分 类。结果表明,辅以纹理信息的最大似然法分类精度为85.3333%,Kappa 指数为0.78,达到了区别针阔混交林的目的。

DOI

[Wang H L, Fan W Y, Zhao Y, et al.Remote sensing identification on forest types based on texture information[J]. Journal of Northeast Forestry University, 2013,6:50-54. ]

[48]
Berberoglu S, Curran P J, Lloyd C D, Atkinson P M.Texture classification of Mediterranean land cover[J]. International Journal of Applied Earth Observation & Geoinformation, 2007,9(3):322-334.Abstract Maximum likelihood (ML) and artificial neural network (ANN) classifiers were applied to three Landsat Thematic Mapper (TM) image sub-scenes (termed urban, agricultural and semi-natural) of Cukurova, Turkey. Inputs to the classifications comprised (i) spectral data and (ii) spectral data in combination with texture measures derived on a per-pixel basis. The texture measures used were: the standard deviation and variance and statistics derived from the co-occurrence matrix and the variogram. The addition of texture measures increased classification accuracy for the urban sub-scene but decreased classification accuracy for agricultural and semi-natural sub-scenes. Classification accuracy was dependent on the nature of the spatial variation in the image sub-scene and, in particular, the relation between the frequency of spatial variation and the spatial resolution of the imagery. For Mediterranean land, texture classification applied to Landsat TM imagery may be appropriate for the classification of urban areas only.

DOI

[49]
李培军,李争晓.三种地统计学图像纹理用于遥感图像分类的比较[J].地理与地理信息科学,2003,19(4):89-92.该文运用LANDSAT TM数据对三种地统计学纹理量测方法用于图像分类的性能进行了比较和分析.研究发现,基于绝对值变差函数的纹理具有更好的性能.经典的变差函数和基于方根的变差函数的性能依赖于提取纹理时所用的窗口大小.

DOI

[Li P J, Li Z X.Comparison of three geostatistical texture measures for remotely sensed data classification[J]. Geography and Geo-Information Science, 2003,19(4):89-92. ]

文章导航

/