地球信息科学理论与方法

基于空间自相关和概率论的土壤重金属异常值的 识别方法

  • 王景云 , 1 ,
  • 杨军 , 2, * ,
  • 杨俊兴 2 ,
  • 雷梅 2 ,
  • 万小铭 2 ,
  • 周小勇 2 ,
  • 陈同斌 2 ,
  • 张红日 1 ,
  • 赵相伟 1
展开
  • 1. 山东科技大学测绘科学与工程学院,青岛 266590
  • 2. 中国科学院地理科学与资源研究所 环境修复研究中心,北京 100101
*通讯作者:杨 军(1979-),男,河南信阳人,博士,副研究员,研究方向为土壤污染修复区划。E-mail:

作者简介:王景云(1990-),男,山东临沂人,硕士生,研究方向为地理环境演化与分析。E-mail:

收稿日期: 2016-09-23

  要求修回日期: 2016-11-01

  网络出版日期: 2017-05-20

基金资助

国家自然基金面上项目“同位素标识蜈蚣草对Pb污染土壤修复的调控机理探索”(41271478)

国家“863”课题“土壤重金属污染现场监测技术与设备”(2014AA06A513)

A Method for Detecting Outliers of Soil Heavy Metal Data Based on Spatial Autocorrelation and Probability Theory

  • WANG Jingyun , 1 ,
  • YANG Jun , 2, * ,
  • YANG Junxing 2 ,
  • LEI Mei 2 ,
  • WAN Xiaoming 2 ,
  • ZHOU Xiaoyong 2 ,
  • CHEN Tongbin 2 ,
  • ZHANG Hongri 1 ,
  • ZHAO Xiangwei 1
Expand
  • 1. College of Geomatics, Shandong University of Science and Technology, Qingdao 266590, China
  • 2. Center for Environmental Remediation, Institute of Geographic Sciences and Natural Resources Research, Chinese Academy of Sciences, Beijing 100101, China
*Corresponding author: YANG Jun, E-mail:

Received date: 2016-09-23

  Request revised date: 2016-11-01

  Online published: 2017-05-20

Copyright

《地球信息科学学报》编辑部 所有

摘要

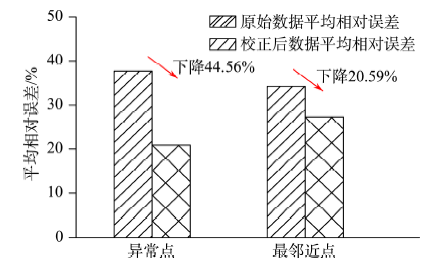
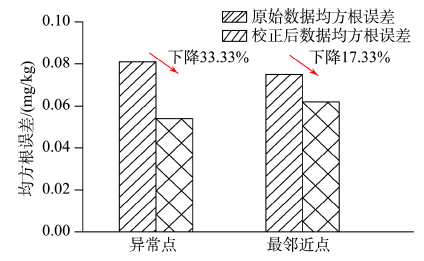
数据是开展土壤环境质量研究的基础,在实验过程中,由于系统误差和人为误差导致数据异常、降低数据质量,进而对污染评价、修复与管理决策等后续工作带来误判。目前对于此方面缺乏深入的研究和探讨。基于此,本研究提出一种甄别土壤重金属异常数据的方法,并以北京市土壤Cd含量数据为例,对该方法的有效性进行了验证。结果显示,北京市651个土壤Cd数据中有34个数据异常,对甄别出的异常数据进行化学复测,发现76.5%的Cd异常数据(26个)为系统误差和人为误差导致;20.6%的异常数据(7个)为客观存在的异常点。将原始数据修正后,插值预测精度得到了显著提高。Cd异常数据自身的平均相对误差下降44.56%,均方根误差降低33.33%;受异常值影响的邻近点平均相对误差下降20.59%,均方根误差降低17.33%。结果表明本方法可以有效识别出土壤重金属数据中的异常数据,在增加有限样本量和分析时间的前提下提高调查数据质量,为开展区域土壤调查,保障数据质量提供有效的工具。

本文引用格式

王景云 , 杨军 , 杨俊兴 , 雷梅 , 万小铭 , 周小勇 , 陈同斌 , 张红日 , 赵相伟 . 基于空间自相关和概率论的土壤重金属异常值的 识别方法[J]. 地球信息科学学报, 2017 , 19(5) : 605 -612 . DOI: 10.3724/SP.J.1047.2017.00605

Abstract

Data was the basis of carrying out the research on environmental quality of the soil. However, in the experimental process, the systematic errors and artificial errors may lead to some outliers, which may reduce the data quality and cause erroneous judgement for pollution assessment and management decision. At present, there was a lack of thorough study and exploration in this respect. Based on this, a method for detecting outliers of soil heavy metal data was put forward in this study. The soil Cd concentration of Beijing in China was taken as an example to verify the validity of the method. The results show that there are 34 outliers for Cd concentration in Beijing. The detected outliers in Beijing were re-analysed. The results showed that 76.5% of the outliers were found to be caused by the systematic errors and artificial errors and 20.6% of the outliers existed, objectively. After the correction, the interpolation accuracy was improved significantly. The mean relative error and mean square error of the outliers were reduced by 44.56% and 33.33%, respectively. Also, the mean relative error and mean square error of the nearest neighboring points which are influenced by the outliers were reduced by 20.59% and 17.33%, respectively. Results indicated that the outliers of soil heavy metal could be effectively detected by the proposed method. Under the premise of adding finite sample size and analysis time, the quality of the survey data was improved and an effective tool was provided to carry out soil investigation at regional scale and guarantee the data quality.

1 引言

随着工业化发展,人类生产、生活过程中产生了大量重金属污染物,这些污染物通过污水灌溉、大气沉降以及固体废弃物堆置等方式进入到土壤中,导致土壤污染[1-2]。土壤重金属通过食物链进入农产品,导致农产品超标,严重威胁暴露人群的健康[3-6]。因此开展土壤重金属污染调查,评估其污染风险受到广泛关注。陈同斌等通过采集58个香港表层土壤样评价其土壤环境质量,发现Cd含量较高区域主要分布在森林和蔬菜用地,Pb、As和Zn高含量区域主要分布在城市和果园用地,Cu、Zn高含量区域主要分布在森林、蔬菜和果园用地[7];Lu等在北京市顺义采集412个农田土壤样点进行调查分析发现Cd、Cu、Hg和Zn的高值区域主要分布在北京市顺义的南部,As和Pb含量较高的区域主要分布在北京市顺义的四周[8];Kelepertzis分析了132个地中海农田土壤重金属含量,发现Cu、Cd、Zn、Pb和As等元素高含量区域主要分布在地中海的西部[9]等。
土壤重金属污染调查主要基于重金属含量数据开展,数据的质量直接影响污染评价结论。重金属含量数据通过一系列化学分析获取,在实验分析过程中,由于人为或系统误差会导致与实际客观情况不符的异常数据[10],人为误差主要包括在一系列实验过程中由于人为操作失误以及各种偶然因素导致的误差,系统误差主要是仪器设备测量重金属含量时所带来的误差[11],如分析测试过程中仪器预热时间、仪器参数的设定以及实验耗材的选择等均会对测定结果产生影响。这些错误数据常规方法很难识别。通过增加样品测试平行可有效降低异常数据出现的概率,但相应会增加测试成本和分析时间。因此,需要一种快速识别土壤重金属含量数据中异常数据的方法。
目前甄别土壤重金属数据异常值的方法主要基于空间自相关性理论或极差法建立。空间自相关理论认为土壤重金属含量在水平空间上的变化是连续的,如果在低值区域范围内出现一个高值或在高值区域内出现一个低值,则认为该点有可能是异常数据[12]。空间自相关理论认为土壤变量在空间上是连续的,实际情况下,由于局部污染源的存在会导致土壤重金属数据在空间水平上并不一定连续,形成局部异常的现象。如张朝生等利用局部空间自相关理论对爱尔兰高威城市土壤Pb含量数据进行研究,对识别出的7个空间异常值进行复测发现 7个土壤重金属异常数据是客观存在的[13]。这些客观存在的局部异常点一旦被识别为异常数据,将增加复测成本和时间。极差法根据均值±n倍标准差进行异常值筛选[14]。利用极差法进行异常值甄别具有一定的局限性,当局部区域多个样点均为极端高值或极端低值,被认定为异常值,对识别出的“异常值”执行删除操作[15-16],但在土壤重金属污染调查过程中,由于土壤背景差异,这些“异常值”实际存在,不应该随意剔除[17]。由于单一校验方法存在不同程度的不足,无法满足土壤重金属异常数据的识别要求,为提高土壤重金属数据中异常数据的甄别效率,减少复测成本和时间,本研究提出空间自相关法和极差法联合甄别土壤重金属数据中的异常数据,并通过实例数据进一步验证该联合方法的识别效率,目前这种思路尚未报道。

2 数据与处理方法

本方法的校验功能通过软件编程实现,软件采用C#语言进行编写,基于ArcEngine 10.2版本进行开发,软件操作流程大体包括输入数据、设定参数、进行校验、获取异常值等。数据格式支持Excel、Txt和Shapefile等。

2.1 数据

本研究以北京市土壤Cd含量数据(图1)为案例,进行异常数据的甄别,在此基础上对甄别出的异常数据进行复测,验证该联合方法的有效性。对北京市土壤Cd数据进行正态检验,发现Cd数据为偏正态分布,经对数转换后数据符合正态分布。
Fig. 1 Distribution of soil samples in Beijing

图1 北京市土壤采样点分布

2.2 校验方法

校验方法综合考虑空间自相关法和极差法2种方法的校验结果,以空间自相关法的校验结果为主,同时兼顾极差法,本研究中极差法包括数理统计校验、背景值校验2种方法。即待校验数据通过空间自相关法校验后为异常数据,同时该数据在极差法中的任意一种方法校验下也为异常数据,则该数据即被判定为异常数据。
空间自相关法是以空间变异理论为基础,对土壤重金属数据中的异常数据进行甄别。本文重点是识别空间上的离群数据,即与相邻区域差异性较大的点,本文选取相邻区域的10个点作为比较对象, Moran′I负值作为样点是否异常的参考值。在95%的置信区间内,局域空间变异系数小于Moran′I值的下限值,即认为该点数据属于异常数据。局域Moran′I值的计算公式如下[18]
I i = n ( x i - x ̅ ) j = 1 n W ij ( x j - x ̅ ) i = 1 n x i - x ̅ 2 (1)
式中:n为变量x的样点数量;xixj分别为位置i和位置j的数值; x ̅ 是所有数值的平均值;Wij是空间权重矩阵值。Moran’I的数值在-1到1之间,当Moran’I值为正数时,表明该样点重金属含量与其周边样点的含量相似,而且数值越大,相似程度越高,空间上呈现聚类;当Moran’I值为负数时,表明该点位重金属含量与周边样点的含量明显不同,而且数值越小,差异性越大,空间上异常程度越高。
数理统计校验根据概率论与数理统计的置信区间来界定异常值。根据概率论,当一组数据符合正态分布时,异常数值分布于正态分布的两端。依据3σ原则有:
P | x - u | > 2 σ < 0.044 (2)
P | x - u | > 3 σ < 0.003 (3)
约95.5%和99.7%的数据包含在以μ为中心的标准差σ的2倍和3倍范围内。数理统计方法按照这一原理,取待分析数据标准差的2倍作为判断数据是否偏离μ的节点,从而获取偏离置信区间下的异常数据。本研究中校验数据小于μ-2σ为低值异常点,大于μ+2σ为高值异常点。
背景值校验是基于先验知识结合概率论进行异常数据判断,选取研究区域土壤重金属背景值的上限和下限进行异常数据甄别。根据前人已开展的土壤环境质量调查数据,研究区域土壤重金属含量大致位于一定的范围,超过这一范围的概率较小。在本方法中,将所测数据与该地区土壤重金属背景值(上限和下限)进行比对,偏离该背景值范围内数据认定为异常数据。高于研究地区土壤重金属含量背景值上限(95%分位值)即为高值异常点,低于该地区土壤重金属含量背景值的下限(5%分位值)即为低值异常点。

2.3 异常点土壤Cd元素测定方法

对异常点土壤Cd元素含量进行复测,测定方法与土壤初始Cd含量数据测试方法一致[19]。将校验出的异常点土样分别称量0.2 g、利用HNO3和H2O2在电热板上进行加热消解,最后将样品溶液定容至50 ml。为保证样品测试数据的准确性和客观性,每个土壤样品分3份,分别由3个人独立测试,选取3人测试结果的平均值作为复测值。

2.4 插值预测精度评价

为评价校准后数据对空间插值预测精度的影响,将初始异常数据与复测更新后的数据分别进行插值预测,比较预测值与实测值之间的差异,评价异常数据校准前后对异常点以及异常点邻近点的预测精度。异常点邻近点选取受异常点影响最近的12个点进行评价。克里格法能够最大限度的利用空间采样所提供的信息,是一种线性无偏最优估计的方法[20],本文采用普通克里格方法进行插值分析,插值之前采用指数模型对半变异函数进行拟合,拟合系数R2为0.893,北京市Cd数据块金值(C0)为0.1957,基台值(C+C0)为0.3924,变程(Range)为54.6 km。
预测精度评价指标采用平均误差(ME)、平均绝对误差(MAE)、平均相对误差(MRE)和均方根误差(RMSE)。通常平均误差接近于0,平均绝对误差、平均相对误差以及均方根误差越小,则插值精度越高[21-22]
ME = 1 n i = 1 n ( z ( x i ) - z * ( x i ) ) (4)
MAE = 1 n i = 1 n | z ( x i ) - z * ( x i ) | (5)
MRE = 1 n i = 1 n ( z ( x i ) - z * ( x i ) ) / z ( x i ) | (6)
RMSE = 1 n i = 1 n ( z ( x i ) - z * ( x i ) ) 2 (7)
式中: z ( x i ) 为预测值; z * ( x i ) 为测试值;n为样本数量。

3 校验结果与插值分析

3.1 校验结果

对北京市土壤Cd含量数据进行异常数据校验,不同校验方法均校验出异常数据,2种方法联合校验出的异常数据较少。如表1所示,空间自相关法校验出100个异常点,极差法中数理统计校验出33个,背景值校验出70个异常点。联合校验方法校验出异常数据34个,34个联合校验出的异常点中包括1个所有校验方法下均异常的异常点,其余异常点为在空间自相关方法与极差法(背景值)方法联合校验出的异常点,不同方法校验出的异常点空间分布如图2-5所示。
Tab. 1 Check results of Cd outliers

表1 Cd元素异常数据校验结果

行政
单元
样品
数量
空间自
相关法
极差法
(数理统计)
极差法
(背景值)
空间自相关法
-极差法联合
北京 727 100 33 70 34

注:联合校验的异常点取空间自相关法与2种极差法校验结果的交集部分

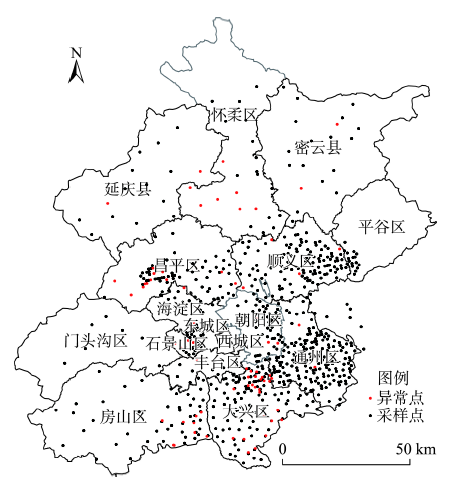
Fig. 2 Distribution of outliers detected by mathematical statistics method

图2 数理统计校验异常点分布

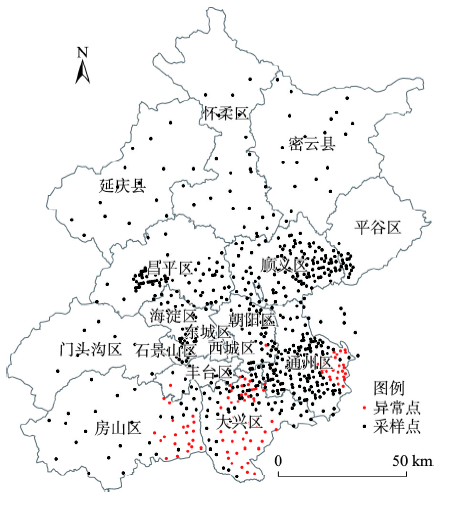
Fig. 3 Distribution of outliers detected by background value method

图3 背景校验异常点分布

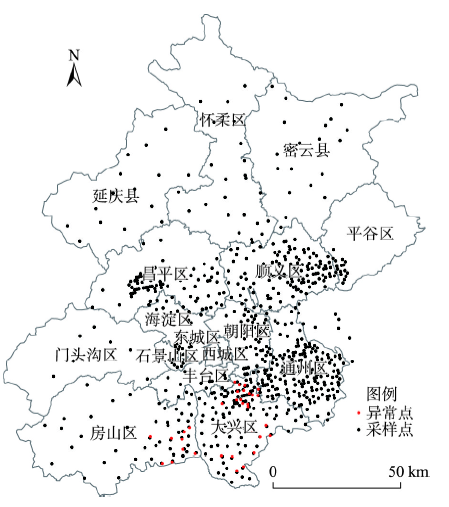
Fig. 4 Distribution of outliers detected by spatial autocorrelation method

图4 空间校验异常点分布

Fig. 5 Distribution of outliers detected by combined method

图5 联合校验异常点分布

3.2 校验方法的有效性验证

为进一步验证联合校验方法对异常数据的甄别效率,对异常数据Cd含量进行了复测。参照国家标准Cd元素回收率的规定及研究中有关Cd元素回收率的要求,本文选取初始数据与复测数据数值差异的10%作为前后数据是否不同的标准[23-25]。与初始数据进行比较,数值可能存在3种变化趋势:① 初始数据与复测数据大致相同,数值没有明显变化,说明该异常点客观存在。② 初始数据与复测数据数值差异超过10%,且变化趋势符合系统预判,说明该点在初始测试过程中由于人为或系统失误导致其数据异常。③ 初始数据与复测数据数值差异超过10%,但变化趋势不符合系统预判,说明该异常点不仅客观存在,且系统误差或人为误差导致其数值异常。
复测数据与初始数据相比,大部分数据的变化趋势符合联合校验方法预判,识别出的异常数据主要由系统误差或人为误差导致。如图6所示,校验出的34个Cd异常数据中,26个点复测数据变化趋势符合预判,占异常数据的76.5%;无明显变化的点有7个,占异常数据的20.6%;变化趋势与预判相反的点有1个,占异常数据的2.9%。图6中箭头指向表示,与初始测试数据相比,校验方法预判复测后异常点数值的降低或升高趋势;红色箭头表示复测数值符合校验方法的预判结果,蓝色箭头表示复测数值不符合校验方法的预判结果,未标明箭头的点说明前后测试数据数值差异在10%范围内。
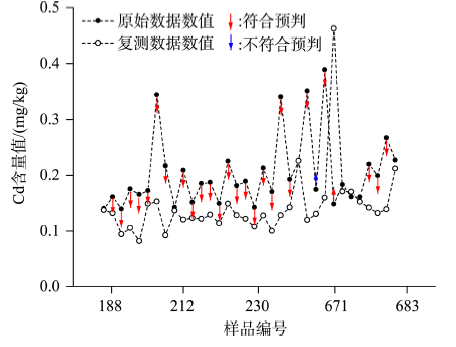
Fig. 6 Comparison graph of Cd outliers between the original results and re-analysed results

图6 Cd异常点原始数据与复测数据含量对比图

3.3 联合校验结果对插值预测精度的影响

将由系统误差或人为误差导致的异常数据校正后,异常点及异常点邻近点在空间插值预测过程中的预测精度均显著提高。原始数据的预测结果与校准后数据的预测结果相比,异常数据自身平均误差由-0.04降低至-0.002,平均相对误差、平均绝对误差以及均方根误差分别下降了44.56%、46.67%和33.33%;受异常数据影响的邻近点平均相对误差、平均绝对误差以及均方根误差分别下降了20.59%、25.45%和17.33%(图7-9)。通过对原始数据和复测数据进行T检验得出p =0.001<0.05,表明前后数据差异显著。
Fig. 7 Diagram of mean relative error and its variation

图7 平均相对误差及其变化示意图

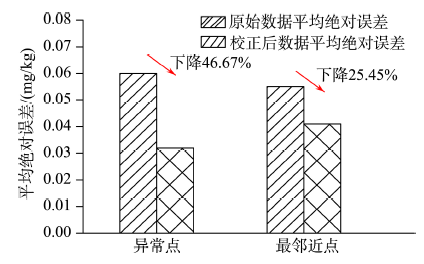
Fig. 8 Diagram of mean absolute error and its variation

图8 平均绝对误差及其变化示意图

Fig. 9 Diagram of root mean square error and its variation

图9 均方根误差及其变化示意图

4 讨论

4.1 联合校验方法的识别效率

与单一校验方法相比,联合校验方法对由系统误差或人为误差导致的异常数据的识别效率更高。本研究提出的联合校验方法对由系统误差或人为误差导致的异常数据的识别率达到75%以上。空间自相关方法校验出异常点数据100个,远远多于联合方法(34个),但这些异常数据大部分是客观存在的。如张朝生等用空间变异方法,校验出空间异常数据7个,复测后发现重金属含量与之前一致,表明了7个空间异常值客观存在[13]。仅用空间变异一种校验方法,无法有效识别出系统误差或人为误差导致的异常数据,识别效率低,增加大量的分析成本和时间,违背了校验方法的初衷。与单一校验方法相比,本研究提出的联合校验方法提高了异常数据的甄别效率,识别出由系统误差或人为误差导致的异常数据。
理论上,严格控制分析质量过程,可有效避免由于系统误差或人为误差导致的异常数据,但对于大批量的样品分析,尤其大区域尺度的调查,出现由于系统误差或人为误差导致的异常数据不可避免。本研究从651个土壤数据中校验出26个由于系统误差或人为误差导致的异常数据,这部分数据占总体样本的4%,出错率不超过10%,这种样品测试结果完全可以接受。当然,本研究提出的联合校验方法的有效性主要通过北京市土壤重金属含量数据获取的,其有效性还需要更多的案例数据进一步验证。

4.2 导致土壤重金属数据异常的因素

自然因素、人类活动以及分析误差均可导致土壤重金属含量数据异常。① 成土母岩、母质以及成土过程等自然因素的差异导致不同区域土壤重金属含量呈现差异[26],在一定的采样尺度下,空间连续性不强,发生局部异常,同时在采样的过程中采样方案的设计、布点选择以及采样密度等均会对最终的分析结果产生影响,如何在减少采样成本的情况下达到研究的目的仍然是一个值得研究的问 题[27-28]。相对于周边邻近区域土壤重金属含量数据,这部分因素导致的异常点数值偏低或者偏高,被校验为异常数据,但这部分数据是客观存在的。② 在人类活动的影响之下,尤其点状污染源的存在,如金属冶炼、垃圾焚烧、畜禽养殖等活动均会导致局部区域土壤重金属含量升高[29-34],明显高于周边土壤重金属含量,造成局部异常。这种因素导致的异常点数值偏高,通常会被识别为异常数据,但这些异常样点也是客观真实的。③ 由于系统误差或者人为操作误差导致的数据异常,数据在空间上或者数值上异于其它数据,这些因素导致的异常点客观上是不存在的,也是本校验方法识别的重点。
导致数据异常的系统误差或者人为操作误差主要包括以下方面:① 土壤样品研磨过程中,不同样品之间交叉感染;② 非密闭环境下称量土壤样品,天平读数不稳定带来的误差;③ 样品消解过程中,消解液体爆沸溅出,以及消解液体溅入其它三角瓶中,导致交叉感染;④ 消解液定容过程中,容量瓶定容体积不准;⑤ 上机测试过程中,进样管冲洗不干净或进样管并未完全接触到样品溶液中导致测试错误;⑥ 仪器不稳定导致的系统误差,如利用石墨炉原子吸收分光光度法测量Cd含量时,石墨管的选择、升温程序的设定以及自动进样器的位置等均会影响实验的结果和准确性;⑦ 在采样、运输以及保存的过程中由于采样不规范、运输保存过程中袋子破裂等均会导致该土壤样品污染进而导致样点的数据不准确。
在实验过程中可以采取一系列措施达到降低人为误差和系统误差的目的,主要措施包括:① 杜绝样品在运输和保存过程中交叉感染;② 预处理过程防止样品交叉感染;③ 严格控制实验分析操作,按照消解方法规定规范预处理过程;④ 保证仪器预热充分,多次调整温度等参数以保证仪器对所测元素有较好的检出限。

5 结论

通过案例数据实证,相对于单一校验方法,联合校验方法识别土壤中重金属异常值数据具有明显的针对性。北京土壤651个样点Cd数据中有34个数据异常。
联合校验方法有效识别出了系统误差和人为因素导致的异常数据。北京市土壤校验出的异常数据中,由于系统误差和人为因素导致的Cd异常数据有26个,占异常数据的76.5%。
异常数据经过校准后,数据空间插值的预测 精度均显著提高。异常点Cd平均相对误差降低44.56%,均方根误差减小33.33%;异常点邻近点Cd预测值平均相对误差降低20.59%,均方根误差减 小17.33%。

The authors have declared that no competing interests exist.

[1]
Wang Y C, Qiao M, Liu Y X, et al.Health risk assessment of heavy metals in soils and vegetables from wastewater irrigated area, Beijing-Tianjin city cluster, China[J]. Journal of Environmental Sciences, 2012,24(4):690-698.The possible health risks of heavy metals contamination to local population through food chain were evaluated in Beijing and Tianjin city cluster, China, where have a long history of sewage irrigation. The transfer factors (TF) for heavy metals from soil to vegetables for six elements including Cu, Zn, Pb, Cr, As and Cd were calculated and the pollution load indexes (PLI) were also assessed. Results indicate that only Cd exceeded the maximum acceptable limit in these sites. So far, the heavy metal concentrations in soils and vegetables were all below the permissible limits set by the Ministry of Environmental Protection of China and World Health Organization. The transfer factors of six heavy metals showed the trend as Cd > Zn > Cu > Pb > As > Cr, which were dependent on the vegetable species. The estimated dietary intakes of Cu, Zn, Pb, Cr, As and Cd were far below the tolerable limits and the target hazard quotient (THQ) values were less than 1, which suggested that the health risks of heavy metals exposure through consuming vegetables were generally assumed to be safe.

DOI PMID

[2]
Gunawardena J, Egodawatta P, Ayoko G A, et al.Atmospheric deposition as a source of heavy metals in urban stormwater[J]. Atmospheric Environment, 2013,68:235-242.Atmospheric deposition is one of the most important pathways of urban stormwater pollution. Atmospheric deposition, which can be in the form of either wet or dry deposition have distinct characteristics in terms of associated particulate sizes, pollutant types and influential parameters. This paper discusses the outcomes of a comprehensive research study undertaken to identify important traffic characteristics and climate factors such as antecedent dry period and rainfall characteristics which influences the characteristics of wet and dry deposition of solids and heavy metals. The outcomes confirmed that Zinc (Zn) is correlated with traffic volume whereas Lead (Pb), Cadmium (Cd), Nickel (Ni), and Copper (Cu) are correlated with traffic congestion. Consequently, reducing traffic congestion will be more effective than reducing traffic volume for improving air quality particularly in relation to Pb, Cd, Ni, and Cu. Zn was found to have the highest atmospheric deposition rate compared to other heavy metals. Zn in dry deposition is associated with relatively larger particle size fractions (>10 m), whereas Pb, Cd, Ni and Cu are associated with relatively smaller particle size fractions (<10 m). The analysis further revealed that bulk (wet plus dry) deposition which is correlated with rainfall depth and contains a relatively higher percentage of smaller particles compared to dry deposition which is correlated with the antecedent dry period. As particles subjected to wet deposition are smaller, they disperse over a larger area from the source of origin compared to particles subjected to dry deposition as buoyancy forces become dominant for smaller particles compared to the influence of gravity. Furthermore, exhaust emission particles were found to be primarily associated with bulk deposition compared to dry deposition particles which mainly originate from vehicle component wear.

DOI

[3]
Zheng J, Chen K H, Yan X, et al.Heavy metals in food, house dust, and water from an e-waste recycling area in South China and the potential risk to human health[J]. Ecotoxicology and Environmental Safety, 2013,96:205-212.Concentrations of heavy metals (Cd, Pb, Cu, Zn, and Ni) were measured in the foodstuffs, house dust, underground/drinking water, and soil from an electronic waste (e-waste) area in South China. Elevated concentrations of these potentially toxic metals were observed in the samples but not in drinking water. The health risks for metal exposure via food consumption, dust ingestion, and drinking water were evaluated for local residents. For the average residents in the e-waste area, the non-carcinogenic risks arise predominantly from (hazard index=3.3), vegetables (2.2), and house dust (1.9) for adults, while the risks for young children are dominated by house dust (15). Drinking water may provide a negligible contribution to risk. However, local residents who use groundwater as a water supply source are at high non-carcinogenic risk. The potential risks from oral intake of Pb are 8 10(-5) and 3 10(-4) for average adults and children, and thus groundwater would have a great potential to induce (5 10(-4) and 1 10(-3)) in a highly exposed population. The results also reveal that the risk from oral exposure is much higher than the risk from inhalation and dermal contact with house dust.

DOI PMID

[4]
Dong J, Yang Q W, Sun L N, et al.Assessing the concentration and potential dietary risk of heavy metals in vegetables at a Pb/Zn mine site, China[J]. Environmental Earth Sciences, 2011,64(5):1317-1321.Cd, Pb, Cu and Zn were measured in vegetables in Xiguadi village around Lechang Pb/Zn mine in Guangdong province, South China. The daily intake (DI) of these metals from vegetables by local people was also determined. The respective Cd, Pb, Cu and Zn concentration was 0.05-0.90 (mean 0.25), 1.04-5.82 (2.64), 0.53-7.07 (2.00) and 3.87-25.20 (11.68) mg kg(-1), of which Cd concentration in all vegetables exceeded the safe limit given by FAO/WHO. The DI was found to be 49.76, 475.56, 360.36 and 2,102.63 mu g, respectively. The present results indicated local mining activity caused vegetable heavy metal contamination and Cd concentration exceeding the stipulated standards for all vegetables indicating potentially serious dietary risks for local people.

DOI

[5]
Li Z Y, Ma Z W, van der Kuijp T J, et al. A review of soil heavy metal pollution from mines in China: Pollution and health risk assessment[J]. Science of the Total Environment, 2014,468:843-853.Heavy metal pollution has pervaded many parts of the world, especially developing countries such as China. This review summarizes available data in the literature (2005 2012) on heavy metal polluted soils originating from mining areas in China. Based on these obtained data, this paper then evaluates the soil pollution levels of these collected mines and quantifies the risks these pollutants pose to human health. To assess these potential threat levels, the geoaccumulation index was applied, along with the US Environmental Protection Agency (USEPA) recommended method for health risk assessment. The results demonstrate not only the severity of heavy metal pollution from the examined mines, but also the high carcinogenic and non-carcinogenic risks that soil heavy metal pollution poses to the public, especially to children and those living in the vicinity of heavily polluted mining areas. In order to provide key management targets for relevant government agencies, based on the results of the pollution and health risk assessments, Cd, Pb, Cu, Zn, Hg, As, and Ni are selected as the priority control heavy metals; tungsten, manganese, lead inc, and antimony mines are selected as the priority control mine categories; and southern provinces and Liaoning province are selected as the priority control provinces. This review, therefore, provides a comprehensive assessment of soil heavy metal pollution derived from mines in China, while identifying policy recommendations for pollution mitigation and environmental management of these mines.

DOI PMID

[6]
Bian R J, Li L Q, Bao D D, et al.Cd immobilization in a contaminated rice paddy by inorganic stabilizers of calcium hydroxide and silicon slag and by organic stabilizer of biochar[J]. Environmental Science and Pollution Research, 2016,23(10):10028-10036.A field experiment was conducted in a Cd-contaminated rice paddy field to evaluate the effect of inorganic and organic metal stabilizers on Cd mobility and rice uptake. A dose of inorganic stabilizer of calcium hydroxide (CH), silicon slag (SS), and wheat straw biochar (BC) was amended respectively to topsoil before rice transplanting. Rice production was managed with the same water regime and fertilization practices consistently between treatments including a control without amendment. Samples of topsoil and rice plant were collected at rice harvest to analyze the Cd mobility and uptake by rice. Without affecting rice grain yield, the stabilizers significantly decreased CaCl2-extractable Cd in a range of 44 to 75 % compared to the control, corresponding to soil pH changes under the different treatments. Accordingly, Cd concentrations both in rice tissue and in rice grain were very significantly decreased under these treatments. The decrease in rice Cd uptake was correlated to the decrease in extractable Cd, which was again correlated to soil pH change under the different treatments, indicating a prevalent role of liming effect by the amendments. While applied at a large amount in a single year, organic stabilizer of BC decreased Cd extractability by up to 43 % and Cd rice uptake by up to 61 %, being the most effective on Cd immobilization. However, the long-term effect on soil health and potential tradeoff effects with different stabilizers deserve further field monitoring studies.

DOI PMID

[7]
Chen T B, Wong J W C, Zhou H Y, et al. Assessment of trace metal distribution and contamination in surface soils of Hong Kong[J]. Environmental Pollution, 1997,96(1):61-68.An intensive investigation was conducted to study the distribution of trace in surface soils of Hong Kong and to assess the soil environmental quality. From results of cluster analysis, and comparisons among soil types and areas, it is clearly shown that increases in trace metal concentrations in the soils were generally extensive and obvious in urban and orchard soils, less so in vegetable soils, whilst rural and forest soils were subjected to the least impact of anthropogenic sources of trace . However, some of the forest soils also contained elevated levels of As, Cu, and Pb. Urban soils in Hong Kong were heavily polluted by Pb from gasoline combustion. Agricultural soils, both orchard and vegetable soils, usually accumulated As, Cd, Cu, and Zn originating from applications of pesticides, animal manures, and fertilizers. In general, trace metal pollution in soils of the industrial areas and Pb pollution in the soils of the commercial and residential areas were obvious.

DOI PMID

[8]
Lu A X, Wang J H, Qin X Y, et al.Multivariate and geostatistical analyses of the spatial distribution and origin of heavy metals in the agricultural soils in Shunyi, Beijing, China[J]. Science of the Total Environment, 2012,425:66-74.An extensive survey was conducted in this study to determine the spatial distribution and possible sources of heavy metals in the agricultural soils in Shunyi, a representative agricultural suburb in Beijing, China. A total of 412 surface soil samples were collected at a density of one sample per km(2), and concentrations of As, Cd, Cu, Hg, Pb and Zn were analyzed. The mean values of the heavy metals were 7.85 +/- 2.13, 0.136 +/- 0.061, 22.4 +/- 631, 0.073 +/- 0.049, 20.4 +/- 52, and 69.8 +/- 16.5 mg kg(-1) for As, Cd, Cu, Hg, Pb, and Zn, respectively, slightly higher than their background values of Beijing topsoil with the exception of Pb. but lower than the guideline values of Chinese Environmental Quality Standard for Soils. Multivariate and geostatistical analyses suggested that soil contamination of Cd, Cu and Zn was mainly derived from agricultural practices. Whereas, As and Pb were due mainly to soil parent materials, and Hg was caused by the atmospheric deposits from Beijing City. The identification of heavy metal sources in agricultural soils is a basis for undertaking appropriate action to protect soil quality. (C) 2012 Elsevier B.V. All rights reserved.

DOI PMID

[9]
Kelepertzis E.Accumulation of heavy metals in agricultural soils of Mediterranean: Insights from Argolida basin, Peloponnese, Greece[J]. Geoderma, 2014,221:82-90.61First report on metal accumulation in Argolida agricultural soils is presented.61Contamination sources and spatial trends of metals were examined.61Agrochemicals influence Cu, Zn, Cd, Pb, As and Mn accumulation in soils.61Parent ultramafic materials are responsible for Ni, Cr and Co enrichment.61Citrus soils have received significant anthropogenic inputs.

DOI

[10]
Zhang C, Selinus O, Schedin J.Statistical analyses for heavy metal contents in till and root samples in an area of southeastern Sweden[J]. Science of the Total Environment, 1998,212(2-3):217-232.Abstract The Geological Survey of Sweden (SGU) initiated a national mapping program in 1982 with three types of geochemical samples (bedrock, till and biogeochemical) and the objective to produce a detailed geochemical atlas of the entire country. This program is still ongoing. Problems concerning the calculation of mean values, outlier detection, relationships among elements, spatial distribution features and relationships among the different types of geochemical samples are therefore important to consider. To find an optimal way to solve these problems, the contents of seven heavy metal elements (Co, Cr, Cu, Ni, Pb, V and Zn) in 758 till samples and 851 root (with some moss) samples were extracted from the SGU database in a polygon of 75 75 km2 in southeastern Sweden. Both univariate and multivariate analyses were carried out on the datasets. The combination of range method and principal component analysis (PCA) was satisfactorily utilized for the detection of outlying samples. The commonly-used mean calculation methods of median, geometrical mean and arithmetical mean are discussed and compared, and a new method for mean calculation named `robust-symmetric mean' (R-S mean) involving robust statistics and optimal data transformation is recommended. Results from multivariate analysis show that Pb has comparatively weak correlations with the other elements and Zn also possesses such a trend, which is caused by the differences of their contents in bedrocks and mineralization. Lead is enriched in the acid volcanic rocks, while the other metals are elevated in the basic rocks of the area. Lead mineralization in the acid volcanic rocks also causes elevated contents of Zn in the bedrock. Heavy metals in biogeochemical samples are more diversified than in tills, as they are more affected by external geochemical processes than in tills, also the relationships among elements in the biogeochemical samples are therefore more affected by these processes.

DOI

[11]
Topping J, Worrell F T.Errors of observation and their treatment[M]. London: Chapman and Hall, 1972:9-10.

[12]
Li W L, Xu B B, Song Q J, et al.The identification of 'hotspots' of heavy metal pollution in soil-rice systems at a regional scale in eastern China[J]. Science of the Total Environment, 2014,472:407-420.Chinese agricultural soils and crops are suffering from increasing damage from heavy metals, which are introduced from various pollution sources including agriculture, traffic, mining and especially the flourishing private metal recycling industry. In this study, 219 pairs of rice grain and corresponding soil samples were collected from Wenling in Zhejiang Province to identify the spatial relationship and pollution hotspots of Cd, Cu, Ni and Zn in the soil-rice system. The mean soil concentrations of heavy metals were 0.316 mg kg(-1) for Cd, 47.3 mg kg(-1) for Cu, 31.7 mg kg(-1) for Ni and 131 mg kg(-1) for Zn, and the metal concentrations in rice grain were 0.132 mg kg(-1) for Cd, 2.46 mg kg(-1) for Cu, 0.223 mg kg(-1) for Ni and 17.4 mg kg(-1) for Zn. The coefficient of variability (CV) of soil Cd, Cu and rice Cd were 147%, 146% and 180%, respectively, indicating an extensive variability. While the CVs of other metals ranged from 23.4% to 84.3% with a moderate variability. Kriging interpolation procedure and the Local Moran's I index detected the locations of pollution hotspots of these four metals. Cd and Cu had a very similar spatial pattern, with contamination hotspots located simultaneously in the northwestern part of the study area, and there were obvious hotspots for soil Zn in the north area, while in the northeast for soil Ni. The existence of hotspots may be due to industrialization and other anthropogenic activities. An Enrichment Index (EI) was employed to measure the uptake of heavy metals by rice. The results indicated that the accumulation and availability of heavy metals in the soil-rice system may be influenced by both soil heavy metal concentrations and soil physico-chemical properties. Cross-correlograms quantitatively illustrated that EIs were significantly correlated with soil properties. Soil pH and organic matter were the most important factors controlling the uptake of heavy metals by rice. As results, positive measures should be taken into account to control soil pollution and to curtail metal contamination to the food chain in the areas of Wenling, which were the most polluted by toxic metals.

DOI PMID

[13]
Zhang C S, Luo L, Xu W L, et al.Use of local Moran's I and GIS to identify pollution hotspots of Pb in urban soils of Galway, Ireland[J]. Science of the Total Environment, 2008,398(1-3):212-221.Abstract Pollution hotspots in urban soils need to be identified for better environmental management. It is important to know if there are hotspots and if the hotspots are statistically significant. In this study identification of pollution hotspots was investigated using Pb concentrations in urban soils of Galway City in Ireland as an example, and the influencing factors on results of hotspot identification were investigated. The index of local Moran's I is a useful tool for identifying pollution hotspots of Pb pollution in urban soils, and for classifying them into spatial clusters and spatial outliers. The results were affected by the definition of weight function, data transformation and existence of extreme values. Compared with the results for the positively skewed raw data, the transformed data and data with extreme values excluded revealed a larger area for the high value spatial clusters in the city centre. While it is hard to decide the best way of using this index, it is suggested that all these influencing factors should be considered until reasonable and reliable results are obtained. GIS mapping can be applied to help evaluate the results via visualization of the spatial patterns. Meanwhile, selected pollution hotspots (extreme values) in this study were confirmed by re-analyses and re-sampling.

DOI PMID

[14]
Zhang C S, Selinus O.Statistics and GIS in environmental geochemistry - some problems and solutions[J]. Journal of Geochemical Exploration, 1998,64(1-3):339-354.Statistics and geographical information system (GIS) are receiving more and more attention in environmental geochemistry. However, it is important to know the functions and limitations, the advantages and disadvantages of these techniques for better understanding of their applications. Univariate statistics is useful for mean calculation, identification of probability distribution and outlier detection. Multivariate analysis plays an important role in the study of relationships among variables. However, while dealing with regionalized variables in environmental geochemistry, the conventional statistics show their shortcomings as they are based on some kind of assumptions for random variables. Spatial analysis makes use of the spatial coordinate information of the variables, and also takes the spatial correlation into consideration. However, these pure mathematical methods are still unsatisfactory as the nature of environmental geochemistry is far from being so simple. GIS provides visualization and some spatial analysis functions with much spatial information involved. An expert system is useful for classification and prediction based on various types of information. However, the rule base for expert systems in environmental geochemistry is too small, and needs to be developed. Problems and possible solutions with the application of statistics and GIS in environmental geochemistry are discussed. Examples are based on the authors' experiences in the Yangtze River basin, China, and in southeastern Sweden. Several ideas are discussed in this paper. A `robust-symmetric mean' proposed by the authors is one of the best methods for mean calculation. For the probability distribution of trace elements, the widely accepted `log-normal distribution' is only a special case of `positively skewed distributions' which is more adequate. The combination of univariate methods and PCA is used to detect outlying samples. Partial least square (PLS) regression, principal component analysis (PCA), cluster analysis, discriminant analysis and expert systems may be used to differentiate anthropogenic anomalies from the natural background. Spatial correlations among environmental geochemical variables are revealed by cross-variograms. An environmental information system, with the integration of statistics, GIS, expert systems and environmental models should be established to further the study in environmental geochemistry, as well as to provide decision support.

DOI

[15]
黄智刚,李保国,胡克林.丘陵红壤蔗区土壤有机质的时空变异特征[J].农业工程学报,2006,22(11):58-63.采用地统计学和GIS相结合的方法,研究了甘蔗连作19年(1980~1999年)的低丘陵红壤蔗区土壤有机质含量的时空变异特征。研究结果表明:由于土壤侵蚀和土地利用格局的影响,1980年的土壤有机质与地形坡度为极显著负相关。在长期甘蔗连作下,地形坡度对1999年的土壤有机质空间分布已没有影响,而有机肥施用的侧重方向使得土壤有机质与经纬度、海拔高度都有相关性。土壤有机质的时空变异与蔗区耕作管理的精细化程度有关,精细化程度高的高产蔗区的土壤有机质平均降幅为11%,而精细化程度低的低产蔗区土壤有机质则平均增幅为50%。大量施用源自甘蔗的有机肥已造成蔗区土壤养分的不平衡。

[Huang Z G, Li B G, Hu K L.Characteristics of the spatio-temporal changes of soil organic matter of sugarcane field in red soil hill areas[J]. Transactions of the Chinese Society of Agricultural Engineering, 2006,22(11):58-63. ]

[16]
Zhang C S, McGrath D. Geostatistical and GIS analyses on soil organic carbon concentrations in grassland of southeastern Ireland from two different periods[J]. Geoderma, 2004,119(3-4):261-275.Thus, a combination of geostatistics and GIS map algebra provides a useful tool for the examination of spatio-temporal changes in the environmental sciences and may detect features that are not discernible when only conventional statistics are used.

DOI

[17]
Huo X N, Zhang W W, Sun D F, et al.Spatial pattern analysis of heavy metals in Beijing agricultural soils based on spatial autocorrelation statistics[J]. International Journal of Environmental Research and Public Health, 2011,8(6):2074-2089.This study explored the spatial pattern of heavy metals in Beijing agricultural soils using Moran's I statistic of spatial autocorrelation. The global Moran's I result showed that the spatial dependence of Cr, Ni, Zn, and Hg changed with different spatial weight matrixes, and they had significant and positive global spatial correlations based on distance weight. The spatial dependence of the four metals was scale-dependent on distance, but these scale effects existed within a threshold distance of 13 km, 32 km, 50 km, and 29 km, respectively for Cr, Ni, Zn, and Hg. The maximal spatial positive correlation range was 57 km, 70 km, 57 km, and 55 km for Cr, Ni, Zn, and Hg, respectively and these were not affected by sampling density. Local spatial autocorrelation analysis detected the locations of spatial clusters and spatial outliers and revealed that the pollution of these four metals occurred in significant High-high spatial clusters, Low-high, or even High-low spatial outliers. Thus, three major areas were identified and should be receiving more attention: the first was the northeast region of Beijing, where Cr, Zn, Ni, and Hg had significant increases. The second was the southeast region of Beijing where wastewater irrigation had strongly changed the content of metals, particularly of Cr and Zn, in soils. The third area was the urban fringe around city, where Hg showed a significant increase.

DOI PMID

[18]
Anselin L.Local Indicators of Spatial Association& mdash:LISA[J]. Geographical Analysis, 1995,27(2):93-115.

[19]
Zheng Y M, Chen T B, He J Z.Multivariate geostatistical analysis of heavy metals in topsoils from Beijing, China[J]. Journal of Soils and Sediments, 2008,8(1):51-58.lt;a name="Abs1"></a><div class="AbstractSection"> <div class=""><h3>Background&nbsp;&nbsp;</h3>Regional soil environmental quality is a hotspot and difficulty in the environmental sciences for the spatial variability of pollutants and the relationship between them. Beijing, the capital of China, has been undergoing a rapid economical development during the past three decades, and thus might encounter the same issues as the developed countries. However, there is little information about the soil environmental quality of Beijing, especially at the regional scale. The real soil environmental situation of heavy metals remains unknown, even less the sources of possible pollutants.

DOI

[20]
Trangmar B B, Yost R S, Uehara G.Application of geostatistics to spatial studies of soil properties[J]. Advances in Agronomy, 1985,36(1):45-94.Ciljevi ovog rada bili su (i) istra06iti primjenu geostatisti00kih analiza u prou00avanju prostornog varijabiliteta izabranih svojstava tla Petrova polja, (ii) pobolj08ati interpretaciju odnosa izme04u svojstava tla i pedogenetskih 00imbenika, (iii) ustanoviti podru00ja na kojima je potrebno pove04ati gustinu uzrokovanja radi pove04anja preciznosti i pouzdanosti procjene. Kvantittativna analiza prostornog karaktera varijabiliteta svojstava tla ima veliko zna00enje pri pedolo08kim interpretacijama i predvi04anju svojstava tla na nekoj neuzrokovanoj lokaciji. Prostorna zavisnost izme04u uzoraka tla izra06ena je pomo04u semivarijance i prikazana u formi semivariograma za svako svojstvo tla. Na osnovi ustanovljenih parametara pojedina00nih modela semivariograma, uz primjenu kriging interpolacijske tehnike 02 temeljena na temeljena na teoriji regionaliziranih varijabli, izvr08ena je prostorna interpolacija pojedina00nih svojstava koja je prikazana u formi 3D slika.

DOI

[21]
Xie Y F, Chen T B, Lei M, et al.Spatial distribution of soil heavy metal pollution estimated by different interpolation methods: Accuracy and uncertainty analysis[J]. Chemosphere, 2011,82(3):468-476.Mapping the spatial distribution of contaminants in soils is the basis of pollution evaluation and risk control. Interpolation methods are extensively applied in the mapping processes to estimate the heavy metal concentrations at unsampled sites. The performances of interpolation methods (inverse distance weighting, local polynomial, ordinary kriging and radial basis functions) were assessed and compared using the root mean square error for cross validation. The results indicated that all interpolation methods provided a high prediction accuracy of the mean concentration of soil heavy metals. However, the classic method based on percentages of polluted samples, gave a pollution area 23.54-41.92% larger than that estimated by interpolation methods. The difference in contaminated area estimation among the four methods reached 6.14%. According to the interpolation results, the spatial uncertainty of polluted areas was mainly located in three types of region: (a) the local maxima concentration region surrounded by low concentration (clean) sites, (b) the local minima concentration region surrounded with highly polluted samples; and (c) the boundaries of the contaminated areas. (C) 2010 Elsevier Ltd. All rights reserved.

DOI PMID

[22]
Liu Z P, Shao M A, Wang Y Q.Large-scale spatial interpolation of soil pH across the Loess Plateau, China[J]. Environmental Earth Sciences, 2013,69(8):2731-2741.Soil pH plays an important role in biogeochemical processes in soils. The spatial distribution of soil pH provides basic and useful information relevant to soil management and agricultural production. To obtain an accurate distribution map of soil pH on the Loess Plateau of China, 382 sampling sites were investigated throughout the region and four interpolation methods, i.e., inverse distance weighting (IDW), splines, ordinary kriging, and cokriging, were applied to produce a continuous soil pH surface. In the study region, soil pH values ranged from 6.06 to 10.76, with a mean of 8.49 and a median of 8.48. Land use type had a significant effect (p < 0.01) on soil pH; grassland soils had higher pHs than cropland and forestland soils. From a regional perspective, soil pH showed weak variation and strong spatial dependence, indicated by the low values of the coefficient of variation (0.05) and the nugget-to-sill ratios (< 0.25). Indices of cross-validation, i.e., average error, mean absolute error, root mean square error, and model efficiency coefficient were used to compare the performance of the four different interpolation methods. Kriging methods interpolated more accurately than IDW and splines. Cokriging performed better than ordinary kriging and the accuracy was improved using soil organic carbon as an auxiliary variable. Regional distribution maps of soil pH were produced. The southeastern part of the region had relatively low soil pH values, probably due to higher precipitation, leaching, and higher soil organic matter contents. Areas of high soil pH were located in the north of the central part of the region, possibly associated with the salinization of sandy soils under inappropriate irrigation practices in an arid climate. Map accuracy could be further improved using new methods and incorporating other auxiliary variables, such as precipitation, elevation, terrain attributes, and vegetation types.

DOI

[23]
国家环境保护局,国家技术监督局.GB/T 17141-1997,土壤质量铅、镉的测定石墨炉原子吸收分光光度法[S].北京:中国标准出版社,1997:1-4.

[National Environmental Protection Agency, State Bureau of Technology Supervision. GB/T 17141-1997, Soil quality-Determination of lead, cadmium-Graphite furnace atomic absorption spectrophotometry[S]. Beijing: Standards Press of China, 1997:1-4. ]

[24]
Luo J, Qi S, Gu X W S, et al. Evaluation of the phytoremediation effect and environmental risk in remediation processes under different cultivation systems[J]. Journal of Cleaner Production, 2016,119:25-31.Remediation effectiveness and environmental risks caused by phytoremediation processes under different cultivation systems were assessed at an electronic waste dismantling site. Non-nitrogen-fixing Eucalyptus globulus Labill. and nitrogen-fixing Cicer arietinum (chickpea) were selected for phytoremediation, while Eisenia foetida and Gus gallus were chosen as impacted receptors. Chickpea monoculture was least effective for soil remediation, and soil cadmium under this cultivation system had the most potential threats to the environment. The chickpea monoculture cultivation system needs 132 years to reduce the initial soil cadmium concentration to the quality guidelines of China. The environmental risk index of receptors was greater than in other cultivation systems. The greatest remediation effectiveness occurred in the E. globulus monoculture with earthworm addition. This approach decreases the decontamination time of cadmium in the soil by 80% compared to chickpea monoculture without earthworms. In addition to a favorable phytoremediation effect, this cultivation system was accompanied by a more acceptable environmental risk index value because E. globulus are evergreen trees, unpalatable by livestock, with less litterfall production than chickpeas. E. globulus monoculture with an earthworm addition system is especially suitable for remedying cadmium-polluted soil, as it causes the least environmental risk and reduces the time required to decontaminate the cadmium in the soil by 30% compared to the next most effective system. The decision of which cultivation system is more suitable for an anthropogenically influenced site should be balanced between the capacity of the plant to remove pollution and environmental preservation. Data from the present research have provided a new methodology of efficient phytoremediation with relatively low environmental risks.

DOI

[25]
Tang X, Pang Y, Ji P, et al.Cadmium uptake in above-ground parts of lettuce (Lactuca sativa L.)[J]. Ecotoxicology & Environmental Safety, 2016,125:102-106.Because of its high Cd uptake and translocation, lettuce is often used in Cd contamination studies. However, there is a lack of information on Cd accumulation in the above-ground parts of lettuce during the entire growing season. In this study, a field experiment was carried out in a Cd-contaminated area. Above-ground lettuce parts were sampled, and the Cd content was measured using a flame atomic absorption spectrophotometer (AAS). The results showed that the Cd concentration in the above-ground parts of lettuce increased from 2.70 to 3.6202mg02kg 611 during the seedling stage, but decreased from 3.62 to 2.4002mg02kg 611 during organogenesis and from 2.40 to 1.6402mg02kg 611 during bolting. The mean Cd concentration during the seedling stage was significantly higher than that during organogenesis ( a =0.05) and bolting ( a =0.01). The Cd accumulation in the above-ground parts of an individual lettuce plant could be described by a sigmoidal curve. Cadmium uptake during organogenesis was highest (80% of the total), whereas that during bolting was only 4.34%. This research further reveals that for Rome lettuce: (1) the highest Cd content of above-ground parts occurred at the end of the seedling phase; (2) the best harvest time with respect to Cd phytoaccumulation is at the end of the organogenesis stage; and (3) the organogenesis stage is the most suitable time to enhance phytoaccumulation efficiency by adjusting the root:shoot ratio.

DOI PMID

[26]
Stafilov T, Sajn R, Boev B, et al.Distribution of some elements in surface soil over the Kavadarci region, Republic of Macedonia[J]. Environmental Earth Sciences, 2010,61(7):1515-1530.The results of a first systematic study of spatial distribution of different elements in surface soil over of the Kavadarci region, Republic of Macedonia, known for its nickel industrial activity are reported. The investigated region (360&nbsp;km<sup>2</sup>) is covered by a sampling grid of 2&nbsp;×&nbsp;2&nbsp;km<sup>2</sup>; whereas the sampling grid of 1&nbsp;×&nbsp;1&nbsp;km<sup>2</sup> was applied in the urban zone and around the ferronickel smelter plant (117&nbsp;km<sup>2</sup>). In total 344 soil samples from 172 locations were collected. At each sampling point soil samples were collected at two depths, topsoil (0&#8211;5&nbsp;cm) and bottom soil (20&#8211;30&nbsp;cm). Inductively coupled plasma-mass spectrometry (ICP-MS) was applied for the determination of 36 elements (Ag, Al, As, Au, B, Ba, Bi, Ca, Cd, Co, Cr, Cu, Fe, Ga, Hg, K, La, Mn, Na, Mg, Mo, Ni, P, Pb, S, Sb, Sc, Se, Sr, Th, Tl, Ti, U, V, W and Zn). Data analysis and construction of maps were performed using the Paradox (ver. 9), Statistica (ver. 6.1), AutoDesk Map (ver. 2008) and Surfer (ver. 8.09) software. Four geogenic and three anthropogenic geochemical associations were established. Within the research, natural and anthropogenic enrichment with heavy metals was determined. Principally, the natural enrichment is related especially to Ni. Pollution by As, Cd, Co, Cr, Cu, Hg, Mo, Pb and Zn is basically insignificant.

DOI

[27]
Hengl T, Heuvelink G B M, Rossiter D G. About regression-kriging: From equations to case studies[J]. Computers & Geosciences, 2007,33(10):1301-1315.This paper discusses the characteristics of regression-kriging (RK), its strengths and limitations, and illustrates these with a simple example and three case studies. RK is a spatial interpolation technique that combines a regression of the dependent variable on auxiliary variables (such as land surface parameters, remote sensing imagery and thematic maps) with simple kriging of the regression residuals. It is mathematically equivalent to the interpolation method variously called “Universal Kriging” (UK) and “Kriging with External Drift” (KED), where auxiliary predictors are used directly to solve the kriging weights. The advantage of RK is the ability to extend the method to a broader range of regression techniques and to allow separate interpretation of the two interpolated components. Data processing and interpretation of results are illustrated with three case studies covering the national territory of Croatia. The case studies use land surface parameters derived from combined Shuttle Radar Topography Mission and contour-based digital elevation models and multitemporal-enhanced vegetation indices derived from the MODIS imagery as auxiliary predictors. These are used to improve mapping of two continuous variables (soil organic matter content and mean annual land surface temperature) and one binary variable (presence of yew). In the case of mapping temperature, a physical model is used to estimate values of temperature at unvisited locations and RK is then used to calibrate the model with ground observations. The discussion addresses pragmatic issues: implementation of RK in existing software packages, comparison of RK with alternative interpolation techniques, and practical limitations to using RK. The most serious constraint to wider use of RK is that the analyst must carry out various steps in different software environments, both statistical and GIS.

DOI

[28]
Wang X J, Qi F.The effects of sampling design on spatial structure analysis of contaminated soil[J]. Science of the Total Environment, 1998,224(1-3):29-41.Spatial structure analysis has been identified to be a useful tool in illustrating the spatial patterns of variables, and a necessary basis for a number of other spatial analysis procedures, such as kriging analysis. The design of a feasible spatial soil sampling plan at a contaminated site is extremely important for undertaking such analysis and is of considerable economic interest. In this paper, simulated data sets were applied in studying the effects of sampling pattern and density on spatial structure features of pollutants in contaminated soils. Three sampling patterns (regular grid, random and cellular stratified) and three sample sizes were applied in the analysis. Results show that both sample size and sample pattern have significant influences on the availability of experimental variograms. With the decrease of sampling densities, a systematic deviation of regular grid sampling and significant noise effects of cellular stratified and random sampling were observed. Given a certain sampling density, the regular grid pattern illustrated better estimation than the other two patterns. Results also show that, with appropriate tolerances, the estimation results obtained from low sampling densities could be improved significantly.

DOI

[29]
Sabiha J, Mehmood T, Chaudhry M M, et al.Heavy metal pollution from phosphate rock used for the production of fertilizer in Pakistan[J]. Microchemical Journal, 2009,91(1):94-99.lt;h2 class="secHeading" id="section_abstract">Abstract</h2><p id="">Phosphate rock belongs mainly to sedimentary, slightly to igneous, and negligibly to metamorphic rocks. It is used for the production of phosphorous based fertilizers, acids, detergents and many products of common use. The rock is mainly composed of phosphorous and minutely of many other elements. The aim of this study was to determine the concentration of Cd, Cu, Cr, Ni, Pb, Zn (environmental pollutants i.e. toxic elements), and Co, K, Mg, Mn, Na (common elements) in phosphate rocks used for production of fertilizer in Pakistan. Rock samples of local origin were collected from the geological rock formations around the city of Abbottabad and those of foreign origin were obtained from the fertilizer factories and research institutes in Pakistan. Analysis of phosphate rock for all the elements of interest was carried out with Flame Atomic Absorption spectrometer (FAAS) except for sodium which was analyzed using Flame Photometer, while the concentration of potassium was determined using both the techniques. The results showed that heavy metal content was lower in Pakistani phosphate than that in imported rock and were below the safe limits with the exception of lead whose concentration was found to be higher in local phosphate deposits than that in imported rock samples. Phosphate rock is a source of heavy metal pollution of air, soil, water, food chain etc, therefore requires removal of heavy metals (HMs) from the rock prior to its use.</p>

DOI

[30]
Atafar Z, Mesdaghinia A, Nouri J, et al.Effect of fertilizer application on soil heavy metal concentration[J]. Environmental Monitoring & Assessment, 2010,160(1-4):83-89.A large amount of chemicals is annually applied at the agricultural soils as fertilizers and pesticides. Such applications may result in the increase of heavy metals particularly Cd, Pb, and As. The objective of this study was to investigate the variability of chemical applications on Cd, Pb, and As concentrations of wheat-cultivated soils. Consequently, a study area was designed and was divided into four subareas (A, B, C, and D). The soil sampling was carried out in 40 points of cultivated durum wheat during the 2006 2007 periods. The samples were taken to the laboratory to measure their heavy metal concentration, soil texture, pH, electrical conductivity, cationic exchange capacity, organic matter, and carbonate contents. The result indicated that Cd, Pb, and As concentrations were increased in the cultivated soils due to fertilizer application. Although the statistical analysis indicates that these heavy metals increased significantly ( P value < 0.05), the lead and arsenic concentrations were increased dramatically compared to Cd concentration. This can be related to overapplication of fertilizers as well as the pesticides that are used to replant plant pests, herbs, and rats.

DOI PMID

[31]
Fakayode S, Onianwa P.Heavy metal contamination of soil, and bioaccumulation in Guinea grass (Panicum maximum) around Ikeja Industrial Estate, Lagos, Nigeria[J]. Environmental Geology, 2002,43(1):145-150.Topsoil and vegetation (Guinea grass, Panicum maximum ) samples obtained in the vicinity of an industrial complex (the Ikeja Industrial Estate) in Lagos, Nigeria, were analysed for Cd, Pb, Cu, Zn, Ni, Cr and Mn contents. Levels of the metals in soils and plants around the estate were found to be significantly higher than the background concentrations obtained at remote control sites. Average soil concentrations around the estate were: Cd – 2.902mg/kg, Pb – 143.202mg/kg, Cu – 25.602mg/kg, Zn – 247.402mg/kg, Ni – 17.002mg/kg, Cr – 26.602mg/kg and Mn – 282.902mg/kg, while average plant concentrations were: Cd – 0.7302mg/kg, Pb – 2.902mg/kg, Cu – 0.9302mg/kg, Zn – 0.7202mg/kg, Ni – 2.302mg/kg, Cr – 2.302mg/kg and Mn – 3.702mg/kg. Plant samples were collected from the same spots as the soil samples, and there was strong correlation between soil and plant contents of Cd, Pb, Ni and Mn.

DOI

[32]
Krishna A K, Govil P K.Heavy metal contamination of soil around Pali Industrial Area, Rajasthan, India[J]. Environmental Geology, 2004,47(1):38-44.lt;a name="Abs1"></a>Due to rapid industrialization, urbanization and intensive agriculture in India increasing contamination of heavy metals in soil has become a major concern. An environmental geochemical investigation was carried out in and around the Pali industrial development area of Rajasthan to determine the effect of contamination in the study area. Soil samples collected near the Pali industrial area were analyzed for Pb, Cr, Cu, Zn, Sr and V contents by using Philips PW 2440 X-ray fluorescence spectrometer. Samples were collected from the industrial area of Pali from the top 10&nbsp;cm layer of the soil. Most of the samples were collected near small streams adjacent to industrial areas, and near Bandi River. Levels of the metals in soils around the industrial area were found to be significantly higher than their normal distribution in soil such as Pb – 293&nbsp;mg/kg, Cr – 240&nbsp;mg/kg, Cu – 298&nbsp;mg/kg, Zn – 1,364&nbsp;mg/kg, Sr – 2,694&nbsp;mg/kg and V – 377&nbsp;mg/kg. High concentration of these toxic elements in soil is responsible for the development of toxicity in agriculture products, which in turn affects human life. Distribution of metals, their contents at different locations, correlation of heavy metals in soil and their effect on human health are discussed in the paper.

DOI

[33]
Zereini F, Alsenz H, Wiseman C L S, et al. Platinum group elements (Pt, Pd, Rh) in airborne particulate matter in rural vs. urban areas of Germany: Concentrations and spatial pattern`s of distribution[J]. Science of the Total Environment, 2012,416(2):261-268.The highest airborne PGE concentrations were measured in PM 10 from Frankfurt (e.g. 12.402pg Pt/m 3 (mean)), while the rural locations of Deuselbach and Neuglobsow exhibited the lowest levels (e.g. 202pg Pt/m 3 (mean)). PGE concentrations were observed to decline with increasingly smaller PM size fractions from PM 10 to PM 1 . All size fractions generally contained higher levels of Pd compared to Pt and Rh, an element of greater concern due to its solubility. PM 2.5 collected in Frankfurt had a mean of 16.102pg Pd/m 3 , compared to 9.402pg/m 3 for Pt. PGE concentrations also demonstrated a distinct seasonal relationship, with the greatest levels occurring in winter. Compared to a previous study in 2002, PGE concentrations in fractionated airborne dust have significantly increased over time. Elevated PGE levels were also measured for PM 10 sampled in Neuglobsow and Deuselbach, which could not be attributed to local emission sources. Using the diagnostic meteorological model, CALMET, trajectory analyses confirmed our hypothesis that PGE are being transported over longer distances from other areas of Europe.

DOI PMID

[34]
Lough G C, Schauer J J, Park J S, et al.Emissions of metals associated with motor vehicle roadways[J]. Environmental Science & Technology, 2005,39(3):826-36.Emissions of metals and other particle-phase species from on-road motor vehicles were measured in two tunnels in Milwaukee, WI during the summer of 2000 and winter of 2001. Emission factors were calculated from measurements of fine (PM2.5) and coarse (PM10) particulate matter at tunnel entrances and exits, and effects of fleet composition and season were investigated. Cascade impactors (MOUDI) were used to obtain size-resolved metal emission rates. Metals were quantified with inductively-coupled plasma mass spectrometry (ICP-MS) and X-ray fluorescence (XRF). PM10 emission rates ranged from 38.7 to 201 mg km(-1) and were composed mainly of organic carbon (OC, 30%), inorganic ions (sulfate, chloride, nitrate, ammonium, 20%), metals (19%), and elemental carbon (EC, 9.3%). PM10 metal emissions were dominated by crustal elements Si, Fe, Ca, Na, Mg, Al, and K, and elements associated with tailpipe emissions and brake and tire wear, including Cu, Zn, Sb, Ba, Pb, and S. Metals emitted in PM2.5 were lower (11.6% of mass). Resuspension of roadway dust was dependent on weather and road surface conditions, and increased emissions were related to higher traffic volumes and fractions of heavy trucks. Emission of noble metals from catalytic converters appeared to be impacted by the presence of older vehicles. Elements related to brake wear were impacted by enriched road dust resuspension, but correlations between these elements in PM2.5 indicate that direct brake wear emissions are also important. A submicrometer particle mode was observed in the emissions of Pb, Ca, Fe, and Cu.

DOI PMID

文章导航

/