
遥感数据的高斯金字塔尺度上推方法研究
作者简介:李 乐(1991-),女,山东泰安人,硕士生,主要从事多元时空序列数据的处理研究。E-mail:lile@radi.ac.cn
收稿日期: 2016-12-16
要求修回日期: 2017-02-22
网络出版日期: 2017-05-20
基金资助
中国科学院遥感与数字地球研究所所长基金项目“基于动态追踪树的区域计算型GIS空间分析并行化研究
Research on Scaling up of Remotely Sensed Data with Gaussian Pyramid Method
Received date: 2016-12-16
Request revised date: 2017-02-22
Online published: 2017-05-20
Copyright
尺度转换是遥感信息科学领域的研究热点,其传统研究方法大多局限于统计模型,对数据的空间结构信息考虑较少,很难满足遥感数据的多尺度表达要求。基于此,针对遥感数据的尺度不一致问题,本文提出了一种利用高斯金字塔的图像模糊特性进行遥感数据尺度上推的方法,在对金字塔每一层的数据高斯模糊的基础上,通过多次连续的降采样,得到一系列不同尺度的数据,从而满足实际应用的空间分辨率要求。为了验证本文所提方法的有效性,本文选择Landsat7 ETM影像和ASTER GDEM为研究数据进行尺度上推,并与传统的最邻近、双线性以及立方卷积等方法进行了实验对比,采用均值、方差、均方根误差、平均绝对误差等评价指标,以及相同分辨率的ASTER GDEM和SRTM DEM的等高线套合结果来衡量高斯金字塔方法的性能。实验结果表明,本文使用的高斯金字塔尺度上推方法能够有效地实现连续遥感数据的尺度转换,在保持遥感数据局部细节特征的基础上,较好地保持了原始遥感数据的信息量以及空间结构特征。
李乐 , 宋维静 , 陈腊娇 , 王力哲 , 高丹 . 遥感数据的高斯金字塔尺度上推方法研究[J]. 地球信息科学学报, 2017 , 19(5) : 682 -691 . DOI: 10.3724/SP.J.1047.2017.00682
Scale transformation has been a research hotspot in the field of remote sensing information science, and its processing methods are now limited to the traditional statistical methods. They consider less spatial structural information of data and can't satisfy the requirements of multi-scale expression. In view of scale inconsistency problems of remotely sensed data, this paper proposed a scaling up method based on image blurring characteristic of Gaussian pyramid. Firstly, this method made Gaussian blur using different filtering parameters for remotely sensed data, and it created several Gaussian blurring data in each layer of the pyramid model. Then Gaussian blurring data were processed by down-sampling constantly, and we obtained a series of different resolution of remotely sensed data. Accordingly, the multi-scale remotely sensed data could meet the spatial resolution requirements of practical application. In order to prove the effectiveness of the proposed method, this paper chose Landsat 7 ETM images and ASTER GDEM data to achieve scaling up. Also, we put forward quantitative evaluation indices including mean, variance, mean absolute error, root mean square error and conducted experiments to compare with the general methods of scaling up, such as nearest neighbor method, bilinear method and cubic convolution method. Besides, the performance of Gaussian pyramid method was measured through the results of contour sets between ASTER GDEM and SRTM DEM with the same resolution. Experimental results showed that Gaussian pyramid method in this paper can effectively realize the scaling up for continuous remotely sensed data, and the results are superior to other traditional methods. Gaussian pyramid method can also keep local characteristics of the details and maintain amount of information, spatial structural features of remotely sensed data. In summary, the using of Gaussian pyramid method in the field of remote sensing is a new attempt, and can provide necessary data preparation for multi-scale visual expression.
Key words: scale up; remotely sensed data; Gaussian pyramid; Gaussian blur; down-sampling
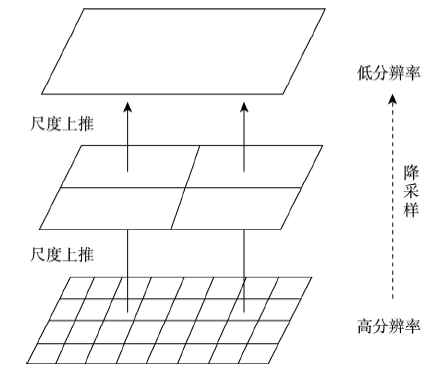
Fig. 1 The process of scaling up图1 尺度上推的过程示意图 |
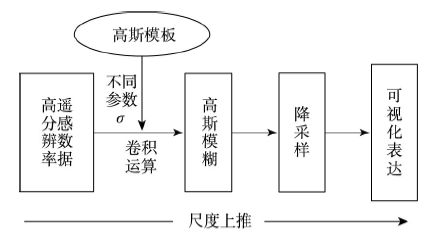
Fig. 2 The process of scaling up using Gaussian pyramid method图2 高斯金字塔尺度上推的流程图 |
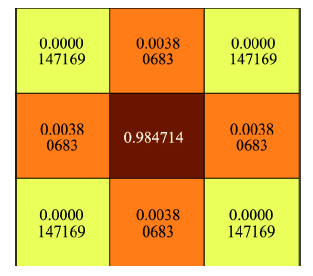
Fig. 3 Gaussian template of 3×3图3 高斯模板(3×3) |
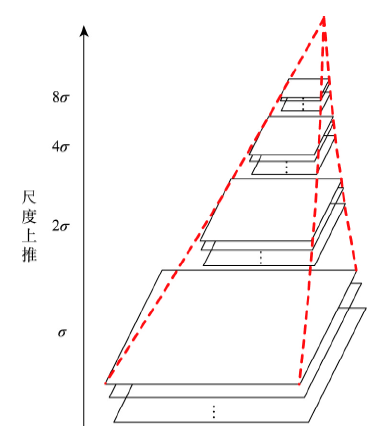
Fig. 4 Gaussian pyramid model of scaling up图4 尺度上推的金字塔模型 |
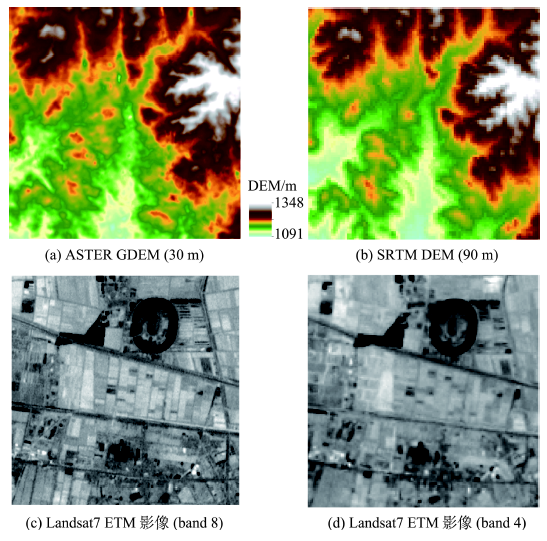
Fig. 5 Study areas图5 实验样区 |
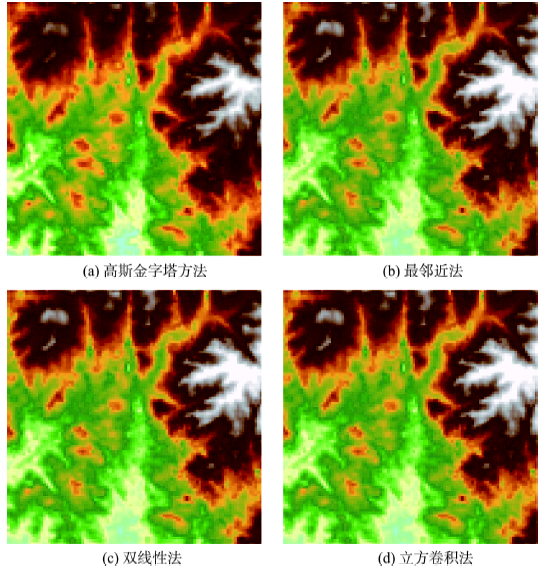
Fig. 6 Results of all the methods scaling up ASTER GDEM data to 90 m图6 ASTER GDEM数据尺度上推至90 m时各个方法的结果 |
Fig. 7 Results of all the methods scaling up ETM images (band 8) to 30 m图7 ETM影像(band 8)尺度上推至30 m时各个方法的结果 |
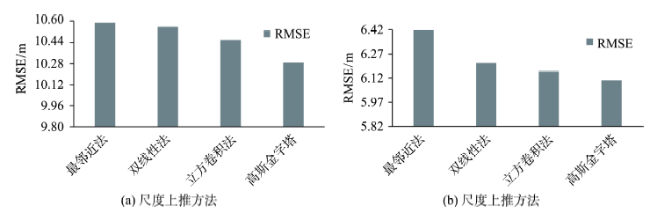
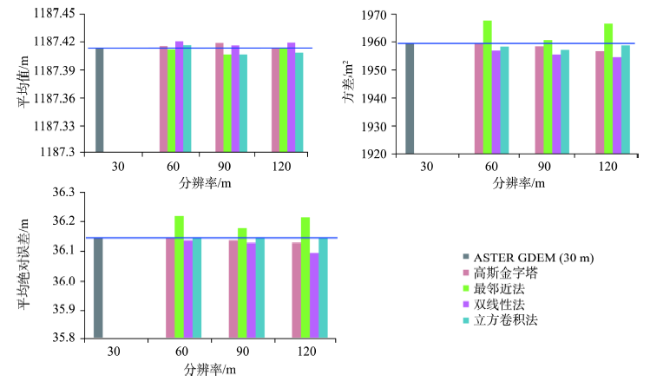
Fig. 9 Comparison of indices of different scaling up methods for ASTER GDEM图9 不同尺度上推方法的ASTER GDEM的指标比较 |
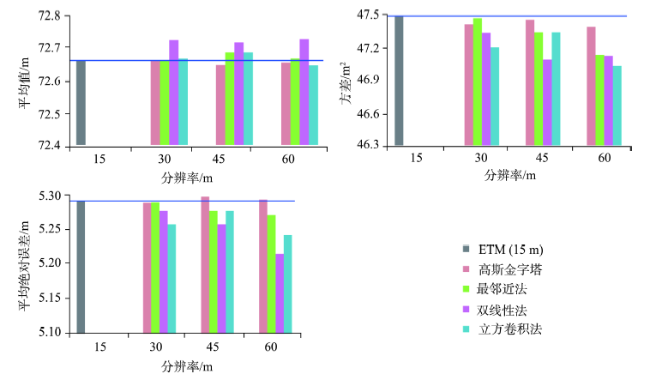
Fig. 10 Comparison of indices of different scaling up methods for ETM image (band 8)图10 不同尺度上推方法的ETM影像(band 8)的指标比较 |
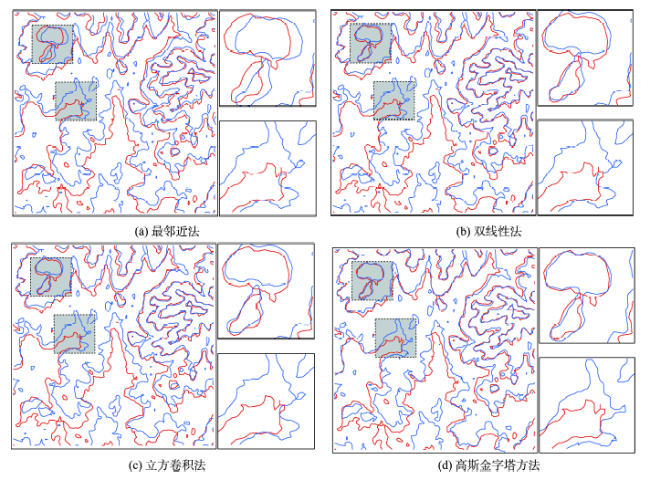
Fig. 11 All the methods about results of DEM contour set图11 各个方法DEM等高线的套合结果 |
The authors have declared that no competing interests exist.
| [1] |
[
|
| [2] |
|
| [3] |
|
| [4] |
|
| [5] |
[
|
| [6] |
|
| [7] |
[
|
| [8] |
[
|
| [9] |
[
|
| [10] |
|
| [11] |
|
| [12] |
[
|
| [13] |
[
|
| [14] |
|
| [15] |
[
|
| [16] |
[
|
| [17] |
|
| [18] |
|
| [19] |
|
/
| 〈 |
|
〉 |
