
最优分区与最优指数联合的水体信息提取
作者简介:饶 萍(1979-),女,贵州毕节人,博士生,研究方向为遥感图像处理及应用。E-mail:185483600@qq.com
收稿日期: 2016-11-23
要求修回日期: 2017-01-23
网络出版日期: 2017-05-20
基金资助
中央高校基本科研业务费专项资金项目(XDJK2011C089)
国家自然科学基金项目(40971122)
Water Extraction Based on the Optimal Subregion and the Optimal Indexes Combined
Received date: 2016-11-23
Request revised date: 2017-01-23
Online published: 2017-05-20
Copyright
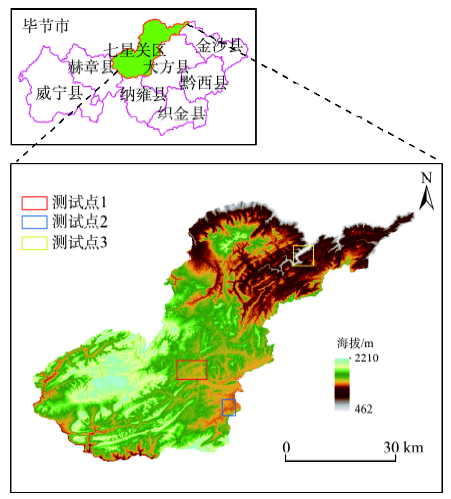
单波段阈值法和水体指数法具有方法简单、耗时少的优点,成为水体信息提取常用的方法,但对于面积较大、类型多样、影响因素复杂的区域,在全局使用任何一种方法均无法满足精度要求。为精确提取地表覆盖类型复杂、水体类型多样的山区水体信息,本文分别对归一化水体指数(MNDWI)、自动水体提取指数(AWEI)和归一化三波段指数(NDTBI)3种指数的阈值进行分析,以最优阈值分区方案进行分区并构建3个单指数决策树,寻找不同水体类型的最优指数,按照最优原则重构联合指数决策树来提取水体信息,其中,3种单指数提取法的Kappa系数分别为:0.863, 0.854, 0.862,最优指数联合决策树法的Kappa系数为 0.881。结果表明,基于3个指数构成的最优指数联合决策树的提取方法可以达到最高精度,由此说明,采用该法用于水体信息提取可得到最佳效果。
饶萍 , 王建力 . 最优分区与最优指数联合的水体信息提取[J]. 地球信息科学学报, 2017 , 19(5) : 702 -712 . DOI: 10.3724/SP.J.1047.2017.00702
It is very important to search a methodology to extract surface water quickly, accurately and efficiently. Single band thresholding and water indices are commonly used water extraction methods because of ease of use and the fact that these methods are computationally less time-consuming than alternative approaches. However, in environments where the area is larger, the type of water is various and the influencing factors are complicated, simple classification methods such as two-band water indices and single-band thresholding may not sufficiently and accurately distinguish between water and non-water pixels. In this paper, in order to extract water accurately in the complex mountain area where all the types of water and interference factor exist, the threshold value of three indices is analyzed respectively, that are Moderate Normal Different Water Index (MNDWI), Automate Water Extraction Index (AWEI) and Normal Difference Three Band Index (NDTBI). Then, the zoning scheme based on the optimal threshold value is used to build three decision classifier based on MNDWI, AWEI and NDTBI respectively. After that, comparative analysis is executed among the effect of the three classifiers for different types of surface water. Lastly, according to the optimal principal, a decision tree classifier of three indices (MNDWI, AWEI and NDTBI) united is reconstructed to extracted water. The results show: the Kappa coefficients means of three methods on single index MNDWI, AWEI and NDTBI in three test sites are 0.863, 0.854 and 0.862 respectively. The Kappa coefficients means of the combined indices method is 0.881. Thus, the water extraction method based on the optimal partition and three indices combined possess have the highest accuracy and the best effects. According to the research, we find that the key factor of the precision improved is the optimal zoning method based on the index to achieve hierarchical extraction. No matter which method among the single index or the united indices, the accuracy is all within the permitted range. In comparison of three single indices methods, extraction of region water such as lake and reservoir is suited for the MNDWI, the line water such as river and stream works best with AWEI, the small, narrow river affected by the channel sandstone has good success with NDTBI. However, the combination decision tree classification of the optimal zoning and the optimal method of indices united will be satisfied for water extraction.
Key words: water; decision tree; water index; information extract; remote sensing
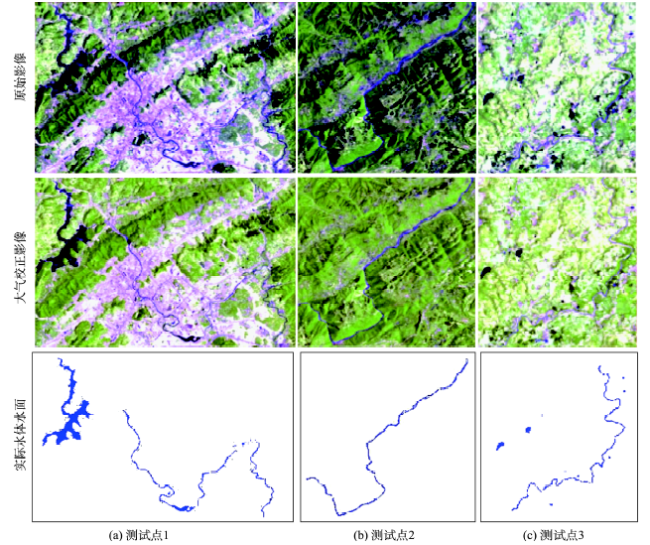
Fig. 2 The water and non-water noisy in the three test sites图2 3个测试点大气校正前后的彩色影像及水体解译结果 |
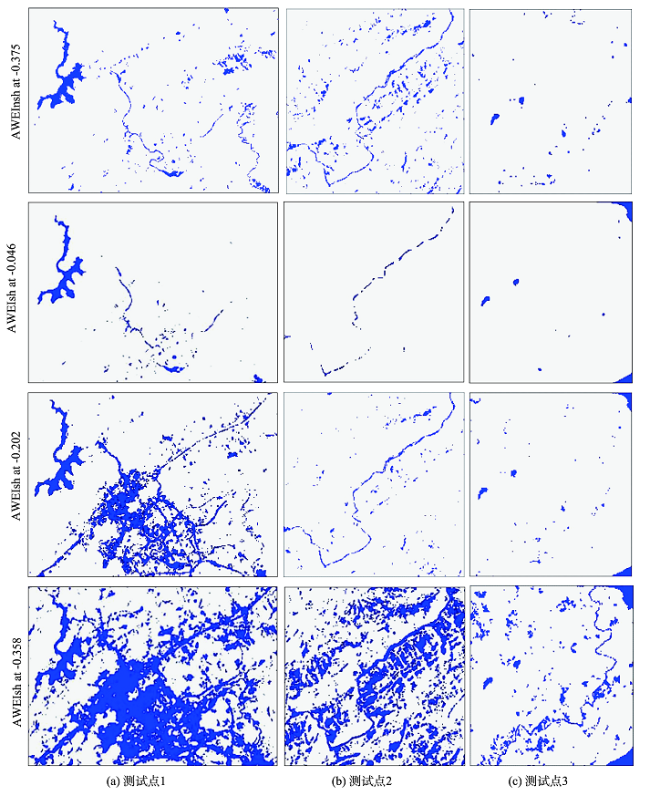
Fig. 3 Threshold images of AWEInsh and AWEIsh图3 AWEI指数阈值图像 |
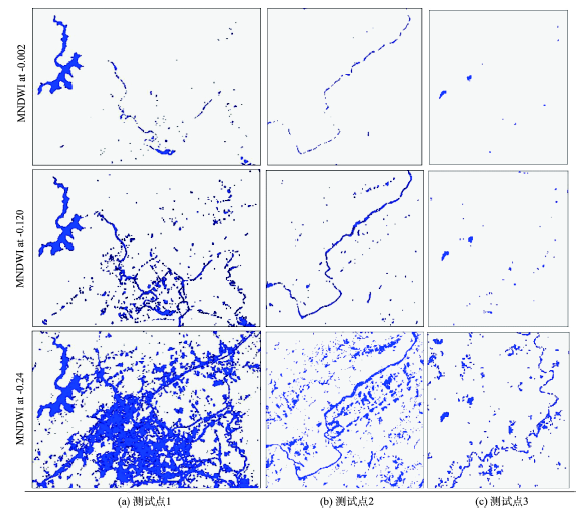
Fig. 4 Threshold images of MNDWI图4 MNDWI指数阈值图像 |
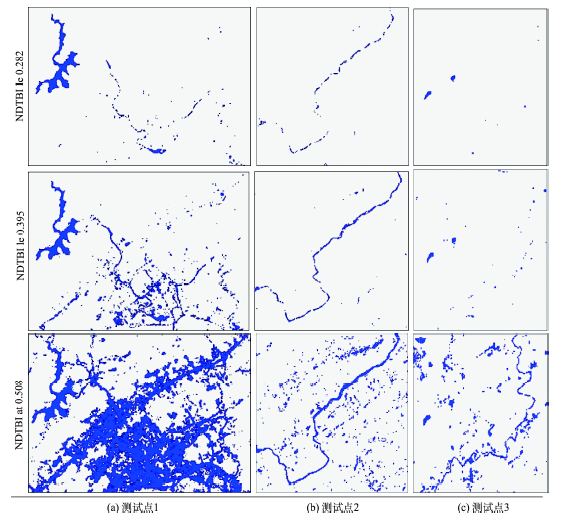
Fig. 5 Threshold images of NDTBI图5 NDTBI指数阈值图像 |
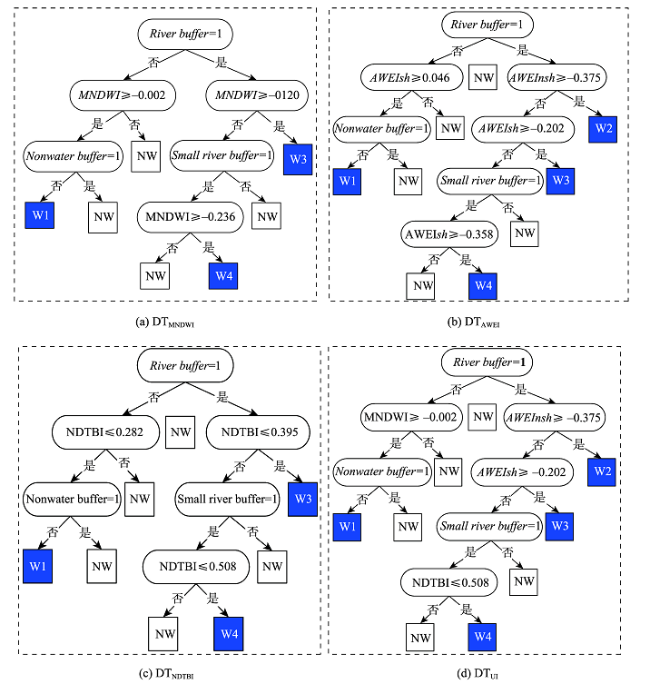
Fig. 6 Decision classifier trees based on the optimal partition and indexes图6 基于最优分区的指数决策树分类法 注:DTMNDWI、DTAWEI、DTNDTBI 分别为MNDWI、AWEI、NDTBI单一指数与空间信息联合的分层分类树,DTUI为3个指数与空间信息联合的分层分类树;W代表水体, NW代表非水体 |
Tab. 1 Summary of accuracy assessment at the two test sites表1 基于单一指数阈值分区的分层提取法精度评价 |
| 方法 | 测试点 | 生产者精度 | 用户精度 | 误分率 | 漏分率 | 总误差 | Kappa系数 |
|---|---|---|---|---|---|---|---|
| DTMNDWI | 1 | 91.57 | 80.31 | 19.69 | 8.43 | 28.12 | 0.8512 |
| 2 | 90.70 | 86.12 | 13.88 | 9.30 | 23.18 | 0.8818 | |
| 3 | 84.11 | 82.30 | 17.70 | 15.89 | 33.59 | 0.8288 | |
| DTAWI | 1 | 91.03 | 89.36 | 10.64 | 8.97 | 19.61 | 0.8990 |
| 2 | 81.73 | 91.28 | 8.72 | 18.27 | 26.99 | 0.8606 | |
| 3 | 80.93 | 85.53 | 14.47 | 19.07 | 33.54 | 0.8286 | |
| DTNDTBI | 1 | 85.25 | 93.09 | 6.91 | 14.75 | 21.66 | 0.8869 |
| 2 | 74.92 | 96.57 | 3.43 | 25.08 | 28.51 | 0.8419 | |
| 3 | 86.06 | 85.85 | 14.15 | 13.94 | 28.09 | 0.8570 | |
| DTUI | 1 | 92.30 | 87.79 | 12.21 | 7.70 | 19.91 | 0.8968 |
| 2 | 90.70 | 85.58 | 14.42 | 9.30 | 23.72 | 0.8789 | |
| 3 | 88.26 | 85.95 | 14.05 | 11.74 | 25.79 | 0.8685 |
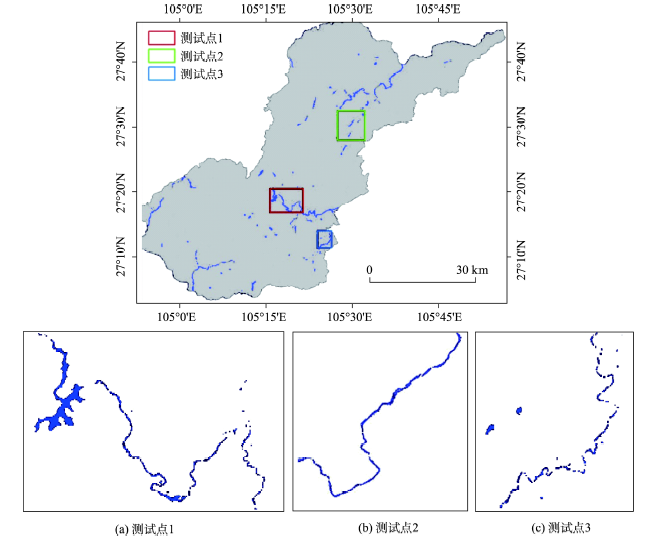
Fig. 7 Water extraction results based on the united method of the optimal partition and the optimal indexes at the three test sites图7 基于最优分区和最优指数联合的水体信息提取结果 |
The authors have declared that no competing interests exist.
| [1] |
|
| [2] |
|
| [3] |
|
| [4] |
|
| [5] |
|
| [6] |
|
| [7] |
|
| [8] |
|
| [9] |
|
| [10] |
|
| [11] |
|
| [12] |
|
| [13] |
|
| [14] |
|
| [15] |
[
|
| [16] |
[
|
| [17] |
[
|
| [18] |
|
| [19] |
|
| [20] |
|
| [21] |
|
| [22] |
|
| [23] |
[
|
| [24] |
[
|
| [25] |
[
|
| [26] |
|
| [27] |
[
|
/
| 〈 |
|
〉 |